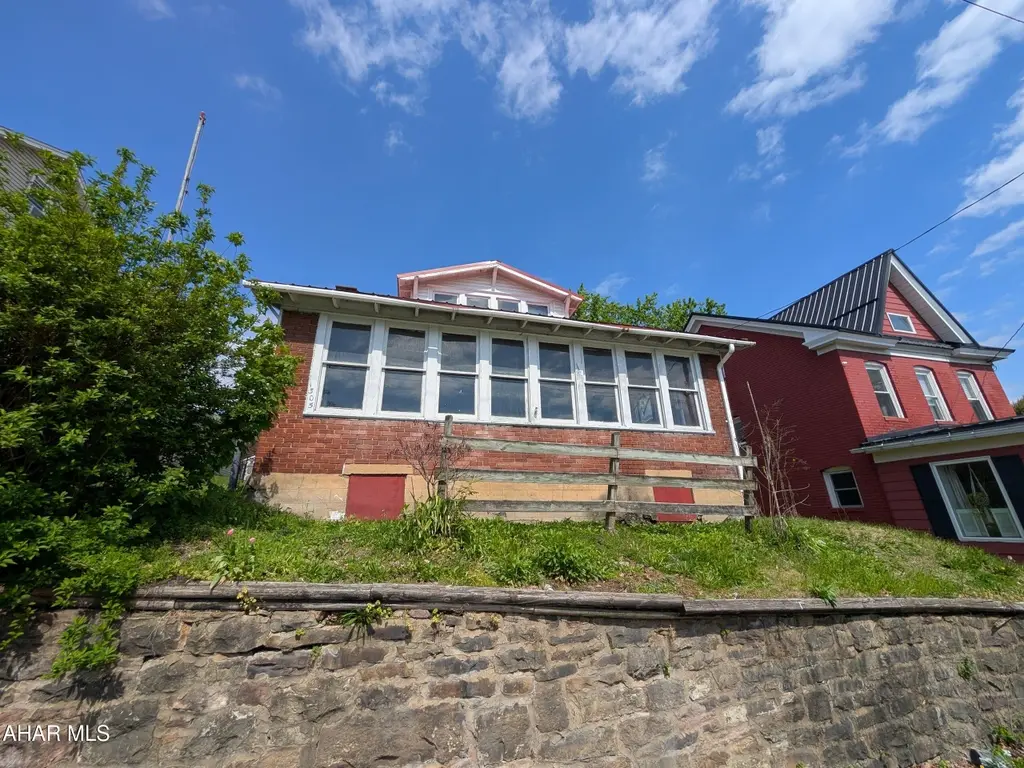
1305 N 4th Ave · Altoona, PA
Flood risk 1/10 · Minimal
- FEMA flood zone
- X (unshaded)
- Chance of flooding over 30 yrs
- 0.0%
- Est. flood insurance / yr
- $507 – $1,088
Fire risk 1/10 · Minimal
- Est. fire insurance / yr
- $511 – $949
Heat risk 3/10 · Minor
- Hot days now (above 91°F)
- 7 days/yr
- Hot days in 30 yrs
- 18 days/yr
Wind risk 2/10 · Minimal
- Chance of severe wind over 30 yrs
- —
Air-quality risk 2/10 · Minimal
- Unhealthy air days now
- 1 days/yr
- Unhealthy air days in 30 yrs
- 3 days/yr
Risk factors via First Street. Map © Google.
Why this score? — see what drove the B+ grade
The composite is a weighted blend of 9 inputs, each scored 0–100. Each bar is that input's sub-score; the figure is the points it added to the 100-point composite (weight × sub-score).
- Cash flow +30.0/30.0
- ARV discount +15.0/15.0
- DSCR +10.0/10.0
- 1% rule +9.8/10.0
- Livability +4.0/5.0
- Schools +3.1/10.0
- Rent growth +2.5/5.0
- Condition / age +1.5/5.0
- Appreciation +0.0/10.0
$69,900
🖨 Deal sheet 📄 Offer letter ✓ Due diligence
Listing remarks
Juniata brick and vinyl 1.5 story is perfect for investors or handy persons. Metal roof and off street parking to rear. Home was duplexed at one time, but buyer to check city zoning if duplex is permissible. AS-IS sale, seller will make no repairs. SECOND FLOOR EXTERIOR STAIRS ARE HAZARDOUS AND STRICTLY OFF LIMITS. Front exterior steps also hazardous.
Key facts
- Metal roof
- Off street parking
- 6,098 sq ft lot
Tags
Property features AI
Exterior
- Utilities: Public water
- Home design: Single family residence; One and one half stories
- Construction: Brick and vinyl siding construction; Metal roof
- Exterior features: Deck
Interior
- Kitchen: Dishwasher
- Flooring: Vinyl flooring; Carpet flooring
- Bathrooms: 2 full bathrooms
- Heating & cooling: Forced air heating; Natural gas heating; Ceiling fan(s) for cooling
- Interior features: Dishwasher; Ceiling fan(s); Has basement
Neighborhood map
What this means for you Summary
Snapshot
- This is a 2-bed/2.0-bath single-family listed at $70k. Condition is rated poor.
Deal economics
- At list price, monthly cash flow is $333 ($4k/yr) — positive.
- The deal already cash-flows at list — no discount required.
- Meets the 1% rule at list price ($1k rent vs $70k).
- Recommended offer: $68k (3.0% below list) — sets the bar for market timing.
- Cap rate 12.0% vs local median 5.8% in Altoona — top-decile yield for the area; either an underpriced asset or a hidden risk that comps aren't pricing in. Stress-test before assuming the spread holds.
Location & tenants
- Location reads 79/100 on livability (#237 in PA, #2,060 nationally) — a middle-class / working-renter tenant base. Strengths: commute A+, cost of living A+, housing A+; Watch: crime C-, employment D, amenities F.
- Altoona Area SD (urban): math 30% / reading 44% proficiency, ranked #406 of 539 in PA (top 75%) — families likely to look elsewhere, expect single-tenant / working-renter base with shorter leases.
- Market conditions: 186 active listings in the ZIP; 99 units permitted in Blair County in 2024 (0 in 5+ unit buildings).
Forward outlook
- Local home prices are declining (-3.0%/yr); year-one equity from $483 of loan paydown is wiped out by about $2k of value loss. Plan a longer hold.
- Blair County population projected at -18% by 2050 — secular population decline; favor cash flow + early exit over multi-decade hold.
- At projected returns (-3.0% appreciation + 3.0% rent growth), your $20k cash investment doubles in ~6 years — after that, you're playing with house money.
Negotiation context
- It's been on market 49 days — a 3% lower offer ($68k) is reasonable based on typical stale-listing flexibility.
Risks & watch-outs
- Watch-outs: built in 1938 — expect roof / HVAC / electrical / plumbing capex.
Questions for the listing agent
- It's been on market 49 days. Have you received any prior offers? Is the seller open to a 3% concession, seller financing, or rate buy-down credit?
- Have any recent inspections been done? Can we get a copy of the seller's disclosures and any deferred-maintenance estimates?
- Built in 1938 — when were the roof, HVAC, electrical panel, plumbing, and water heater last replaced?
- Is there a deadline driving the sale (1031 exchange, divorce, estate, relocation)? That informs how much negotiation room exists.
- Schools are B-rated — typically a magnet for longer-tenancy family renters. What's the average tenant stay here, and is there a school-zone premium baked into asking?
- What's the average days-on-market for RENTAL listings here right now (not sales)? A rising rental-DOM trend means longer vacancies and softer asking-rent achievability than the comps imply.
- What's the recent tenant-quality profile in this submarket — average credit score on applications, eviction rate, late-payment / NSF rate, and stable-employment percentage? A property-management company in the area should have these aggregated.
- How much new for-sale + rental construction is in the pipeline within 1–3 miles? Heavy new supply typically softens prices + rents 12–24 months out; constrained supply supports both.
Investment metrics
- 1% rule
- 1.48% ✓
- Cap rate
- 12.01%
- Cash-on-cash
- 20.40%
- DSCR
- 1.91
- GRM
- 5.6
CMA / ARV
- ARV (median comp)
- $107,543
- List price
- $69,900
- Delta
- -35.00%
- Verdict
- UNDERPRICED
- Comps
- 20 within 1.0 mi
Show comp detail 5 sales within ~0.75 mi
| Address | Dist | Beds/Ba | Sqft | Sold | Price | $/sf | Match |
|---|---|---|---|---|---|---|---|
| 708 N 5th Ave | 0.49mi | 3/1.0 (+1) | 1,946 (-7%) | 1mo | $89,500 | $46 | 56 |
| 1668 Juniata Ln | 0.73mi | 3/2.0 (+1) | 1,802 (-14%) | 3mo | $238,000 | $132 | 36 |
| 616 N 8th Ave | 0.59mi | 3/1.0 (+1) | 1,836 (-12%) | 10mo | $99,900 | $54 | 35 |
| 506 N 10th Ave | 0.72mi | 3/1.5 (+1) | 2,240 (+7%) | 19mo | $169,900 | $76 | 31 |
| 516 5th Ave | 0.63mi | 3/1.0 (+1) | 1,884 (-10%) | 19mo | $21,000 | $11 | 30 |
Match score weights: distance 35% · size 25% · config 20% · recency 20%. Top-matched comps best support the ARV.
Projected returns pro-forma
-3.0% appreciation · 3.0% rent growth · sell at horizon
- IRR
- 12.7%
- Equity multiple
- 1.50×
- Total profit
- $9,881
- Equity at exit
- $10,422
- IRR
- 21.6%
- Equity multiple
- 2.84×
- Total profit
- $35,956
- Equity at exit
- $6,044
Cash invested: $19,572 (down + closing). Projections, not guarantees.
Landlord ↔ Tenant lean methodology
- Overall (STATE)
- 62 Landlord-Friendly
- State Pennsylvania
- 62 Landlord-Friendly · EVEN
- County
- — inherits STATE
- City
- — inherits STATE
ZIP-level market 16601
- Home prices YoY
- -24.9%
- Active inventory
- 186
- Price-to-rent
- 5.6×
Monthly cashflow live
- Estimated rent
- $1,033 medium interval (Pro) →
- Mortgage (P&I)
- −$367
- Tax est. 1.5%
- −$87 /mo · $1,048/yr
- Insurance
- −$29
- HOA
- −$0
- Vacancy / Maint / Mgmt
- −$217
- Net cashflow
- $333
Break-even live
UW: 25.0% down · 7.5% · 30yr · 1.5% tax · 5.0% vac · 8.0% maint · 8.0% mgmt
Financing live
Cash to close
- Down payment
- $17,475
- Closing costs
- $2,097
- Reserves months
- —
- Total cash needed
- —
Loan-product check · same deal, 3 products live
Conventional
25% down · 7.5% · 30yr
- Down + closing
- —
- Monthly P&I
- —
- Monthly cashflow
- —
- DSCR
- —
- Eligible?
- —
Personal DTI + credit; lowest rate.
DSCR
20% down · 8.5% · 30yr
- Down + closing
- —
- Monthly P&I
- —
- Monthly cashflow
- —
- DSCR
- —
- Eligible?
- —
No personal income docs; deal must DSCR.
Hard money
10% down · 12.0% · 12mo
- Down + closing
- —
- Monthly P&I
- —
- Monthly cashflow
- —
- DSCR
- —
- Eligible?
- —
Short-term bridge; refi at stabilization.
Listing history 19 events
-
2026-06-19days on market $69,900 Active 49 DOM
-
2026-06-18days on market $69,900 Active 48 DOM
-
2026-06-17days on market $69,900 Active 47 DOM
-
2026-06-16days on market $69,900 Active 46 DOM
-
2026-06-15days on market $69,900 Active 45 DOM
-
2026-06-14days on market $69,900 Active 43 DOM
-
2026-06-13days on market $69,900 Active 42 DOM
-
2026-06-10days on market $69,900 Active 40 DOM
-
2026-06-09days on market $69,900 Active 39 DOM
-
2026-06-08days on market $69,900 Active 38 DOM
-
2026-06-07days on market $69,900 Active 37 DOM
-
2026-06-05days on market $69,900 Active 34 DOM
-
2026-06-03days on market $69,900 Active 33 DOM
-
2026-06-03price $69,900 Active 32 DOM
-
2026-06-02days on market $74,900 Active 32 DOM
-
2026-06-01days on market $74,900 Active 31 DOM
-
2026-05-31days on market $74,900 Active 30 DOM
-
2026-05-30days on market $74,900 Active 29 DOM
-
2026-04-30$74,900 Active 353-char remark
ⓘ Source: listings_history table (triggers on properties + properties_extension) + one-shot
backfill from property_details.listing_events for pre-trigger history.
Climate risk First Street
- Flood 1/10 Low FEMA zone X (unshaded) · 0% chance over 30 yrs
- Wildfire 1/10 Low
- Heat 3/10 Moderate 7 d/yr ≥91°F today · 18 d/yr by 30 yrs out
- Wind 2/10 Low
- Air quality 2/10 Low 1 unhealthy d/yr today · 3 by 30 yrs out
Nearby sold comps map
Loading sold comps map…
Walkable amenities ~0.75 mi
Loading nearby amenities…
Taxation est. · year 1
- Rental income
- $12,392
- − Mortgage interest
- −$3,915
- − Property taxes
- −$1,048
- − Insurance
- −$350
- − Repairs & maintenance
- −$991
- − Management
- −$991
- − Depreciation
- −$2,033
- Taxable income
- $3,062
- Est. tax owed @ 24.0%
- −$735
- After-tax cash flow
- $3,258/yr
For passive investors: Depreciation is non-cash, so a rental often shows a tax loss while cash-flowing — sheltering income. Rental losses are passive: they offset passive income freely, and up to $25,000/yr can offset ordinary (W-2) income if you actively participate and your MAGI is under $100k (phasing out to $0 by $150k); unused losses carry forward. On sale, claimed depreciation is recaptured at up to 25%, and gains may owe capital-gains tax (a 1031 exchange can defer both). Figures are a year-1 estimate at your 24.0% rate — not tax advice; consult a CPA.
Condition & rehab AI · 12 photos
This property requires extensive repairs and updates to bring it up to a livable condition. The home is in poor condition and would benefit from a thorough renovation.
Repairs flagged
- Major exterior stairs — Hazardous and strictly off limits
- Major exterior siding — Exposed brick and deteriorated siding
- Major kitchen cabinets — Outdated and in poor condition
- Major bathroom fixtures — Outdated and in poor condition
- Major windows — Old and some broken
Value-add opportunities
- Resale Paint interior walls — Fresh paint can make a significant difference in the home's appearance
- Resale Replace flooring — New flooring can improve the home's overall look and feel
- Resale Replace kitchen cabinets — New cabinets can significantly enhance the kitchen's functionality and appearance
- Resale Replace bathroom fixtures — New fixtures can improve the bathroom's functionality and appearance
- Resale Replace windows — New windows can improve the home's energy efficiency and curb appeal
Renovation cost estimate screening
| Repair item | Severity | Est. cost |
|---|---|---|
| exterior stairs · Hazardous and strictly off limits | Major | $15,000–50,000 |
| exterior siding · Exposed brick and deteriorated siding | Major | $15,000–50,000 |
| kitchen cabinets · Outdated and in poor condition | Major | $15,000–50,000 |
| bathroom fixtures · Outdated and in poor condition | Major | $15,000–50,000 |
| windows · Old and some broken | Major | $15,000–50,000 |
| Total estimated repair cost · 5 items | $75,000–250,000 |
Value-add ROI direction
- Resale Paint interior walls — Fresh paint can make a significant difference in the home's appearance ↑
- Resale Replace flooring — New flooring can improve the home's overall look and feel ↑
- Resale Replace kitchen cabinets — New cabinets can significantly enhance the kitchen's functionality and appearance ↑
- Resale Replace bathroom fixtures — New fixtures can improve the bathroom's functionality and appearance ↑
- Resale Replace windows — New windows can improve the home's energy efficiency and curb appeal ↑
ⓘ Cost ranges are severity-bucket heuristics (US national rule-of-thumb). Get contractor quotes + a written scope before underwriting a rehab budget.
Schools (NCES district)
- District
- Altoona Area SD
- NCES district ID
- 4202340
- Math proficiency
- 30% ▼ -15.00%
- Reading proficiency
- 44% ▼ -15.00%
- Median HH income
- $38,465
- Composite
- 30.85/100
- National rank
- #6130
- State rank
- #406 of 539 in PA
Livability — Altoona
- Score
- 79/100
- State rank
- #237
- US rank
- #2060
Category grades
Schools grade is shown separately in the Schools card above.
Census & demographics
- Census place
- Altoona, PA
- County
- Blair County · 59,867 people
- City population
- 59,867
- Metro
- Altoona, PA
- Population (ZIP)
- 33,515
- Household income
- $58,070
- Rent vs Own
- Severe rent burden
- 715.0
Population outlook (Blair County) Hauer SSP2
- Today (2025)
- 121,571 people
- By 2030
- 117,966 · -3.0%
- By 2040
- 109,174 · -10.2%
- By 2050
- 99,542 · -18.1%
- By 2075
- 76,775 · -36.8%
- By 2100
- 54,326 · -55.3%
Race, ethnicity, and origin ACS 2023
- Neighborhood character
- Predominantly White (90%)
- Race & ethnicity
- White 90% Two or more races 5% Black 3% Hispanic / Latino 1%
- Common ancestry
- Romanian 5% Slovak 2% Lithuanian 2%
- Foreign-born
- 1% · Vietnam
- Languages at home
- 97% English-only · German/W. Germanic 1% Spanish 1%
Political lean MEDSL · Blair
- 2024 margin
- Solid R (+43.5) · D 27.9% · R 71.4%
- 2008→2024 swing
- -19.2pp toward R · 2008: -24.3pp · 2024: -43.5pp
- All cycles
- 2024: R+43.5 2020: R+43.5 2016: R+46.4 2012: R+33.5 2008: R+24.3
Not yet ingested
- Civics
- —
Market trends
- HPI YoY
- ▼ -60.97%
- Current HPI
- 183.9907
- Rent YoY
- —
- Metro
- Altoona, PA
- State GDP YoY
- ▲ 1.68%
- F500 in state
- 34
Industry mix (Fortune 500 HQ in PA)
| Industry | F500 HQs | Revenue |
|---|---|---|
| Healthcare | 2 | $309B |
|
||
| Insurance | 2 | $27B |
|
||
| Telecommunications / Media | 1 | $124B |
|
||
| Industrial Distribution | 1 | $22B |
|
||
| Financial Services | 1 | $20B |
|
||
| Chemicals / Materials | 1 | $18B |
|
||
Price history
-6.7% since first listed2 events — show timeline
- 2026-06-02 Price Changed $69,900 AHARMLS
- 2026-04-30 Listed $74,900 AHARMLS
Cash-flow waterfall
monthlySold comps — $/sqft
last 12 mo · ≤1 miLoading sold comps…