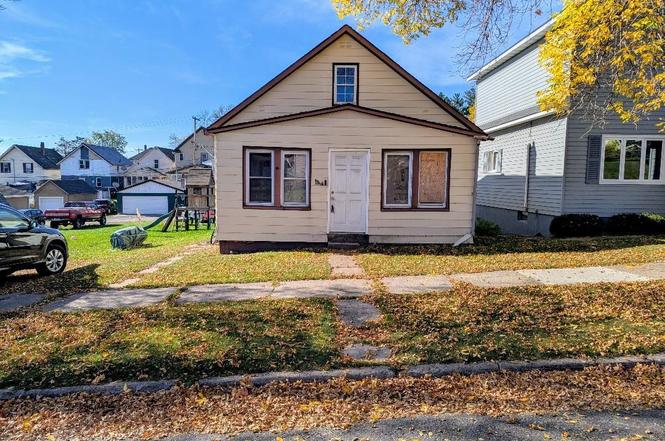
111 W Nebraska Ave Unit PO Box 821 · Gilbert, MN
Flood risk 4/10 · Minor
- FEMA flood zone
- X
- Chance of flooding over 30 yrs
- 0.22%
- Est. flood insurance / yr
- $473 – $860
Fire risk 5/10 · Moderate
- Est. fire insurance / yr
- $888 – $1,650
Heat risk 1/10 · Minimal
- Hot days now (above 90°F)
- 7 days/yr
- Hot days in 30 yrs
- 13 days/yr
Wind risk 1/10 · Minimal
- Chance of severe wind over 30 yrs
- —
Air-quality risk 2/10 · Minimal
- Unhealthy air days now
- 2 days/yr
- Unhealthy air days in 30 yrs
- 2 days/yr
Risk factors via First Street. Map © Google.
Why this score? — see what drove the A- grade
The composite is a weighted blend of 9 inputs, each scored 0–100. Each bar is that input's sub-score; the figure is the points it added to the 100-point composite (weight × sub-score).
- Cash flow +30.0/30.0
- 1% rule +10.0/10.0
- DSCR +10.0/10.0
- Appreciation +10.0/10.0
- ARV discount +7.5/15.0
- Schools +5.0/10.0
- Livability +3.1/5.0
- Rent growth +2.5/5.0
- Condition / age +2.5/5.0
$54,900
🖨 Deal sheet 📄 Offer letter ✓ Due diligence
Listing remarks
This is your opportunity to fix and flip, investment property, or even completely gut out the house and make it into your own home. Please be aware and be cautious since the interior of the house has possible mold, beetle infested and the water, electricity, and gas have been turned off. Selling As - Is. No sign on the property
Key facts
- 6,970 sq ft lot
- Garage
- Built 1910
Property features AI
Exterior
- Parking: Detached off-street garage with 1 garage space
- Utilities: Public water; Public sewer
- Home design: Single-family detached residence; One-story
- Construction: Steel siding
- Exterior features: Asphalt shingle roof; Publicly maintained road access
Interior
- Bedrooms: Master located downstairs
- Bathrooms: 1 full bathroom
- Heating & cooling: Natural gas heating
- Interior features: Master bedroom on the main level; Full basement
Neighborhood map
What this means for you Summary
Snapshot
- This is a 3-bed/1.0-bath single-family listed at $55k.
Deal economics
- At list price, monthly cash flow is $464 ($6k/yr) — positive.
- The deal already cash-flows at list — no discount required.
- Meets the 1% rule at list price ($1k rent vs $55k).
- Recommended offer: $48k (12.0% below list) — sets the bar for market timing.
Location & tenants
- Location reads 62/100 on livability (#704 in MN) — a middle-class / working-renter tenant base. Strengths: cost of living A+, housing A+; Watch: employment C-, health & safety D, schools D-.
- Market conditions: 26 active listings in the ZIP; 639 units permitted in St. Louis County in 2024 (338 in 5+ unit buildings).
Forward outlook
- In year one you build about $6k of equity ($380 loan paydown + $5k appreciation (10.0% local appreciation)).
- At projected returns (10.0% appreciation + 3.0% rent growth), your $15k cash investment doubles in ~2 years — after that, you're playing with house money.
- By year 6, paydown + projected appreciation supports a ~$35k cash-out refi (75% LTV) — recoverable capital for the next deal without selling this one.
Negotiation context
- It's been on market 232 days — a 12% lower offer ($48k) is reasonable based on typical stale-listing flexibility.
Risks & watch-outs
- Watch-outs: built in 1910 — expect roof / HVAC / electrical / plumbing capex.
- Climate carrying-cost: moderate wildfire risk — expect insurance premiums to compound above CPI over the hold.
Questions for the listing agent
- It's been on market 232 days. Have you received any prior offers? Is the seller open to a 12% concession, seller financing, or rate buy-down credit?
- Built in 1910 — when were the roof, HVAC, electrical panel, plumbing, and water heater last replaced?
- Why hasn't it sold? Are there any deal-killer items the seller is aware of (foundation, flood, title, zoning, code violations)?
- Is there a deadline driving the sale (1031 exchange, divorce, estate, relocation)? That informs how much negotiation room exists.
- Schools are D-rated, which usually means shorter tenancies and higher turnover. Who's the typical renter profile here, and what's been the actual vacancy rate?
- Crime grade is F in this area — have there been break-ins, vandalism, or insurance claims at this property in the last 3 years? What carrier currently insures it and at what premium?
- What's the average days-on-market for RENTAL listings here right now (not sales)? A rising rental-DOM trend means longer vacancies and softer asking-rent achievability than the comps imply.
- What's the recent tenant-quality profile in this submarket — average credit score on applications, eviction rate, late-payment / NSF rate, and stable-employment percentage? A property-management company in the area should have these aggregated.
- How much new for-sale + rental construction is in the pipeline within 1–3 miles? Heavy new supply typically softens prices + rents 12–24 months out; constrained supply supports both.
Investment metrics
- 1% rule
- 1.94% ✓
- Cap rate
- 16.43%
- Cash-on-cash
- 36.20%
- DSCR
- 2.61
- GRM
- 4.3
CMA / ARV
- ARV (on-the-fly)
- $136,080
- Comps found
- 7
Show comp detail 7 sales within ~0.75 mi
| Address | Dist | Beds/Ba | Sqft | Sold | Price | $/sf | Match |
|---|---|---|---|---|---|---|---|
| 106 New York Ave W | 0.04mi | 2/1.0 (-1) | 1,047 (-3%) | 13mo | $95,000 | $91 | 78 |
| 112 E Nebraska Ave | 0.03mi | 3/1.0 | 950 (-12%) | 12mo | $120,000 | $126 | 68 |
| 510 Broadway St S | 0.16mi | 3/2.0 | 1,232 (+14%) | 1mo | $155,000 | $126 | 64 |
| 112 Nebraska Ave Ave E | 0.13mi | 3/1.0 | 950 (-12%) | 12mo | $120,000 | $126 | 63 |
| 107 W Louisiana Ave | 0.22mi | 2/1.0 (-1) | 1,176 (+9%) | 10mo | $125,000 | $106 | 61 |
| 115 E Indiana Ave | 0.44mi | 2/1.0 (-1) | 920 (-15%) | 9mo | $40,000 | $43 | 42 |
| 117 Boulder Blvd | 0.71mi | 2/1.5 (-1) | 1,232 (+14%) | 10mo | $162,000 | $131 | 28 |
Match score weights: distance 35% · size 25% · config 20% · recency 20%. Top-matched comps best support the ARV.
Projected returns pro-forma
10.0% appreciation · 3.0% rent growth · sell at horizon
- IRR
- 52.1%
- Equity multiple
- 4.87×
- Total profit
- $59,448
- Equity at exit
- $49,458
- IRR
- 45.7%
- Equity multiple
- 10.88×
- Total profit
- $151,872
- Equity at exit
- $106,659
Cash invested: $15,372 (down + closing). Projections, not guarantees.
Landlord ↔ Tenant lean methodology
- Overall (STATE)
- 46 Balanced
- State Minnesota
- 46 Balanced · D+2
- County
- — inherits STATE
- City
- — inherits STATE
ZIP-level market 55741
- Home prices YoY
- 23.4%
- Active inventory
- 26
- Price-to-rent
- 4.3×
Monthly cashflow live
- Estimated rent
- $1,067 medium interval (Pro) →
- Mortgage (P&I)
- −$288
- Tax est. 1.5%
- −$69 /mo · $824/yr
- Insurance
- −$23
- HOA
- −$0
- Vacancy / Maint / Mgmt
- −$224
- Net cashflow
- $464
Break-even live
UW: 25.0% down · 7.5% · 30yr · 1.5% tax · 5.0% vac · 8.0% maint · 8.0% mgmt
Financing live
Cash to close
- Down payment
- $13,725
- Closing costs
- $1,647
- Reserves months
- —
- Total cash needed
- —
Loan-product check · same deal, 3 products live
Conventional
25% down · 7.5% · 30yr
- Down + closing
- —
- Monthly P&I
- —
- Monthly cashflow
- —
- DSCR
- —
- Eligible?
- —
Personal DTI + credit; lowest rate.
DSCR
20% down · 8.5% · 30yr
- Down + closing
- —
- Monthly P&I
- —
- Monthly cashflow
- —
- DSCR
- —
- Eligible?
- —
No personal income docs; deal must DSCR.
Hard money
10% down · 12.0% · 12mo
- Down + closing
- —
- Monthly P&I
- —
- Monthly cashflow
- —
- DSCR
- —
- Eligible?
- —
Short-term bridge; refi at stabilization.
Listing history 18 events
-
2026-06-19days on market $54,900 Active 232 DOM
-
2026-06-18days on market $54,900 Active 231 DOM
-
2026-06-17days on market $54,900 Active 230 DOM
-
2026-06-16days on market $54,900 Active 229 DOM
-
2026-06-15days on market $54,900 Active 228 DOM
-
2026-06-14days on market $54,900 Active 226 DOM
-
2026-06-13days on market $54,900 Active 225 DOM
-
2026-06-10days on market $54,900 Active 223 DOM
-
2026-06-09days on market $54,900 Active 222 DOM
-
2026-06-08days on market $54,900 Active 221 DOM
-
2026-06-07days on market $54,900 Active 220 DOM
-
2026-06-05days on market $54,900 Active 217 DOM
-
2026-06-03days on market $54,900 Active 216 DOM
-
2026-06-02days on market $54,900 Active 215 DOM
-
2026-06-01days on market $54,900 Active 214 DOM
-
2026-05-31days on market $54,900 Active 213 DOM
-
2026-05-30days on market $54,900 Active 212 DOM
-
2025-10-30$54,900 Active
ⓘ Source: listings_history table (triggers on properties + properties_extension) + one-shot
backfill from property_details.listing_events for pre-trigger history.
Climate risk First Street
- Flood 4/10 Moderate FEMA zone X · 22% chance over 30 yrs
- Wildfire 5/10 Major
- Heat 1/10 Low 7 d/yr ≥90°F today · 13 d/yr by 30 yrs out
- Wind 1/10 Low
- Air quality 2/10 Low 2 unhealthy d/yr today · 2 by 30 yrs out
Nearby sold comps map
Loading sold comps map…
Walkable amenities ~0.75 mi
Loading nearby amenities…
Taxation est. · year 1
- Rental income
- $12,806
- − Mortgage interest
- −$3,075
- − Property taxes
- −$824
- − Insurance
- −$274
- − Repairs & maintenance
- −$1,024
- − Management
- −$1,024
- − Depreciation
- −$1,597
- Taxable income
- $4,987
- Est. tax owed @ 24.0%
- −$1,197
- After-tax cash flow
- $4,367/yr
For passive investors: Depreciation is non-cash, so a rental often shows a tax loss while cash-flowing — sheltering income. Rental losses are passive: they offset passive income freely, and up to $25,000/yr can offset ordinary (W-2) income if you actively participate and your MAGI is under $100k (phasing out to $0 by $150k); unused losses carry forward. On sale, claimed depreciation is recaptured at up to 25%, and gains may owe capital-gains tax (a 1031 exchange can defer both). Figures are a year-1 estimate at your 24.0% rate — not tax advice; consult a CPA.
Schools (NCES district)
No district data.
Livability — Gilbert
- Score
- 62/100
- State rank
- #704
- US rank
- #16952
Category grades
Schools grade is shown separately in the Schools card above.
Census & demographics
- Census place
- Gilbert, MN
- Population (ZIP)
- 2,933
Population outlook (St. Louis County) Hauer SSP2
- Today (2025)
- 202,411 people
- By 2030
- 203,234 · +0.4%
- By 2040
- 202,520 · +0.1%
- By 2050
- 200,853 · -0.8%
- By 2075
- 200,943 · -0.7%
- By 2100
- 192,058 · -5.1%
Race, ethnicity, and origin ACS 2023
- Neighborhood character
- Predominantly White (97%)
- Race & ethnicity
- White 97% Two or more races 3%
- Common ancestry
- Portuguese 11% Romanian 6% Lithuanian 3%
- Foreign-born
- 1%
Political lean MEDSL · St. Louis
- 2024 margin
- D (+13.7) · D 55.9% · R 42.2% · Other 1.8%
- 2008→2024 swing
- -18.8pp toward R · 2008: 32.5pp · 2024: 13.7pp
- All cycles
- 2024: D+13.7 2020: D+15.6 2016: D+11.8 2012: D+29.6 2008: D+32.5
Not yet ingested
- Civics
- —
Market trends
- HPI YoY
- ▲ 58.57%
- Current HPI
- 308.63
- Rent YoY
- —
- Metro
- —
- State GDP YoY
- ▲ 2.41%
- F500 in state
- 34
Industry mix (Fortune 500 HQ in MN)
| Industry | F500 HQs | Revenue |
|---|---|---|
| Healthcare | 2 | $407B |
|
||
| Retail | 2 | $150B |
|
||
| Consumer Goods | 2 | $32B |
|
||
| Industrial Machinery | 2 | $6B |
|
||
| Agriculture | 1 | $40B |
|
||
| Healthcare / Medical Devices | 1 | $32B |
|
||
Price history
1 event — show timeline
- 2025-10-30 Listed $54,900 LSAR
Cash-flow waterfall
monthlySold comps — $/sqft
last 12 mo · ≤1 miLoading sold comps…