 Multi-family
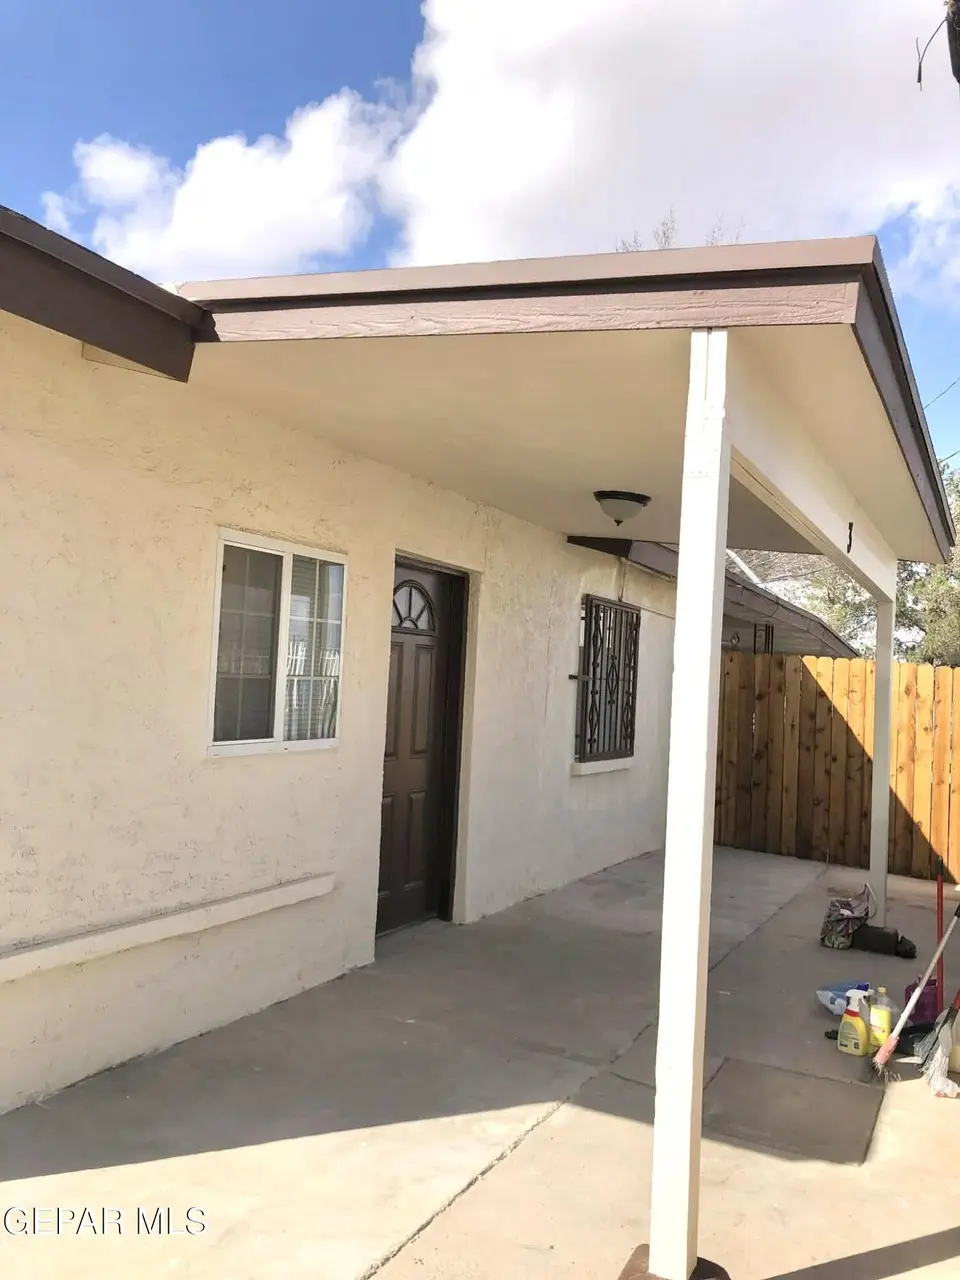
801 Delhi Dr · Socorro, TX
Flood risk No data
- FEMA flood zone
- —
- Chance of flooding over 30 yrs
- —
- Est. flood insurance / yr
- —
Fire risk No data
- Est. fire insurance / yr
- —
Heat risk No data
- Hot days now (above threshold)
- —
- Hot days in 30 yrs
- —
Wind risk No data
- Chance of severe wind over 30 yrs
- —
Air-quality risk No data
- Unhealthy air days now
- —
- Unhealthy air days in 30 yrs
- —
Risk factors via First Street. Map © Google.
Why this score? — see what drove the B grade
The composite is a weighted blend of 9 inputs, each scored 0–100. Each bar is that input's sub-score; the figure is the points it added to the 100-point composite (weight × sub-score).
- Cash flow +30.0/30.0
- 1% rule +10.0/10.0
- DSCR +10.0/10.0
- ARV discount +7.5/15.0
- Appreciation +4.5/10.0
- Rent growth +3.8/5.0
- Livability +3.2/5.0
- Schools +2.6/10.0
- Condition / age +2.5/5.0
$249,950
🖨 Deal sheet (PDF) 📄 Offer letter ✓ Due diligence
Multi-family units
County records classify this as Multi-Family (2-4 Unit). Listing-text estimate: 1 unit. estimate disagrees with records
Listing remarks
An amazing quadriplex with spacious bedrooms. 3 units offer 2 bedrooms and a wonderful living area. The 4th unit features 3 bedrooms. Situated on a wonderful corner lot. Enjoy a single level design. This quad has refrigerated air conversions with updated duct work within the last 2 years. The roof has also been replaced within the last 2 years. This multi-family has been well kept and maintained throughout the years. The living areas offer tile flooring. Each unit is well cared for and are all rented. Be sure to preview today!
Key facts
- Updated duct work
- Replaced roof
- Tile flooring
Tags
Property features AI
Exterior
- Parking: 1 parking space per unit
- Utilities: All utilities
- Home design: Quadruplex; Property has 4 total units
- Construction: Adobe and brick veneer construction; Composition and shingle roof
- Exterior features: Composition and shingle roof; Adobe and brick veneer exterior
Interior
- Kitchen: Range hood
- Flooring: Ceramic tile; Vinyl
- Heating & cooling: Central heating; Refrigerated cooling
- Interior features: Ceramic tile and vinyl flooring; Range hood
Neighborhood map
What this means for you Summary
Snapshot
- This is a multifamily listed at $250k.
Deal economics
- At list price, monthly cash flow is $2k ($29k/yr) — positive.
- The deal already cash-flows at list — no discount required.
- Meets the 1% rule at list price ($5k rent vs $250k).
Location & tenants
- Location reads 63/100 on livability (#830 in TX) — a middle-class / working-renter tenant base. Strengths: crime A+, cost of living A+, housing A+; Watch: amenities F, commute F, employment F.
- Socorro ISD (urban): math 23% / reading 36% proficiency, ranked #624 of 826 in TX (top 76%) — low school quality limits family demand, transient renter base, plan for 1-2y turnover; 66% free/reduced lunch — lower-income household profile, screen leases tightly.
- Zoned schools: Campestre El (math 17% / reading 27%, grade F, #3,333 of 4,322 statewide, top 80%, 495 students, 91% FRL); Socorro Middle (math 14% / reading 27%, grade F, #1,407 of 1,662 statewide, top 86%, 540 students, 92% FRL); Socorro H S (math 13% / reading 35%, grade F, #1,333 of 1,632 statewide, top 82%, 2,484 students, 87% FRL) — zoned schools average 90% FRL vs 66% district-wide (24 pts higher); higher-poverty schools than district average — tighter screening recommended.
- Market conditions: Rents rising fast (+5.3%/yr); 218 active listings in the ZIP; 2,196 units permitted in El Paso County in 2024 (143 in 5+ unit buildings).
- At $5,428/mo this rent would consume 121% of the median local household income ($54k/yr) (locally 732% of renters already pay >50% of income on rent) — very limited rent-growth headroom before tenants either downsize or default.
Forward outlook
- Local home prices are declining (-0.9%/yr); year-one equity from $2k of loan paydown is wiped out by about $2k of value loss. Plan a longer hold.
- El Paso County population projected at +10% by 2050 — modest demand growth; plan on rents tracking national, not racing it.
- At projected returns (-0.9% appreciation + 5.3% rent growth), your $70k cash investment doubles in ~3 years — after that, you're playing with house money.
Negotiation context
- Only 1 days on market — expect competitive offers; lowballing is unlikely to land.
Questions for the listing agent
- Built in 1979 — when were the roof, HVAC, electrical panel, plumbing, and water heater last replaced?
- Is there a deadline driving the sale (1031 exchange, divorce, estate, relocation)? That informs how much negotiation room exists.
- Schools are F-rated, which usually means shorter tenancies and higher turnover. Who's the typical renter profile here, and what's been the actual vacancy rate?
- What's the average days-on-market for RENTAL listings here right now (not sales)? A rising rental-DOM trend means longer vacancies and softer asking-rent achievability than the comps imply.
- What's the recent tenant-quality profile in this submarket — average credit score on applications, eviction rate, late-payment / NSF rate, and stable-employment percentage? A property-management company in the area should have these aggregated.
- How much new apartment / multifamily construction is in the pipeline within 1–3 miles? Heavy new supply (>2% of stock underway) typically softens rents 12–24 months out; light construction supports rent growth.
Investment metrics
- 1% rule
- 2.17% ✓
- Cap rate
- 17.72%
- Cash-on-cash
- 40.82%
- DSCR
- 2.82
- GRM
- 3.8
CMA / ARV
No comps found within radius.
Projected returns pro-forma
-0.93% appreciation · 5.29% rent growth · sell at horizon
- IRR
- 43.0%
- Equity multiple
- 3.09×
- Total profit
- $146,542
- Equity at exit
- $61,132
- IRR
- 48.0%
- Equity multiple
- 6.71×
- Total profit
- $399,781
- Equity at exit
- $64,874
Cash invested: $69,986 (down + closing). Projections, not guarantees.
Landlord ↔ Tenant lean methodology
- Overall (STATE)
- 87 Strongly Landlord-Friendly
- State Texas
- 87 Strongly Landlord-Friendly · R+5
- County
- — inherits STATE
- City
- — inherits STATE
ZIP-level market 79927
- Home prices YoY
- -0.4%
- Rents YoY
- 5.3%
- Active inventory
- 218
- Price-to-rent
- 16.5×
Monthly cashflow live
- Estimated rent
- $5,428 medium interval (Pro) →
- Mortgage (P&I)
- −$1,311
- Tax from tax record
- −$493 /mo · $5,910/yr
- Insurance
- −$104
- HOA
- −$0
- Vacancy / Maint / Mgmt
- −$1,140
- Net cashflow
- $2,381
Break-even live
Sensitivity live
| Price | -10% $2,522 | -5% $2,451 | +0% $2,381 | +5% $2,310 | +10% $2,239 |
|---|---|---|---|---|---|
| Rent | -10% $1,952 | -5% $2,166 | +0% $2,381 | +5% $2,595 | +10% $2,810 |
| Rate | -1.0pp $2,507 | -0.5pp $2,444 | base $2,381 | +0.5pp $2,316 | +1.0pp $2,250 |
4-unit breakdown (identical units grouped — click to expand)
| Units | Beds | Baths | Est. rent |
|---|---|---|---|
| 3× units | 2 | 1 | $3,777 |
| #1 | 2 | 1 | $1,259 |
| #2 | 2 | 1 | $1,259 |
| #3 | 2 | 1 | $1,259 |
| 1× unit | 3 | 1 | $1,649 |
| Total (4 units) | $5,428 | ||
UW: 25.0% down · 7.5% · 30yr · 1.5% tax · 5.0% vac · 8.0% maint · 8.0% mgmt
Financing live
Cash to close
- Down payment
- $62,488
- Closing costs
- $7,498
- Reserves months
- —
- Total cash needed
- —
Loan-product check · same deal, 3 products live
Conventional
25% down · 7.5% · 30yr
- Down + closing
- —
- Monthly P&I
- —
- Monthly cashflow
- —
- DSCR
- —
- Eligible?
- —
Personal DTI + credit; lowest rate.
DSCR
20% down · 8.5% · 30yr
- Down + closing
- —
- Monthly P&I
- —
- Monthly cashflow
- —
- DSCR
- —
- Eligible?
- —
No personal income docs; deal must DSCR.
Hard money
10% down · 12.0% · 12mo
- Down + closing
- —
- Monthly P&I
- —
- Monthly cashflow
- —
- DSCR
- —
- Eligible?
- —
Short-term bridge; refi at stabilization.
Listing history 4 events
-
2026-05-18status Pending
-
2026-05-10$249,950 Active
-
2005-09-13soldstatus
-
1991-08-26soldstatus
ⓘ Source: listings_history table (triggers on properties + properties_extension) + one-shot
backfill from property_details.listing_events for pre-trigger history.
Tax reassessment forecast TX · Resets to sale price
- Current annual tax
- $5,910 · $493/mo
- Projected year-2 tax
- $5,910 · $493/mo
- Expected delta
- $0/yr ($0/mo · 0.0%)
ⓘ Screening estimate from a state-policy table — verify with the county assessor before closing.
Nearby sold comps map
Loading sold comps map…
Walkable amenities ~0.75 mi
Loading nearby amenities…
Taxation est. · year 1
- Rental income
- $65,136
- − Mortgage interest
- −$14,001
- − Property taxes
- −$5,910
- − Insurance
- −$1,250
- − Repairs & maintenance
- −$5,211
- − Management
- −$5,211
- − Depreciation
- −$7,271
- Taxable income
- $26,282
- Est. tax owed @ 24.0%
- −$6,308
- After-tax cash flow
- $22,261/yr
For passive investors: Depreciation is non-cash, so a rental often shows a tax loss while cash-flowing — sheltering income. Rental losses are passive: they offset passive income freely, and up to $25,000/yr can offset ordinary (W-2) income if you actively participate and your MAGI is under $100k (phasing out to $0 by $150k); unused losses carry forward. On sale, claimed depreciation is recaptured at up to 25%, and gains may owe capital-gains tax (a 1031 exchange can defer both). Figures are a year-1 estimate at your 24.0% rate — not tax advice; consult a CPA.
Schools (NCES district)
- District
- Socorro ISD
- NCES district ID
- 4840710
- Math proficiency
- 23% ▼ -34.00%
- Reading proficiency
- 36% ▼ -14.00%
- Median HH income
- $49,318
- Composite
- 25.67/100
- National rank
- #7396
- State rank
- #624 of 826 in TX
Livability — Socorro
- Score
- 63/100
- State rank
- #830
- US rank
- #14960
Category grades
Schools grade is shown separately in the Schools card above.
Census & demographics
- Census place
- Socorro, TX
- County
- El Paso County · 761,266 people
- City population
- 44,444
- Metro
- El Paso, TX
- Population (ZIP)
- 44,444
- Household income
- $53,652
- Rent vs Own
- Severe rent burden
- 732.0
Population outlook (El Paso County) Hauer SSP2
- Today (2025)
- 897,899 people
- By 2030
- 922,694 · +2.8%
- By 2040
- 960,492 · +7.0%
- By 2050
- 982,919 · +9.5%
- By 2075
- 997,266 · +11.1%
- By 2100
- 900,630 · +0.3%
Race, ethnicity, and origin ACS 2023
- Neighborhood character
- Predominantly Hispanic (97%)
- Race & ethnicity
- Hispanic / Latino 97% Two or more races 39% Native American 2% White 2%
- Hispanic origin (detail)
- Mexican 94%
- Foreign-born
- 34% · Canada
- Languages at home
- 16% English-only · Spanish 84%
Political lean MEDSL · El Paso
- 2024 margin
- D (+15.1) · D 57.0% · R 41.8% · Other 1.2%
- 2008→2024 swing
- -17.4pp toward R · 2008: 32.5pp · 2024: 15.1pp
- All cycles
- 2024: D+15.1 2020: D+35.1 2016: D+43.2 2012: D+32.6 2008: D+32.5
Not yet ingested
- Civics
- —
Market trends
- HPI YoY
- ▼ -0.93%
- Current HPI
- 239.646
- Rent YoY
- ▲ 5.29%
- Metro
- El Paso, TX
- State GDP YoY
- ▲ 3.95%
- F500 in state
- 110
Industry mix (Fortune 500 HQ in TX)
| Industry | F500 HQs | Revenue |
|---|---|---|
| Energy | 16 | $1,198B |
|
||
| Technology | 5 | $198B |
|
||
| Engineering / Construction | 4 | $72B |
|
||
| Energy Services | 3 | $60B |
|
||
| Utilities | 3 | $41B |
|
||
| Healthcare | 2 | $330B |
|
||
Price history
4 events — show timeline
- 2026-05-18 Pending — GEPARMLS
- 2026-05-10 Listed $249,950 GEPARMLS
- 2005-09-13 Sold (Public Records) — Public Records
- 1991-08-26 Sold (Public Records) — Public Records
Property tax history
+5.4%/yrLatest (2025): $5,910 · +17.7% YoY. Source: county tax records.
Cash-flow waterfall
monthlySold comps — $/sqft
last 12 mo · ≤1 miLoading sold comps…