 🏗️ New Construction
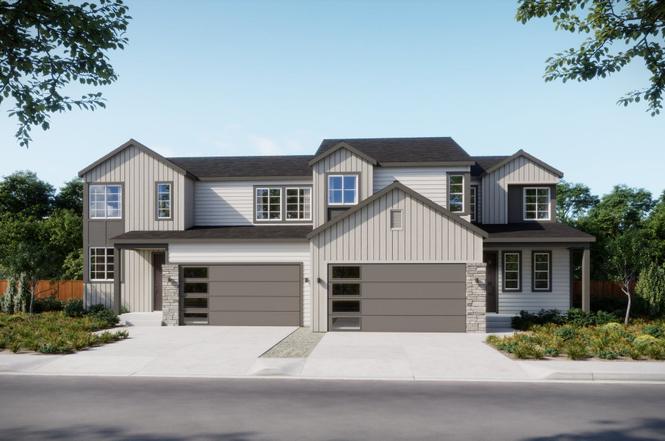
Plan 2 Plan · Parker, CO
Flood risk No data
- FEMA flood zone
- —
- Chance of flooding over 30 yrs
- —
- Est. flood insurance / yr
- —
Fire risk No data
- Est. fire insurance / yr
- —
Heat risk No data
- Hot days now (above threshold)
- —
- Hot days in 30 yrs
- —
Wind risk No data
- Chance of severe wind over 30 yrs
- —
Air-quality risk No data
- Unhealthy air days now
- —
- Unhealthy air days in 30 yrs
- —
Risk factors via First Street. Map © Google.
Why this score? — see what drove the D grade
The composite is a weighted blend of 9 inputs, each scored 0–100. Each bar is that input's sub-score; the figure is the points it added to the 100-point composite (weight × sub-score).
- Cash flow +14.1/30.0
- ARV discount +7.5/15.0
- Schools +5.1/10.0
- DSCR +4.3/10.0
- Livability +4.0/5.0
- 1% rule +3.9/10.0
- Rent growth +2.3/5.0
- Condition / age +2.2/5.0
- Appreciation +0.0/10.0
$619,900
🖨 Deal sheet (PDF) 📄 Offer letter ✓ Due diligence
Listing remarks
The Plan Two at Starling offers approximately 1,890 sq. ft. of living space thoughtfully designed to support modern lifestyles. This two-story duplex home includes 3 bedrooms, 2.5 bathrooms, a versatile loft, and a 2-car garage. The main level features an expansive open-concept great room with large windows that bring in natural light, seamlessly connecting to the dining area and kitchen-ideal for both everyday living and entertaining. Upstairs, the loft provides additional space for relaxing or flexible use, while the primary suite is designed for comfort with a walk-in shower, dual sinks, and a spacious walk-in closet. A convenient upstairs laundry room, with optional cabinetry and a sink
Key facts
- Dual sinks
- Upstairs loft
- Open great room
Tags
Property features AI
Finance
- Financial info: List price $619,900
Exterior
- Parking: 2 garage spaces (2 total parking spaces)
- Utilities: Natural gas heating; Central air conditioning
- Home design: Single-family plan (Plan 2); Active listing
Interior
- Bedrooms: 3 bedrooms
- Bathrooms: 4.5 bathrooms (2 full, 5 half listed as entries — total reported as 4.5)
- Heating & cooling: Natural gas forced air heating; Central air conditioning
- Interior features: Plan home (new construction plan); Living area 1890
Neighborhood map
What this means for you Summary
Snapshot
- This is a 2 × 3.0-bed/2.5-bath units multifamily listed at $620k. Condition is rated fair.
Deal economics
- At list price, monthly cash flow is $88 ($1k/yr) — positive. Per door: $44/mo.
- The deal already cash-flows at list — no discount required.
- To meet the 1% rule (rent ≥ 1% of price), the offer needs to be $553k (10.7% below list).
- Recommended offer: $553k (10.7% below list) — sets the bar for 1% rule.
- Cap rate 6.5% vs local median 3.0% in Parker — top-decile yield for the area; either an underpriced asset or a hidden risk that comps aren't pricing in. Stress-test before assuming the spread holds.
Location & tenants
- Location reads 81/100 on livability (#7 in CO, #1,304 nationally) — a professional / high-income tenant draw. Strengths: amenities A+, commute A+, employment A+; Watch: cost of living F.
- Douglas County School District No. RE-1 (suburban): math 45% / reading 62% proficiency, ranked #7 of 86 in CO (top 8%) — acceptable for families but not a draw, mixed tenant base, ~2y average lease; only 8% free/reduced lunch — higher-income household profile.
- Zoned schools: Legacy Point Elementary School (math 44% / reading 47%, grade D-, #268 of 966 statewide, top 28%, 416 students, 9% FRL); Sagewood Middle School (math 27% / reading 47%, grade F, #95 of 270 statewide, top 37%, 824 students, 8% FRL); Ponderosa High School (math 36% / reading 65%, grade D+, #93 of 381 statewide, top 24%, 1,402 students, 0% FRL) — zoned schools at 6% FRL track the district average.
- Market conditions: Rents soft (-0.9%/yr); 774 active listings in the ZIP; high-income renter base; 3,131 units permitted in Douglas County in 2024 (950 in 5+ unit buildings).
- At $5,534/mo this rent would consume 45% of the median local household income ($147k/yr) (locally 1267% of renters already pay >50% of income on rent) — very limited rent-growth headroom before tenants either downsize or default.
Forward outlook
- Local home prices are declining (-3.0%/yr); year-one equity from $4k of loan paydown is wiped out by about $19k of value loss. Plan a longer hold.
- Douglas County population projected at +43% by 2050 — long-run rental-demand tailwind backs the buy-and-hold thesis.
Negotiation context
- It's been on market 110 days — a 9% lower offer ($564k) is reasonable based on typical stale-listing flexibility.
Questions for the listing agent
- It's been on market 110 days. Have you received any prior offers? Is the seller open to a 11% concession, seller financing, or rate buy-down credit?
- Can we see the unit-by-unit rent roll, current vacancy, and any below-market leases? What's the average tenancy length?
- What capital expenditures (roof, boiler, parking lot, exteriors) have been made in the last 5 years, and what's planned in the next 2?
- Have any recent inspections been done? Can we get a copy of the seller's disclosures and any deferred-maintenance estimates?
- Why hasn't it sold? Are there any deal-killer items the seller is aware of (foundation, flood, title, zoning, code violations)?
- Is there a deadline driving the sale (1031 exchange, divorce, estate, relocation)? That informs how much negotiation room exists.
- Schools are B-rated — typically a magnet for longer-tenancy family renters. What's the average tenant stay here, and is there a school-zone premium baked into asking?
- The area grade is low — what's the realistic commute time and amenity access for the typical tenant pool here? Any planned neighborhood developments (good or bad) we should know about?
- What's the average days-on-market for RENTAL listings here right now (not sales)? A rising rental-DOM trend means longer vacancies and softer asking-rent achievability than the comps imply.
- What's the recent tenant-quality profile in this submarket — average credit score on applications, eviction rate, late-payment / NSF rate, and stable-employment percentage? A property-management company in the area should have these aggregated.
- How much new apartment / multifamily construction is in the pipeline within 1–3 miles? Heavy new supply (>2% of stock underway) typically softens rents 12–24 months out; light construction supports rent growth.
Investment metrics
- 1% rule
- 0.89% ✗
- Cap rate
- 6.46%
- Cash-on-cash
- 0.61%
- DSCR
- 1.03
- GRM
- 9.3
CMA / ARV
No comps found within radius.
Projected returns pro-forma
-3.0% appreciation · 0.0% rent growth · sell at horizon
- IRR
- -18.7%
- Equity multiple
- 0.36×
- Total profit
- $-110,988
- Equity at exit
- $92,429
- IRR
- -18.8%
- Equity multiple
- 0.13×
- Total profit
- $-151,777
- Equity at exit
- $53,598
Cash invested: $173,572 (down + closing). Projections, not guarantees.
Landlord ↔ Tenant lean methodology
- Overall (STATE)
- 38 Tenant-Leaning
- State Colorado
- 38 Tenant-Leaning · D+4
- County
- — inherits STATE
- City
- — inherits STATE
ZIP-level market 80134
- Rents YoY
- -0.9%
- Active inventory
- 774
- Price-to-rent
- 18.7×
Monthly cashflow live
- Estimated rent
- $5,534 medium interval (Pro) →
- Mortgage (P&I)
- −$3,251
- Tax est. 1.5%
- −$775 /mo · $9,298/yr
- Insurance
- −$258
- HOA
- −$0
- Vacancy / Maint / Mgmt
- −$1,162
- Net cashflow
- $88
Break-even live
Sensitivity live
| Price | -10% $516 | -5% $302 | +0% $88 | +5% $-126 | +10% $-341 |
|---|---|---|---|---|---|
| Rent | -10% $-349 | -5% $-131 | +0% $88 | +5% $306 | +10% $525 |
| Rate | -1.0pp $400 | -0.5pp $246 | base $88 | +0.5pp $-73 | +1.0pp $-236 |
2-unit breakdown (identical units grouped — click to expand)
| Units | Beds | Baths | Est. rent |
|---|---|---|---|
| 2× units | 3.0 | 2.5 | $5,534 |
| #1 | 3.0 | 2.5 | $2,767 |
| #2 | 3.0 | 2.5 | $2,767 |
| Total (2 units) | $5,534 | ||
UW: 25.0% down · 7.5% · 30yr · 1.5% tax · 5.0% vac · 8.0% maint · 8.0% mgmt
Financing live
Cash to close
- Down payment
- $154,975
- Closing costs
- $18,597
- Reserves months
- —
- Total cash needed
- —
Loan-product check · same deal, 3 products live
Conventional
25% down · 7.5% · 30yr
- Down + closing
- —
- Monthly P&I
- —
- Monthly cashflow
- —
- DSCR
- —
- Eligible?
- —
Personal DTI + credit; lowest rate.
DSCR
20% down · 8.5% · 30yr
- Down + closing
- —
- Monthly P&I
- —
- Monthly cashflow
- —
- DSCR
- —
- Eligible?
- —
No personal income docs; deal must DSCR.
Hard money
10% down · 12.0% · 12mo
- Down + closing
- —
- Monthly P&I
- —
- Monthly cashflow
- —
- DSCR
- —
- Eligible?
- —
Short-term bridge; refi at stabilization.
Listing history 14 events
-
2026-06-21days on market $619,900 Active 110 DOM
-
2026-06-18days on market $619,900 Active 107 DOM
-
2026-06-17days on market $619,900 Active 106 DOM
-
2026-06-16days on market $619,900 Active 105 DOM
-
2026-06-15days on market $619,900 Active 104 DOM
-
2026-06-13days on market $619,900 Active 102 DOM
-
2026-06-10days on market $619,900 Active 98 DOM
-
2026-06-08days on market $619,900 Active 97 DOM
-
2026-06-07days on market $619,900 Active 96 DOM
-
2026-06-04days on market $619,900 Active 93 DOM
-
2026-06-03days on market $619,900 Active 92 DOM
-
2026-06-02days on market $619,900 Active 91 DOM
-
2026-06-01days on market $619,900 Active 90 DOM
-
2026-05-31days on market $619,900 Active 89 DOM
ⓘ Source: listings_history table (triggers on properties + properties_extension) + one-shot
backfill from property_details.listing_events for pre-trigger history.
Nearby sold comps map
Loading sold comps map…
Walkable amenities ~0.75 mi
Loading nearby amenities…
Taxation est. · year 1
- Rental income
- $66,408
- − Mortgage interest
- −$34,724
- − Property taxes
- −$9,298
- − Insurance
- −$3,100
- − Repairs & maintenance
- −$5,313
- − Management
- −$5,313
- − Depreciation
- −$18,033
- Taxable loss
- −$9,373
- Est. tax savings @ 24.0%
- +$2,249
- After-tax cash flow
- $3,304/yr
For passive investors: Depreciation is non-cash, so a rental often shows a tax loss while cash-flowing — sheltering income. Rental losses are passive: they offset passive income freely, and up to $25,000/yr can offset ordinary (W-2) income if you actively participate and your MAGI is under $100k (phasing out to $0 by $150k); unused losses carry forward. On sale, claimed depreciation is recaptured at up to 25%, and gains may owe capital-gains tax (a 1031 exchange can defer both). Figures are a year-1 estimate at your 24.0% rate — not tax advice; consult a CPA.
Condition & rehab AI · 6 photos
The home requires extensive exterior repairs and maintenance, including painting, staining, roof cleaning, and landscaping. These updates will significantly improve its condition and curb appeal, increasing both resale and rental value.
Repairs flagged
- Major roof — The independent satellite image shows significant dirt and debris on the roof, indicating poor condition.
- Major exterior siding — The independent satellite image shows significant dirt and debris on the siding, indicating poor condition.
- Major exterior fencing — The independent satellite image shows significant dirt and debris on the fencing, indicating poor condition.
Value-add opportunities
- Both paint and staining — Painting and staining the exterior will improve the curb appeal and increase both resale and rental value.
- Both landscaping — A well-maintained and landscaped front yard will improve curb appeal and increase both resale and rental value.
- Both roof cleaning — Cleaning the roof will improve its condition and appearance, increasing both resale and rental value.
- Both exterior siding cleaning — Cleaning the exterior siding will improve its condition and appearance, increasing both resale and rental value.
- Both exterior fencing cleaning — Cleaning the exterior fencing will improve its condition and appearance, increasing both resale and rental value.
Renovation cost estimate screening
| Repair item | Severity | Est. cost |
|---|---|---|
| roof · The independent satellite image shows significant dirt and debris on the roof, indicating poor condition. | Major | $15,000–50,000 |
| exterior siding · The independent satellite image shows significant dirt and debris on the siding, indicating poor condition. | Major | $15,000–50,000 |
| exterior fencing · The independent satellite image shows significant dirt and debris on the fencing, indicating poor condition. | Major | $15,000–50,000 |
| Total estimated repair cost · 3 items | $45,000–150,000 |
Value-add ROI direction
- Both paint and staining — Painting and staining the exterior will improve the curb appeal and increase both resale and rental value. ↑
- Both landscaping — A well-maintained and landscaped front yard will improve curb appeal and increase both resale and rental value. ↑
- Both roof cleaning — Cleaning the roof will improve its condition and appearance, increasing both resale and rental value. ↑
- Both exterior siding cleaning — Cleaning the exterior siding will improve its condition and appearance, increasing both resale and rental value. ↑
- Both exterior fencing cleaning — Cleaning the exterior fencing will improve its condition and appearance, increasing both resale and rental value. ↑
ⓘ Cost ranges are severity-bucket heuristics (US national rule-of-thumb). Get contractor quotes + a written scope before underwriting a rehab budget.
Schools (NCES district)
- District
- Douglas County School District No. RE-1
- NCES district ID
- 0803450
- Math proficiency
- 45% ▼ -3.00%
- Reading proficiency
- 62% ▲ 3.00%
- Median HH income
- $103,175
- Composite
- 50.71/100
- National rank
- #1818
- State rank
- #7 of 86 in CO
Livability — Parker
- Score
- 81/100
- State rank
- #7
- US rank
- #1304
Category grades
Schools grade is shown separately in the Schools card above.
Census & demographics
- Census place
- Parker, CO
- County
- Douglas County · 358,815 people
- City population
- 117,197
- Metro
- Denver-Aurora-Lakewood, CO
- Population (ZIP)
- 80,302
- Household income
- $146,778
- Rent vs Own
- Severe rent burden
- 1267.0
Population outlook (Douglas County) Hauer SSP2
- Today (2025)
- 400,644 people
- By 2030
- 438,441 · +9.4%
- By 2040
- 509,940 · +27.3%
- By 2050
- 571,695 · +42.7%
- By 2075
- 699,992 · +74.7%
- By 2100
- 751,119 · +87.5%
Race, ethnicity, and origin ACS 2023
- Neighborhood character
- Predominantly White (74%)
- Race & ethnicity
- White 74% Hispanic / Latino 11% Two or more races 9% Asian 8% Black 2%
- Hispanic origin (detail)
- Mexican 7%
- Common ancestry
- Italian 3% Slovak 3% Portuguese 2%
- Foreign-born
- 10% · Canada, South Korea, China
- Languages at home
- 88% English-only · Spanish 4% Other Indo-European 3% Other Asian/Pacific 2%
Political lean MEDSL · Douglas
- 2024 margin
- Lean R (+7.0) · D 45.3% · R 52.3% · Other 2.4%
- 2008→2024 swing
- +10.2pp toward D · 2008: -17.2pp · 2024: -7.0pp
- All cycles
- 2024: R+7.0 2020: R+7.2 2016: R+18.1 2012: R+26.5 2008: R+17.2
Not yet ingested
- Civics
- —
Market trends
- HPI YoY
- ▼ -261.88%
- Current HPI
- 264.7756
- Rent YoY
- ▼ -0.89%
- Metro
- Denver-Aurora-Lakewood, CO
- State GDP YoY
- ▲ 1.95%
- F500 in state
- 14
Industry mix (Fortune 500 HQ in CO)
| Industry | F500 HQs | Revenue |
|---|---|---|
| Technology Distribution | 1 | $31B |
|
||
| Food / Agriculture | 1 | $18B |
|
||
| Packaging | 1 | $14B |
|
||
| Healthcare | 1 | $13B |
|
||
| Energy | 1 | $10B |
|
||
| Technology | 1 | $4B |
|
||
Cash-flow waterfall
monthlySold comps — $/sqft
last 12 mo · ≤1 miLoading sold comps…