 Duplex
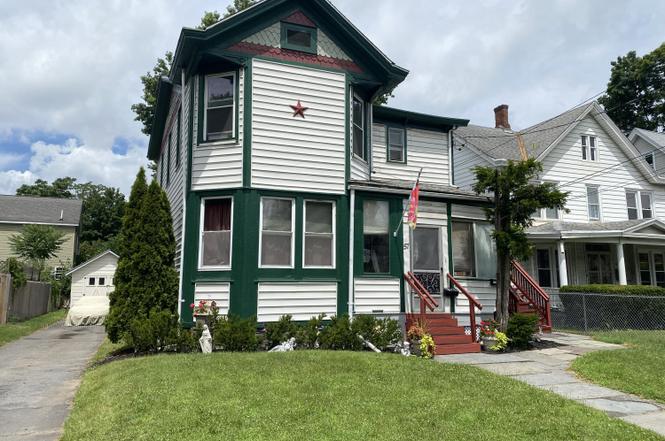
57 Downs St · Kingston, NY
Flood risk 1/10 · Minimal
- FEMA flood zone
- X (unshaded)
- Chance of flooding over 30 yrs
- 0.0%
- Est. flood insurance / yr
- $473 – $860
Fire risk 3/10 · Minor
- Est. fire insurance / yr
- $691 – $1,283
Heat risk 4/10 · Minor
- Hot days now (above 100°F)
- 7 days/yr
- Hot days in 30 yrs
- 16 days/yr
Wind risk 3/10 · Minor
- Chance of severe wind over 30 yrs
- 7.0%
Air-quality risk 2/10 · Minimal
- Unhealthy air days now
- 1 days/yr
- Unhealthy air days in 30 yrs
- 1 days/yr
Risk factors via First Street. Map © Google.
Why this score? — see what drove the D+ grade
The composite is a weighted blend of 9 inputs, each scored 0–100. Each bar is that input's sub-score; the figure is the points it added to the 100-point composite (weight × sub-score).
- Cash flow +19.9/30.0
- DSCR +6.3/10.0
- 1% rule +5.3/10.0
- Rent growth +4.5/5.0
- Schools +4.4/10.0
- Livability +4.1/5.0
- Condition / age +2.5/5.0
- ARV discount +0.0/15.0
- Appreciation +0.0/10.0
$370,000
🖨 Deal sheet 📄 Offer letter ✓ Due diligence
Multi-family units
County records classify this as Multi-Family (2-4 Unit). Listing-text estimate: 2 units. confirmed
Listing remarks
Traditional two family home located in the heart of Kingston! The first floor apartment of this lovely home features an enclosed front porch, living room, kitchen, full bath, bedroom and additional space downstairs used as a recreation room. This unit has a fantastic back deck that's perfect for entertaining. A very nice side porch leads up to the second apartment. This unit offers a kitchen, living room, full bath and bedroom. Also, an additional space that can be used as guest room, office space, etc. Both apartments of this property feature hardwood floors. In addition, there is a a paved driveway for off street parking. Also, a large single car garage with cement floor and electric. Thi
Key facts
- Fantastic back deck
- Single car garage
- Paved driveway
Tags
Property features AI
Exterior
- Utilities: Public water; Public sewer; 100 amp electric service
- Home design: Duplex (residential income); House/Frame construction
- Construction: Frame construction
- Exterior features: 0.13-acre lot; Zoned T4N
Interior
- Kitchen: Range; Refrigerator
- Flooring: Carpet; Hardwood; Vinyl
- Heating & cooling: Hot water heating; Natural gas heating; Steam heating; Window cooling units
- Interior features: Range; Refrigerator
Neighborhood map
What this means for you Summary
Snapshot
- This is a 2 × 2-bed/2.0-bath units multifamily listed at $370k.
Deal economics
- At list price, monthly cash flow is $446 ($5k/yr) — positive. Per door: $223/mo.
- The deal already cash-flows at list — no discount required.
- Meets the 1% rule at list price ($4k rent vs $370k).
- Recommended offer: $326k (12.0% below list) — sets the bar for market timing.
- Cap rate 7.7% vs local median 3.0% in Kingston — top-decile yield for the area; either an underpriced asset or a hidden risk that comps aren't pricing in. Stress-test before assuming the spread holds.
Location & tenants
- Location reads 82/100 on livability (#74 in NY, #1,143 nationally) — a professional / high-income tenant draw. Strengths: amenities A+, housing A+, health & safety A+; Watch: crime C-, schools D+.
- Kingston City School District (urban): math 44% / reading 59% proficiency, ranked #355 of 590 in NY (top 60%) — acceptable for families but not a draw, mixed tenant base, ~2y average lease.
- Market conditions: Rents rising fast (+7.8%/yr); 225 active listings in the ZIP; 464 units permitted in Ulster County in 2024 (170 in 5+ unit buildings).
- At $3,829/mo this rent would consume 66% of the median local household income ($69k/yr) (locally 2045% of renters already pay >50% of income on rent) — very limited rent-growth headroom before tenants either downsize or default.
Forward outlook
- Local home prices are declining (-3.0%/yr); year-one equity from $3k of loan paydown is wiped out by about $11k of value loss. Plan a longer hold.
- Ulster County population projected at -14% by 2050 — secular population decline; favor cash flow + early exit over multi-decade hold.
- At projected returns (-3.0% appreciation + 7.8% rent growth), your $104k cash investment doubles in ~9 years — after that, you're playing with house money.
Negotiation context
- It's been on market 319 days — a 12% lower offer ($326k) is reasonable based on typical stale-listing flexibility.
- Current owner paid $26k; list at $370k implies a 1323% gain — meaningful room to come down on a strong offer.
Risks & watch-outs
- Watch-outs: built in 1922 — expect roof / HVAC / electrical / plumbing capex.
Questions for the listing agent
- It's been on market 319 days. Have you received any prior offers? Is the seller open to a 12% concession, seller financing, or rate buy-down credit?
- Can we see the unit-by-unit rent roll, current vacancy, and any below-market leases? What's the average tenancy length?
- What capital expenditures (roof, boiler, parking lot, exteriors) have been made in the last 5 years, and what's planned in the next 2?
- Built in 1922 — when were the roof, HVAC, electrical panel, plumbing, and water heater last replaced?
- Why hasn't it sold? Are there any deal-killer items the seller is aware of (foundation, flood, title, zoning, code violations)?
- Is there a deadline driving the sale (1031 exchange, divorce, estate, relocation)? That informs how much negotiation room exists.
- Schools are D-rated, which usually means shorter tenancies and higher turnover. Who's the typical renter profile here, and what's been the actual vacancy rate?
- The area grade is low — what's the realistic commute time and amenity access for the typical tenant pool here? Any planned neighborhood developments (good or bad) we should know about?
- What's the average days-on-market for RENTAL listings here right now (not sales)? A rising rental-DOM trend means longer vacancies and softer asking-rent achievability than the comps imply.
- What's the recent tenant-quality profile in this submarket — average credit score on applications, eviction rate, late-payment / NSF rate, and stable-employment percentage? A property-management company in the area should have these aggregated.
- How much new apartment / multifamily construction is in the pipeline within 1–3 miles? Heavy new supply (>2% of stock underway) typically softens rents 12–24 months out; light construction supports rent growth.
Investment metrics
- 1% rule
- 1.03% ✓
- Cap rate
- 7.74%
- Cash-on-cash
- 5.17%
- DSCR
- 1.23
- GRM
- 8.1
CMA / ARV
- ARV (on-the-fly)
- $316,500
- Comps found
- 4
Show comp detail 4 sales within ~0.75 mi
| Address | Dist | Beds/Ba | Sqft | Sold | Price | $/sf | Match |
|---|---|---|---|---|---|---|---|
| 29 Henry St | 0.21mi | 3/2.0 (+1) | 1,636 (+9%) | 3mo | $237,500 | $145 | 68 |
| 17 Oneil St | 0.12mi | 3/2.0 (+1) | 1,431 (-5%) | 17mo | $295,000 | $206 | 68 |
| 230 Downs St | 0.47mi | 2/— | 1,386 (-8%) | 5mo | $325,000 | $234 | 61 |
| 65 Gage St | 0.59mi | 2/2.0 | 1,302 (-13%) | 23mo | $275,000 | $211 | 32 |
Match score weights: distance 35% · size 25% · config 20% · recency 20%. Top-matched comps best support the ARV.
Projected returns pro-forma
-3.0% appreciation · 7.81% rent growth · sell at horizon
- IRR
- -2.9%
- Equity multiple
- 0.88×
- Total profit
- $-12,025
- Equity at exit
- $55,168
- IRR
- 11.5%
- Equity multiple
- 2.11×
- Total profit
- $114,505
- Equity at exit
- $31,991
Cash invested: $103,600 (down + closing). Projections, not guarantees.
Landlord ↔ Tenant lean methodology
- Overall (STATE)
- 15 Strongly Tenant-Friendly
- State New York
- 15 Strongly Tenant-Friendly · D+10
- County
- — inherits STATE
- City
- — inherits STATE
ZIP-level market 12401
- Rents YoY
- 7.8%
- Active inventory
- 225
- Price-to-rent
- 16.1×
Monthly cashflow live
- Estimated rent
- $3,829 medium interval (Pro) →
- Mortgage (P&I)
- −$1,940
- Tax from tax record
- −$484 /mo · $5,809/yr
- Insurance
- −$154
- HOA
- −$0
- Vacancy / Maint / Mgmt
- −$804
- Net cashflow
- $446
Break-even live
2-unit breakdown (identical units grouped — click to expand)
| Units | Beds | Baths | Est. rent |
|---|---|---|---|
| 2× units | 2 | 2 | $3,830 |
| #1 | 2 | 2 | $1,915 |
| #2 | 2 | 2 | $1,915 |
| Total (2 units) | $3,829 | ||
UW: 25.0% down · 7.5% · 30yr · 1.5% tax · 5.0% vac · 8.0% maint · 8.0% mgmt
Financing live
Cash to close
- Down payment
- $92,500
- Closing costs
- $11,100
- Reserves months
- —
- Total cash needed
- —
Loan-product check · same deal, 3 products live
Conventional
25% down · 7.5% · 30yr
- Down + closing
- —
- Monthly P&I
- —
- Monthly cashflow
- —
- DSCR
- —
- Eligible?
- —
Personal DTI + credit; lowest rate.
DSCR
20% down · 8.5% · 30yr
- Down + closing
- —
- Monthly P&I
- —
- Monthly cashflow
- —
- DSCR
- —
- Eligible?
- —
No personal income docs; deal must DSCR.
Hard money
10% down · 12.0% · 12mo
- Down + closing
- —
- Monthly P&I
- —
- Monthly cashflow
- —
- DSCR
- —
- Eligible?
- —
Short-term bridge; refi at stabilization.
Listing history 19 events
-
2026-06-19days on market $370,000 Active 319 DOM
-
2026-06-18days on market $370,000 Active 318 DOM
-
2026-06-17days on market $370,000 Active 317 DOM
-
2026-06-16days on market $370,000 Active 316 DOM
-
2026-06-15days on market $370,000 Active 315 DOM
-
2026-06-14days on market $370,000 Active 313 DOM
-
2026-06-12days on market $370,000 Active 312 DOM
-
2026-06-09days on market $370,000 Active 309 DOM
-
2026-06-08days on market $370,000 Active 308 DOM
-
2026-06-07days on market $370,000 Active 307 DOM
-
2026-06-03days on market $370,000 Active 303 DOM
-
2026-06-02days on market $370,000 Active 302 DOM
-
2026-06-01days on market $370,000 Active 301 DOM
-
2026-05-31days on market $370,000 Active 300 DOM
-
2026-05-30days on market $370,000 Active 299 DOM
-
2026-05-04price $370,000
-
2025-11-21price $375,000
-
2025-08-04$380,000 Active
-
1982-08-27soldstatus $26,000
ⓘ Source: listings_history table (triggers on properties + properties_extension) + one-shot
backfill from property_details.listing_events for pre-trigger history.
Tax reassessment forecast NY · Partial reset (capped growth)
- Current annual tax
- $5,809 · $484/mo
- Projected year-2 tax
- $6,031 · $503/mo
- Expected delta
- +$222/yr (+$19/mo · 3.8%)
ⓘ Screening estimate from a state-policy table — verify with the county assessor before closing.
Climate risk First Street
- Flood 1/10 Low FEMA zone X (unshaded) · 0% chance over 30 yrs
- Wildfire 3/10 Moderate
- Heat 4/10 Moderate 7 d/yr ≥100°F today · 16 d/yr by 30 yrs out
- Wind 3/10 Moderate 7% chance of damaging wind over 30 yrs
- Air quality 2/10 Low 1 unhealthy d/yr today · 1 by 30 yrs out
Nearby sold comps map
Loading sold comps map…
Walkable amenities ~0.75 mi
Loading nearby amenities…
Taxation est. · year 1
- Rental income
- $45,948
- − Mortgage interest
- −$20,726
- − Property taxes
- −$5,809
- − Insurance
- −$1,850
- − Repairs & maintenance
- −$3,676
- − Management
- −$3,676
- − Depreciation
- −$10,764
- Taxable loss
- −$552
- Est. tax savings @ 24.0%
- +$132
- After-tax cash flow
- $5,489/yr
For passive investors: Depreciation is non-cash, so a rental often shows a tax loss while cash-flowing — sheltering income. Rental losses are passive: they offset passive income freely, and up to $25,000/yr can offset ordinary (W-2) income if you actively participate and your MAGI is under $100k (phasing out to $0 by $150k); unused losses carry forward. On sale, claimed depreciation is recaptured at up to 25%, and gains may owe capital-gains tax (a 1031 exchange can defer both). Figures are a year-1 estimate at your 24.0% rate — not tax advice; consult a CPA.
Schools (NCES district)
- District
- Kingston City School District
- NCES district ID
- 3616290
- Math proficiency
- 44% ▲ 1.00%
- Reading proficiency
- 59% ▲ 20.00%
- Median HH income
- $52,586
- Composite
- 44.22/100
- National rank
- #2849
- State rank
- #355 of 590 in NY
Livability — Kingston
- Score
- 82/100
- State rank
- #74
- US rank
- #1143
Category grades
Schools grade is shown separately in the Schools card above.
Census & demographics
- Census place
- Kingston, NY
- County
- Ulster County · 56,183 people
- City population
- 35,136
- Metro
- Kingston, NY
- Population (ZIP)
- 35,136
- Household income
- $69,305
- Rent vs Own
- Severe rent burden
- 2045.0
Population outlook (Ulster County) Hauer SSP2
- Today (2025)
- 175,887 people
- By 2030
- 171,876 · -2.3%
- By 2040
- 161,771 · -8.0%
- By 2050
- 151,470 · -13.9%
- By 2075
- 133,023 · -24.4%
- By 2100
- 113,504 · -35.5%
Race, ethnicity, and origin ACS 2023
- Neighborhood character
- Predominantly White (68%)
- Race & ethnicity
- White 68% Hispanic / Latino 14% Black 11% Two or more races 10% Asian 2% Native American 1%
- Hispanic origin (detail)
- Mexican 5% Puerto Rican 4%
- Common ancestry
- Romanian 5% Iranian 3% Lithuanian 2%
- Foreign-born
- 11% · Canada, China
- Languages at home
- 85% English-only · Spanish 9% Other Indo-European 2% French/Haitian/Cajun 1%
Political lean MEDSL · Ulster
- 2024 margin
- D (+18.7) · D 59.3% · R 40.7%
- 2008→2024 swing
- -4.9pp toward R · 2008: 23.6pp · 2024: 18.7pp
- All cycles
- 2024: D+18.7 2020: D+20.9 2016: D+9.1 2012: D+21.9 2008: D+23.6
Not yet ingested
- Civics
- —
Market trends
- HPI YoY
- ▼ -262.90%
- Current HPI
- 369.1984
- Rent YoY
- ▲ 7.81%
- Metro
- Kingston, NY
- State GDP YoY
- ▲ 2.60%
- F500 in state
- 92
Industry mix (Fortune 500 HQ in NY)
| Industry | F500 HQs | Revenue |
|---|---|---|
| Financial Services | 10 | $950B |
|
||
| Consumer Goods | 9 | $162B |
|
||
| Insurance | 4 | $225B |
|
||
| Telecommunications | 2 | $144B |
|
||
| Pharmaceuticals | 2 | $112B |
|
||
| Media / Entertainment | 2 | $69B |
|
||
Price history
+1323.1% since first listed4 events — show timeline
- 2026-05-04 Price Changed $370,000 HVCRMLS
- 2025-11-21 Price Changed $375,000 HVCRMLS
- 2025-08-04 Listed $380,000 HVCRMLS
- 1982-08-27 Sold (Public Records) $26,000 Public Records
Property tax history
+4.7%/yrLatest (2025): $5,809 · +11.0% YoY. Source: county tax records.
Cash-flow waterfall
monthlySold comps — $/sqft
last 12 mo · ≤1 miLoading sold comps…