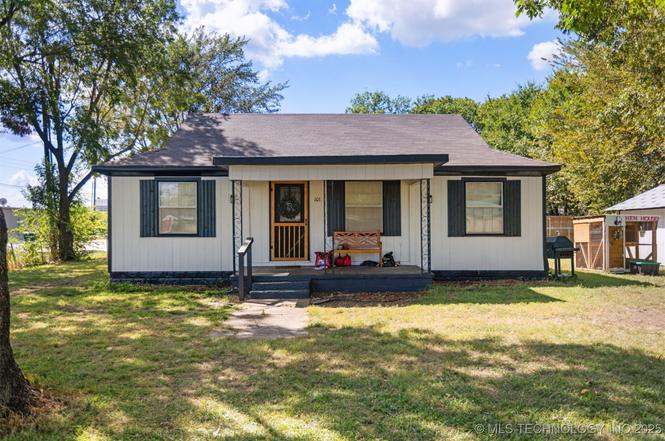
101 W Mckennon Rd · Calera, OK
Flood risk No data
- FEMA flood zone
- —
- Chance of flooding over 30 yrs
- —
- Est. flood insurance / yr
- —
Fire risk No data
- Est. fire insurance / yr
- —
Heat risk No data
- Hot days now (above threshold)
- —
- Hot days in 30 yrs
- —
Wind risk No data
- Chance of severe wind over 30 yrs
- —
Air-quality risk No data
- Unhealthy air days now
- —
- Unhealthy air days in 30 yrs
- —
Risk factors via First Street. Map © Google.
Why this score? — see what drove the D grade
The composite is a weighted blend of 9 inputs, each scored 0–100. Each bar is that input's sub-score; the figure is the points it added to the 100-point composite (weight × sub-score).
- Cash flow +10.0/30.0
- Appreciation +10.0/10.0
- ARV discount +7.5/15.0
- Livability +3.0/5.0
- DSCR +2.8/10.0
- 1% rule +2.5/10.0
- Rent growth +2.5/5.0
- Condition / age +2.5/5.0
- Schools +2.0/10.0
$119,000
🖨 Deal sheet (PDF) 📄 Offer letter ✓ Due diligence
Listing remarks MLS
Location Location This 3 bedroom 1 bath sitting on a lg corner lot with mature trees open floor plan Seller is give a 2500 credit to buyer for closing cost Plus a 500 sells bonus
Key facts
- Detached carport
- Front porch
- Storage shed
Tags
Property features AI
Exterior
- Parking: Detached garage (1 car)
- Security: Smoke detector(s); No safety shelter
- Utilities: Electricity available; Public water; Public sewer
- Home design: Single-story; Faces north; Crawlspace foundation
- Construction: Built with wood siding and wood frame; Asphalt/fiberglass roof
- Exterior features: Covered porch; Porch; Chain link fence; Corner lot; Mature trees
Interior
- Kitchen: Oven; Range; Stove; Refrigerator
- Flooring: Vinyl
- Bathrooms: 1 full bathroom
- Heating & cooling: Electric heating; Window unit cooling
- Interior features: Ceiling fan(s); Laminate counters; Electric range connection; Aluminum frame windows
- Laundry & utility: Electric water heater
Neighborhood map
What this means for you Summary
Snapshot
- This is a 3-bed/1.0-bath other listed at $119k.
Deal economics
- At list price, monthly cash flow is $-72 ($-868/yr) — negative.
- To cash-flow at today's rent, offer at most $106k (10.7% below list).
- To meet the 1% rule (rent ≥ 1% of price), the offer needs to be $90k (24.8% below list).
- Recommended offer: $90k (24.8% below list) — sets the bar for 1% rule.
- Cap rate 5.6% vs local median 2.3% in Calera — top-decile yield for the area; either an underpriced asset or a hidden risk that comps aren't pricing in. Stress-test before assuming the spread holds.
Location & tenants
- Location reads 59/100 on livability (#400 in OK) — a working-class tenant base; expect higher turnover. Strengths: cost of living A+, housing A+, crime A-; Watch: amenities F, commute F, employment D-.
- Calera (town): math 20% / reading 26% proficiency, ranked #139 of 270 in OK (top 52%) — low school quality limits family demand, transient renter base, plan for 1-2y turnover.
- Zoned schools: Calera Es (math 21% / reading 28%, grade F, #354 of 845 statewide, top 47%, 631 students, 0% FRL); Calera Hs (math 5% / reading 5%, grade F, #430 of 447 statewide, top 99%, 216 students, 0% FRL) — zoned schools average 0% FRL vs 58% district-wide (58 pts lower); this property's tenant base skews higher-income than the district average.
- Market conditions: 71 active listings in the ZIP; 1 comparable units currently listed for rent nearby; 176 units permitted in Bryan County in 2024 (80 in 5+ unit buildings).
Forward outlook
- In year one you build about $13k of equity ($823 loan paydown + $12k appreciation (10.0% local appreciation)).
- Bryan County population projected at +26% by 2050 — long-run rental-demand tailwind backs the buy-and-hold thesis.
- At projected returns (10.0% appreciation + 3.0% rent growth), your $33k cash investment doubles in ~3 years — after that, you're playing with house money.
- By year 3, paydown + projected appreciation supports a ~$32k cash-out refi (75% LTV) — recoverable capital for the next deal without selling this one.
Negotiation context
- It's been on market 182 days — a 12% lower offer ($105k) is reasonable based on typical stale-listing flexibility.
- 6 sale attempts since 7y ago; this cycle's ask has dropped $21k (15%) from the opening price — seller is motivated, your offer sets the floor, not the list.
Risks & watch-outs
- Watch-outs: built in 1956 — expect roof / HVAC / electrical / plumbing capex.
Questions for the listing agent
- What do current leases actually rent for vs. the listed asking? Can we see a recent rent roll and the last 12 months of T-12 income?
- It's been on market 182 days. Have you received any prior offers? Is the seller open to a 25% concession, seller financing, or rate buy-down credit?
- Built in 1956 — when were the roof, HVAC, electrical panel, plumbing, and water heater last replaced?
- Why hasn't it sold? Are there any deal-killer items the seller is aware of (foundation, flood, title, zoning, code violations)?
- Is there a deadline driving the sale (1031 exchange, divorce, estate, relocation)? That informs how much negotiation room exists.
- Schools are D-rated, which usually means shorter tenancies and higher turnover. Who's the typical renter profile here, and what's been the actual vacancy rate?
- The area grade is low — what's the realistic commute time and amenity access for the typical tenant pool here? Any planned neighborhood developments (good or bad) we should know about?
- What's the average days-on-market for RENTAL listings here right now (not sales)? A rising rental-DOM trend means longer vacancies and softer asking-rent achievability than the comps imply.
- What's the recent tenant-quality profile in this submarket — average credit score on applications, eviction rate, late-payment / NSF rate, and stable-employment percentage? A property-management company in the area should have these aggregated.
- How much new for-sale + rental construction is in the pipeline within 1–3 miles? Heavy new supply typically softens prices + rents 12–24 months out; constrained supply supports both.
Investment metrics
- 1% rule
- 0.75% ✗
- Cap rate
- 5.56%
- Cash-on-cash
- -2.61%
- DSCR
- 0.88
- GRM
- 11.1
CMA / ARV
No comps found within radius.
Projected returns pro-forma
10.0% appreciation · 3.0% rent growth · sell at horizon
- IRR
- 22.4%
- Equity multiple
- 2.81×
- Total profit
- $60,191
- Equity at exit
- $107,205
- IRR
- 20.1%
- Equity multiple
- 6.43×
- Total profit
- $180,849
- Equity at exit
- $231,191
Cash invested: $33,320 (down + closing). Projections, not guarantees.
Landlord ↔ Tenant lean methodology
- Overall (STATE)
- 83 Strongly Landlord-Friendly
- State Oklahoma
- 83 Strongly Landlord-Friendly · R+20
- County
- — inherits STATE
- City
- — inherits STATE
ZIP-level market 74730
- Home prices YoY
- 7.0%
- Active inventory
- 71
- Price-to-rent
- 11.1×
Monthly cashflow live
- Estimated rent
- $895 medium interval (Pro) →
- Mortgage (P&I)
- −$624
- Tax from tax record
- −$106 /mo · $1,269/yr
- Insurance
- −$50
- HOA
- −$0
- Lot rent
- −$0
- Vacancy / Maint / Mgmt
- −$188
- Net cashflow
- $-72
Break-even live
Sensitivity live
| Price | -10% $-5 | -5% $-39 | +0% $-72 | +5% $-106 | +10% $-140 |
|---|---|---|---|---|---|
| Rent | -10% $-143 | -5% $-108 | +0% $-72 | +5% $-37 | +10% $-2 |
| Rate | -1.0pp $-12 | -0.5pp $-42 | base $-72 | +0.5pp $-103 | +1.0pp $-135 |
UW: 25.0% down · 7.5% · 30yr · 1.5% tax · 5.0% vac · 8.0% maint · 8.0% mgmt
Financing live
Cash to close
- Down payment
- $29,750
- Closing costs
- $3,570
- Reserves months
- —
- Total cash needed
- —
Loan-product check · same deal, 3 products live
Conventional
25% down · 7.5% · 30yr
- Down + closing
- —
- Monthly P&I
- —
- Monthly cashflow
- —
- DSCR
- —
- Eligible?
- —
Personal DTI + credit; lowest rate.
DSCR
20% down · 8.5% · 30yr
- Down + closing
- —
- Monthly P&I
- —
- Monthly cashflow
- —
- DSCR
- —
- Eligible?
- —
No personal income docs; deal must DSCR.
Hard money
10% down · 12.0% · 12mo
- Down + closing
- —
- Monthly P&I
- —
- Monthly cashflow
- —
- DSCR
- —
- Eligible?
- —
Short-term bridge; refi at stabilization.
Rent comps 1 comps
| Address | Beds | Baths | Sqft | Rent | $/sqft | DOM | Units | Dist |
|---|---|---|---|---|---|---|---|---|
| 1312 N 3rd St Calera, OK | 1.0–2.0 | 1.0 | 563 | $895 | $1.59 | 23d | 7 | 1.19mi |
Listing history 38 events
-
2026-06-22days on market $119,000 Active 182 DOM
-
2026-06-21days on market $119,000 Active 181 DOM
-
2026-06-19days on market $119,000 Active 179 DOM
-
2026-06-18days on market $119,000 Active 178 DOM
-
2026-06-17days on market $119,000 Active 177 DOM
-
2026-06-16days on market $119,000 Active 176 DOM
-
2026-06-15days on market $119,000 Active 175 DOM
-
2026-06-14days on market $119,000 Active 173 DOM
-
2026-06-12days on market $119,000 Active 172 DOM
-
2026-06-09days on market $119,000 Active 169 DOM
-
2026-06-08days on market $119,000 Active 168 DOM
-
2026-06-07days on market $119,000 Active 167 DOM
-
2026-06-07days on market $119,000 Active 166 DOM
-
2026-06-03remarks 468-char remark
-
2026-06-03price $119,000 Active 162 DOM
-
2026-06-02days on market $129,900 Active 162 DOM
-
2026-06-01days on market $129,900 Active 161 DOM
-
2026-05-31days on market $129,900 Active 160 DOM
-
2026-05-30days on market $129,900 Active 159 DOM
-
2026-03-07price $129,900
-
2026-02-04price $134,900
-
2026-01-31status Active
-
2026-01-11status Pending
-
2025-12-03$139,900 Active
-
2025-12-01historical
-
2025-10-09$139,900 Active
-
2024-05-13soldstatus $124,900 Closed 181-char remark
Show marketing remark (181 chars)
Location Location This 3 bedroom 1 bath sitting on a lg corner lot with mature trees open floor plan Seller is give a 2500 credit to buyer for closing cost Plus a 500 sells bonus
-
2024-02-28status Pending 181-char remark
Show marketing remark (181 chars)
Location Location This 3 bedroom 1 bath sitting on a lg corner lot with mature trees open floor plan Seller is give a 2500 credit to buyer for closing cost Plus a 500 sells bonus
-
2024-02-26$124,000 Active 181-char remark
Show marketing remark (181 chars)
Location Location This 3 bedroom 1 bath sitting on a lg corner lot with mature trees open floor plan Seller is give a 2500 credit to buyer for closing cost Plus a 500 sells bonus
-
2023-02-13historical
-
2022-10-18price $99,000
-
2022-09-29price $119,000
-
2022-09-29price $150,000
-
2022-09-27$11,900 Active
-
2019-12-19soldstatus $77,345
-
2019-09-30$79,900
-
2019-09-13soldstatus $60,000
-
2013-07-16soldstatus $52,000
ⓘ Source: listings_history table (triggers on properties + properties_extension) + one-shot
backfill from property_details.listing_events for pre-trigger history.
Tax reassessment forecast OK · Resets to sale price
- Current annual tax
- $1,269 · $106/mo
- Projected year-2 tax
- $1,269 · $106/mo
- Expected delta
- $0/yr ($0/mo · 0.0%)
ⓘ Screening estimate from a state-policy table — verify with the county assessor before closing.
Nearby sold comps map
Loading sold comps map…
Walkable amenities ~0.75 mi
Loading nearby amenities…
Taxation est. · year 1
- Rental income
- $10,740
- − Mortgage interest
- −$6,666
- − Property taxes
- −$1,269
- − Insurance
- −$595
- − Repairs & maintenance
- −$859
- − Management
- −$859
- − Depreciation
- −$3,462
- Taxable loss
- −$2,970
- Est. tax savings @ 24.0%
- +$713
- After-tax cash flow
- $-155/yr
For passive investors: Depreciation is non-cash, so a rental often shows a tax loss while cash-flowing — sheltering income. Rental losses are passive: they offset passive income freely, and up to $25,000/yr can offset ordinary (W-2) income if you actively participate and your MAGI is under $100k (phasing out to $0 by $150k); unused losses carry forward. On sale, claimed depreciation is recaptured at up to 25%, and gains may owe capital-gains tax (a 1031 exchange can defer both). Figures are a year-1 estimate at your 24.0% rate — not tax advice; consult a CPA.
Schools (NCES district)
- District
- Calera
- NCES district ID
- 4006180
- Math proficiency
- 20% ▼ -14.00%
- Reading proficiency
- 26% ▼ -10.00%
- Median HH income
- $42,313
- Composite
- 19.65/100
- National rank
- #8740
- State rank
- #139 of 270 in OK
Livability — Calera
- Score
- 59/100
- State rank
- #400
- US rank
- #20380
Category grades
Schools grade is shown separately in the Schools card above.
Census & demographics
- Census place
- Calera, OK
- Population (ZIP)
- 5,790
Population outlook (Bryan County) Hauer SSP2
- Today (2025)
- 50,265 people
- By 2030
- 52,866 · +5.2%
- By 2040
- 58,018 · +15.4%
- By 2050
- 63,073 · +25.5%
- By 2075
- 74,439 · +48.1%
- By 2100
- 81,743 · +62.6%
Race, ethnicity, and origin ACS 2023
- Neighborhood character
- Diverse neighborhood (Simpson 0.58)
- Race & ethnicity
- White 64% Two or more races 15% Native American 14% Hispanic / Latino 8%
- Hispanic origin (detail)
- Mexican 5%
- Common ancestry
- Slovak 1% European 1% Italian 1%
- Foreign-born
- 1% · Canada
- Languages at home
- 96% English-only · Spanish 2%
Political lean MEDSL · Bryan
- 2024 margin
- Solid R (+58.5) · D 20.0% · R 78.6% · Other 1.4%
- 2008→2024 swing
- -23.0pp toward R · 2008: -35.5pp · 2024: -58.5pp
- All cycles
- 2024: R+58.5 2020: R+56.5 2016: R+55.6 2012: R+44.5 2008: R+35.5
Not yet ingested
- Civics
- —
Market trends
- HPI YoY
- ▲ 21.13%
- Current HPI
- 320.8708
- Rent YoY
- —
- Metro
- —
- State GDP YoY
- ▲ 1.55%
- F500 in state
- 6
Industry mix (Fortune 500 HQ in OK)
| Industry | F500 HQs | Revenue |
|---|---|---|
| Energy | 3 | $48B |
|
||
Price history
+149.8% since first listed19 events — show timeline
- 2026-03-07 Price Changed $129,900 MLS Technology, Inc.
- 2026-02-04 Price Changed $134,900 MLS Technology, Inc.
- 2026-01-31 Relisted — MLS Technology, Inc.
- 2026-01-11 Pending — MLS Technology, Inc.
- 2025-12-03 Listed $139,900 MLS Technology, Inc.
- 2025-12-01 Listing Removed — MLS Technology, Inc.
- 2025-10-09 Listed $139,900 MLS Technology, Inc.
- 2024-05-13 Sold (MLS) $124,900 MLS Technology, Inc.
- 2024-02-28 Pending — MLS Technology, Inc.
- 2024-02-26 Listed $124,000 MLS Technology, Inc.
- 2023-02-13 Listing Removed — MLS Technology, Inc.
- 2022-10-18 Price Changed $99,000 MLS Technology, Inc.
- 2022-09-29 Price Changed $119,000 MLS Technology, Inc.
- 2022-09-29 Price Changed $150,000 MLS Technology, Inc.
- 2022-09-27 Listed $11,900 MLS Technology, Inc.
- 2019-12-19 Sold (MLS) $77,345 MLS Technology, Inc.
- 2019-09-30 Listed $79,900 MLS Technology, Inc.
- 2019-09-13 Sold (Public Records) $60,000 Public Records
- 2013-07-16 Sold (Public Records) $52,000 Public Records
Property tax history
+14.2%/yrLatest (2025): $1,269 · +7.1% YoY. Source: county tax records.
Cash-flow waterfall
monthlySold comps — $/sqft
last 12 mo · ≤1 miLoading sold comps…