2902 Mincey Ter · North Port, FL
Flood risk 3/10 · Minor
- FEMA flood zone
- X (unshaded)
- Chance of flooding over 30 yrs
- 0.1%
- Est. flood insurance / yr
- $507 – $1,088
Fire risk 1/10 · Minimal
- Est. fire insurance / yr
- $947 – $1,759
Heat risk 10/10 · Severe
- Hot days now (above 108°F)
- 6 days/yr
- Hot days in 30 yrs
- 25 days/yr
Wind risk 10/10 · Severe
- Chance of severe wind over 30 yrs
- 99.0%
Air-quality risk 2/10 · Minimal
- Unhealthy air days now
- 1 days/yr
- Unhealthy air days in 30 yrs
- 1 days/yr
Risk factors via First Street. Map © Google.
Why this score? — see what drove the F grade
The composite is a weighted blend of 9 inputs, each scored 0–100. Each bar is that input's sub-score; the figure is the points it added to the 100-point composite (weight × sub-score).
- Cash flow +9.4/30.0
- Schools +5.4/10.0
- ARV discount +4.1/15.0
- Livability +3.8/5.0
- Rent growth +2.8/5.0
- DSCR +2.6/10.0
- Condition / age +2.5/5.0
- 1% rule +1.5/10.0
- Appreciation +0.0/10.0
$374,400
🖨 Deal sheet (PDF) 📄 Offer letter ✓ Due diligence
Listing remarks MLS
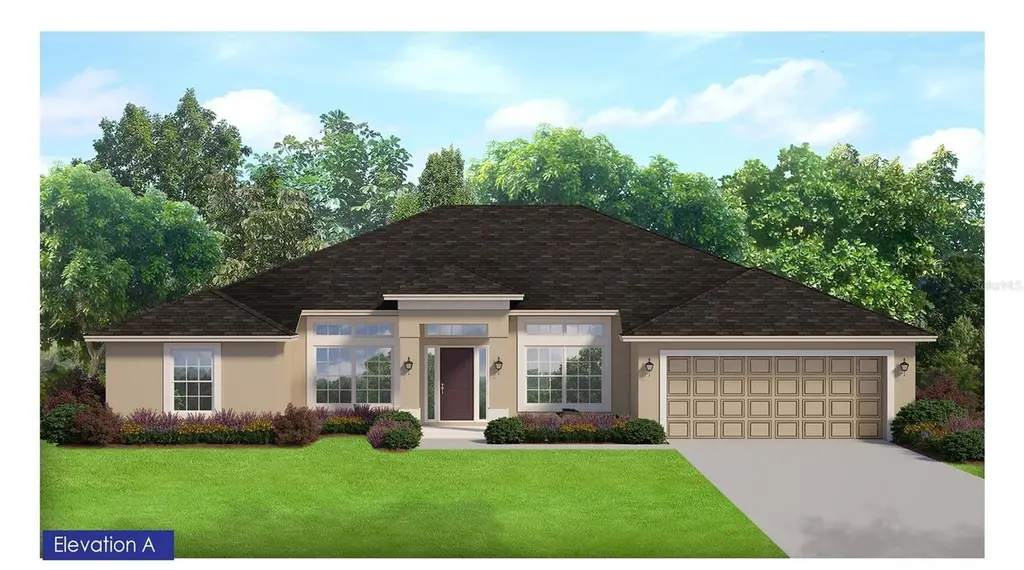
Under Construction. Welcome to this magnificent new construction home- our most popular floor plan! 3 bedrooms plus a den/study/4th bedroom, two baths with a formal living room, and dining room. Nestled in a vibrant North Port area, this home provides ample room for you, your family, and your guests to enjoy. Vaulted ceilings give this house spaciousness and an airy feel, creating a sense of grandeur in the living area, and allowing the natural light to make the space feel even larger and more inviting. Ceramic tile flooring throughout except in the bedrooms, designer LED recessed lighting, 36' upper cabinets with crown molding, quartz countertops in the kitchen and baths, stainless steel appliances, separate shower with bench seat AND garden tub in the primary bathroom, double pane insulated tilt-in sash windows for energy efficiency and SO much more! This property also comes with a 1-year workmanship, 2-year mechanical and 10-year structural warranty for peace of mind. Only $1000 down to secure this home today and the builder pays most closing costs with the use of a preferred lender!
Key facts
- Quartz countertops
- 36 upper cabinets
- Vaulted ceilings
Tags
Neighborhood map
What this means for you Summary
Snapshot
- This is a 4-bed/2.0-bath land listed at $374k.
Deal economics
- At list price, monthly cash flow is $-268 ($-3k/yr) — negative.
- To cash-flow at today's rent, offer at most $327k (12.7% below list).
- To meet the 1% rule (rent ≥ 1% of price), the offer needs to be $242k (35.3% below list).
- Recommended offer: $242k (35.3% below list) — sets the bar for 1% rule.
- Cap rate 5.4% vs local median 3.8% in North Port — top-decile yield for the area; either an underpriced asset or a hidden risk that comps aren't pricing in. Stress-test before assuming the spread holds.
Location & tenants
- Location reads 75/100 on livability (#252 in FL, #3,975 nationally) — a middle-class / working-renter tenant base. Strengths: crime A+, housing A+, health & safety A+; Watch: amenities F, commute F.
- Sarasota (urban): math 63% / reading 63% proficiency, ranked #7 of 73 in FL (top 10%) — acceptable for families but not a draw, mixed tenant base, ~2y average lease.
- Zoned schools: Toledo Blade Elementary School (math 71% / reading 67%, grade A-, #399 of 2,144 statewide, top 19%, 799 students, 57% FRL); Woodland Middle School (math 57% / reading 57%, grade B, #164 of 571 statewide, top 30%, 978 students, 55% FRL); North Port High School (math 44% / reading 57%, grade D+, #171 of 667 statewide, top 26%, 2,562 students, 54% FRL).
- Market conditions: Rents rising (+1.1%/yr); 852 active listings in the ZIP; 1 comparable units currently listed for rent nearby; solid renter incomes; 7,466 units permitted in Sarasota County in 2024 (2,138 in 5+ unit buildings).
- This rent runs 36% of the median local income ($81k/yr) — at the standard rent-burdened threshold; future hikes will face affordability resistance.
Forward outlook
- Local home prices are declining (-3.0%/yr); year-one equity from $3k of loan paydown is wiped out by about $11k of value loss. Plan a longer hold.
- Sarasota County population projected at +20% by 2050 — long-run rental-demand tailwind backs the buy-and-hold thesis.
Negotiation context
- It's been on market 81 days — a 6% lower offer ($352k) is reasonable based on typical stale-listing flexibility.
- 3 sale attempts since 20y ago with the ask held roughly flat each time — persistent listings suggest the price (not the market) is what's stuck; bring a comps-based counter.
- Current owner paid $90k; list at $374k implies a 316% gain — meaningful room to come down on a strong offer.
Risks & watch-outs
- Climate carrying-cost: severe wind risk, 99% chance of damaging wind over 30y; extreme-heat days projected 6→25/yr by 2055 (HVAC capex compounding) — expect insurance premiums to compound above CPI over the hold.
Questions for the listing agent
- What do current leases actually rent for vs. the listed asking? Can we see a recent rent roll and the last 12 months of T-12 income?
- It's been on market 81 days. Have you received any prior offers? Is the seller open to a 35% concession, seller financing, or rate buy-down credit?
- Why hasn't it sold? Are there any deal-killer items the seller is aware of (foundation, flood, title, zoning, code violations)?
- Is there a deadline driving the sale (1031 exchange, divorce, estate, relocation)? That informs how much negotiation room exists.
- Schools are B-rated — typically a magnet for longer-tenancy family renters. What's the average tenant stay here, and is there a school-zone premium baked into asking?
- The area grade is low — what's the realistic commute time and amenity access for the typical tenant pool here? Any planned neighborhood developments (good or bad) we should know about?
- What's the average days-on-market for RENTAL listings here right now (not sales)? A rising rental-DOM trend means longer vacancies and softer asking-rent achievability than the comps imply.
- What's the recent tenant-quality profile in this submarket — average credit score on applications, eviction rate, late-payment / NSF rate, and stable-employment percentage? A property-management company in the area should have these aggregated.
- How much new for-sale + rental construction is in the pipeline within 1–3 miles? Heavy new supply typically softens prices + rents 12–24 months out; constrained supply supports both.
Investment metrics
- 1% rule
- 0.65% ✗
- Cap rate
- 5.43%
- Cash-on-cash
- -3.07%
- DSCR
- 0.86
- GRM
- 12.9
CMA / ARV
- ARV (median comp)
- $348,450
- List price
- $374,400
- Delta
- 7.45%
- Verdict
- FAIR
- Comps
- 20 within 2.0 mi
Projected returns pro-forma
-3.0% appreciation · 1.12% rent growth · sell at horizon
- IRR
- -23.3%
- Equity multiple
- 0.21×
- Total profit
- $-82,470
- Equity at exit
- $55,824
- IRR
- -22.8%
- Equity multiple
- -0.07×
- Total profit
- $-112,459
- Equity at exit
- $32,371
Cash invested: $104,832 (down + closing). Projections, not guarantees.
Landlord ↔ Tenant lean methodology
- Overall (STATE)
- 87 Strongly Landlord-Friendly
- State Florida
- 87 Strongly Landlord-Friendly · R+3
- County
- — inherits STATE
- City
- — inherits STATE
ZIP-level market 34286
- Home prices YoY
- -9.5%
- Rents YoY
- 1.1%
- Active inventory
- 852
- Price-to-rent
- 12.9×
Monthly cashflow live
- Estimated rent
- $2,423 medium interval (Pro) →
- Mortgage (P&I)
- −$1,963
- Tax from tax record
- −$63 /mo · $755/yr
- Insurance
- −$156
- HOA
- −$0
- Vacancy / Maint / Mgmt
- −$509
- Net cashflow
- $-268
Break-even live
Sensitivity live
| Price | -10% $-56 | -5% $-162 | +0% $-268 | +5% $-803 | +10% $-932 |
|---|---|---|---|---|---|
| Rent | -10% $-460 | -5% $-364 | +0% $-268 | +5% $-173 | +10% $-77 |
| Rate | -1.0pp $-80 | -0.5pp $-173 | base $-268 | +0.5pp $-365 | +1.0pp $-464 |
UW: 25.0% down · 7.5% · 30yr · 1.5% tax · 5.0% vac · 8.0% maint · 8.0% mgmt
Financing live
Cash to close
- Down payment
- $93,600
- Closing costs
- $11,232
- Reserves months
- —
- Total cash needed
- —
Loan-product check · same deal, 3 products live
Conventional
25% down · 7.5% · 30yr
- Down + closing
- —
- Monthly P&I
- —
- Monthly cashflow
- —
- DSCR
- —
- Eligible?
- —
Personal DTI + credit; lowest rate.
DSCR
20% down · 8.5% · 30yr
- Down + closing
- —
- Monthly P&I
- —
- Monthly cashflow
- —
- DSCR
- —
- Eligible?
- —
No personal income docs; deal must DSCR.
Hard money
10% down · 12.0% · 12mo
- Down + closing
- —
- Monthly P&I
- —
- Monthly cashflow
- —
- DSCR
- —
- Eligible?
- —
Short-term bridge; refi at stabilization.
Rent comps 1 comps
| Address | Beds | Baths | Sqft | Rent | $/sqft | DOM | Units | Dist |
|---|---|---|---|---|---|---|---|---|
| 17031 Hillsborough Blvd Port Charlotte, FL | 3.0 | 2.0 | 1751 | $1,850 | $1.06 | 23d | 1 | 1.41mi |
Listing history 25 events
-
2026-06-21statusdays on market $374,400 Pending 81 DOM
-
2026-06-18days on market $374,400 Active 80 DOM
-
2026-06-17days on market $374,400 Active 79 DOM
-
2026-06-16days on market $374,400 Active 78 DOM
-
2026-06-15days on market $374,400 Active 77 DOM
-
2026-06-13days on market $374,400 Active 75 DOM
-
2026-06-13days on market $374,400 Active 74 DOM
-
2026-06-10days on market $374,400 Active 72 DOM
-
2026-06-09days on market $374,400 Active 71 DOM
-
2026-06-08days on market $374,400 Active 70 DOM
-
2026-06-08days on market $374,400 Active 69 DOM
-
2026-06-05days on market $374,400 Active 66 DOM
-
2026-06-03days on market $374,400 Active 65 DOM
-
2026-06-02days on market $374,400 Active 64 DOM
-
2026-06-01days on market $374,400 Active 63 DOM
-
2026-05-31days on market $374,400 Active 62 DOM
-
2026-03-30price $374,400 1103-char remark
Show marketing remark (1103 chars)
Under Construction. Welcome to this magnificent new construction home- our most popular floor plan! 3 bedrooms plus a den/study/4th bedroom, two baths with a formal living room, and dining room. Nestled in a vibrant North Port area, this home provides ample room for you, your family, and your guests to enjoy. Vaulted ceilings give this house spaciousness and an airy feel, creating a sense of grandeur in the living area, and allowing the natural light to make the space feel even larger and more inviting. Ceramic tile flooring throughout except in the bedrooms, designer LED recessed lighting, 36' upper cabinets with crown molding, quartz countertops in the kitchen and baths, stainless steel appliances, separate shower with bench seat AND garden tub in the primary bathroom, double pane insulated tilt-in sash windows for energy efficiency and SO much more! This property also comes with a 1-year workmanship, 2-year mechanical and 10-year structural warranty for peace of mind. Only $1000 down to secure this home today and the builder pays most closing costs with the use of a preferred lender!
-
2026-03-30$375,900 Active 1103-char remark
Show marketing remark (1103 chars)
Under Construction. Welcome to this magnificent new construction home- our most popular floor plan! 3 bedrooms plus a den/study/4th bedroom, two baths with a formal living room, and dining room. Nestled in a vibrant North Port area, this home provides ample room for you, your family, and your guests to enjoy. Vaulted ceilings give this house spaciousness and an airy feel, creating a sense of grandeur in the living area, and allowing the natural light to make the space feel even larger and more inviting. Ceramic tile flooring throughout except in the bedrooms, designer LED recessed lighting, 36' upper cabinets with crown molding, quartz countertops in the kitchen and baths, stainless steel appliances, separate shower with bench seat AND garden tub in the primary bathroom, double pane insulated tilt-in sash windows for energy efficiency and SO much more! This property also comes with a 1-year workmanship, 2-year mechanical and 10-year structural warranty for peace of mind. Only $1000 down to secure this home today and the builder pays most closing costs with the use of a preferred lender!
-
2021-04-09soldstatus $90,000
-
2021-04-08soldstatus $100,000 Closed 22-char remark
Show marketing remark (22 chars)
10 lots in North Port.
-
2021-03-30status Pending 22-char remark
Show marketing remark (22 chars)
10 lots in North Port.
-
2021-03-14status Pending 22-char remark
Show marketing remark (22 chars)
10 lots in North Port.
-
2021-03-14$125,000 Active 22-char remark
Show marketing remark (22 chars)
10 lots in North Port.
-
2006-06-12$100,000
-
2006-05-11soldstatus $33,000
ⓘ Source: listings_history table (triggers on properties + properties_extension) + one-shot
backfill from property_details.listing_events for pre-trigger history.
Tax reassessment forecast FL · Resets to sale price
- Current annual tax
- $755 · $63/mo
- Projected year-2 tax
- $3,108 · $259/mo
- Expected delta
- +$2,352/yr (+$196/mo · 311.4%)
ⓘ Screening estimate from a state-policy table — verify with the county assessor before closing.
Climate risk First Street
- Flood 3/10 Moderate FEMA zone X (unshaded) · 10% chance over 30 yrs
- Wildfire 1/10 Low
- Heat 10/10 Extreme 6 d/yr ≥108°F today · 25 d/yr by 30 yrs out
- Wind 10/10 Extreme 99% chance of damaging wind over 30 yrs
- Air quality 2/10 Low 1 unhealthy d/yr today · 1 by 30 yrs out
Nearby sold comps map
Loading sold comps map…
Walkable amenities ~0.75 mi
Loading nearby amenities…
Taxation est. · year 1
- Rental income
- $29,074
- − Mortgage interest
- −$20,972
- − Property taxes
- −$755
- − Insurance
- −$1,872
- − Repairs & maintenance
- −$2,326
- − Management
- −$2,326
- − Depreciation
- −$10,892
- Taxable loss
- −$10,069
- Est. tax savings @ 24.0%
- +$2,417
- After-tax cash flow
- $-803/yr
For passive investors: Depreciation is non-cash, so a rental often shows a tax loss while cash-flowing — sheltering income. Rental losses are passive: they offset passive income freely, and up to $25,000/yr can offset ordinary (W-2) income if you actively participate and your MAGI is under $100k (phasing out to $0 by $150k); unused losses carry forward. On sale, claimed depreciation is recaptured at up to 25%, and gains may owe capital-gains tax (a 1031 exchange can defer both). Figures are a year-1 estimate at your 24.0% rate — not tax advice; consult a CPA.
Schools (NCES district)
- District
- Sarasota
- NCES district ID
- 1201680
- Math proficiency
- 63% ▼ -8.00%
- Reading proficiency
- 63% ▼ -3.00%
- Median HH income
- $51,167
- Composite
- 53.68/100
- National rank
- #1428
- State rank
- #7 of 73 in FL
Livability — North Port
- Score
- 75/100
- State rank
- #252
- US rank
- #3975
Category grades
Schools grade is shown separately in the Schools card above.
Census & demographics
- Census place
- North Port, FL
- County
- Sarasota County · 448,376 people
- City population
- 75,324
- Metro
- North Port-Sarasota-Bradenton, FL
- Population (ZIP)
- 22,534
- Household income
- $80,553
- Rent vs Own
- Severe rent burden
- 545.0
Population outlook (Sarasota County) Hauer SSP2
- Today (2025)
- 452,380 people
- By 2030
- 474,175 · +4.8%
- By 2040
- 511,577 · +13.1%
- By 2050
- 541,467 · +19.7%
- By 2075
- 604,947 · +33.7%
- By 2100
- 621,965 · +37.5%
Race, ethnicity, and origin ACS 2023
- Neighborhood character
- Predominantly White (81%)
- Race & ethnicity
- White 81% Hispanic / Latino 10% Two or more races 8% Black 3% Asian 1%
- Hispanic origin (detail)
- Mexican 2% Puerto Rican 4% Cuban 2%
- Common ancestry
- Romanian 7% Lithuanian 4% Subsaharan African 2%
- Foreign-born
- 9% · Canada
- Languages at home
- 86% English-only · Spanish 7% Russian/Polish/Slavic 4% Other Indo-European 1%
Political lean MEDSL · Sarasota
- 2024 margin
- R (+18.2) · D 40.5% · R 58.7%
- 2008→2024 swing
- -18.1pp toward R · 2008: -0.1pp · 2024: -18.2pp
- All cycles
- 2024: R+18.2 2020: R+10.4 2016: R+11.6 2012: R+7.4 2008: R+0.1
Not yet ingested
- Civics
- —
Market trends
- HPI YoY
- ▼ -31.36%
- Current HPI
- 297.3707
- Rent YoY
- ▲ 1.12%
- Metro
- North Port-Sarasota-Bradenton, FL
- State GDP YoY
- ▲ 3.28%
- F500 in state
- 36
Industry mix (Fortune 500 HQ in FL)
| Industry | F500 HQs | Revenue |
|---|---|---|
| Industrial Technology | 2 | $29B |
|
||
| Insurance | 2 | $17B |
|
||
| Retail | 1 | $60B |
|
||
| Technology Distribution | 1 | $58B |
|
||
| Homebuilding | 1 | $35B |
|
||
| Technology Manufacturing | 1 | $35B |
|
||
Price history
+1034.5% since first listed9 events — show timeline
- 2026-03-30 Price Changed $374,400 Stellar MLS as Distributed by MLS Grid
- 2026-03-30 Listed $375,900 Stellar MLS as Distributed by MLS Grid
- 2021-04-09 Sold (Public Records) $90,000 Public Records
- 2021-04-08 Sold (MLS) $100,000 Stellar MLS as Distributed by MLS Grid
- 2021-03-30 Pending — Stellar MLS as Distributed by MLS Grid
- 2021-03-14 Pending — Stellar MLS as Distributed by MLS Grid
- 2021-03-14 Listed $125,000 Stellar MLS as Distributed by MLS Grid
- 2006-06-12 Listed $100,000 Stellar MLS as Distributed by MLS Grid
- 2006-05-11 Sold (Public Records) $33,000 Public Records
Property tax history
+9.0%/yrLatest (2025): $755 · +8.2% YoY. Source: county tax records.
Cash-flow waterfall
monthlySold comps — $/sqft
last 12 mo · ≤1 miLoading sold comps…