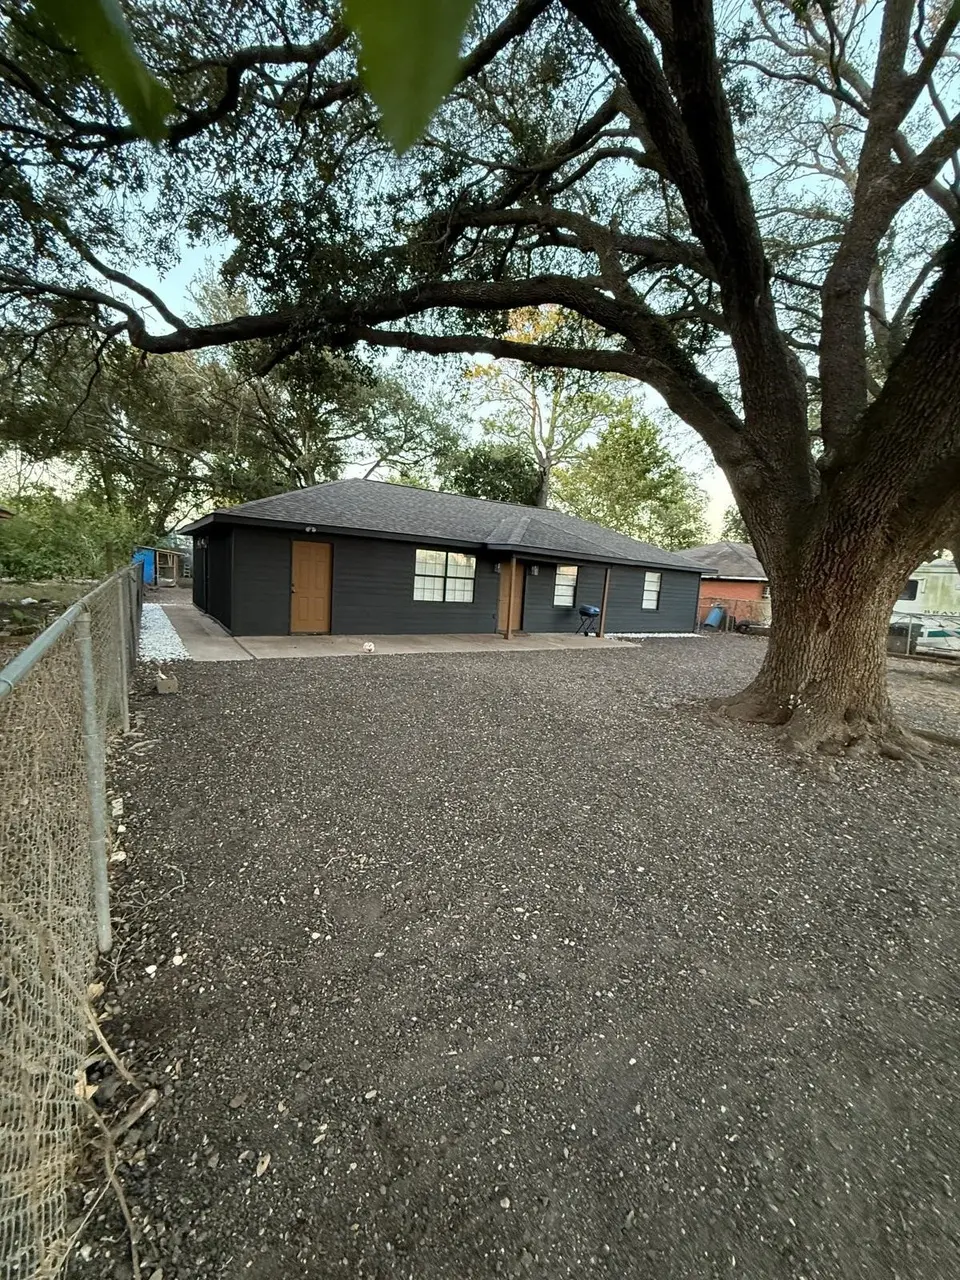
4323 Jamie Ln E · Houston, TX
Flood risk 3/10 · Minor
- FEMA flood zone
- X (unshaded)
- Chance of flooding over 30 yrs
- 0.07%
- Est. flood insurance / yr
- $507 – $1,088
Fire risk 3/10 · Minor
- Est. fire insurance / yr
- $1,222 – $2,270
Heat risk 9/10 · Severe
- Hot days now (above 108°F)
- 7 days/yr
- Hot days in 30 yrs
- 22 days/yr
Wind risk 9/10 · Severe
- Chance of severe wind over 30 yrs
- 99.0%
Air-quality risk 2/10 · Minimal
- Unhealthy air days now
- 1 days/yr
- Unhealthy air days in 30 yrs
- 2 days/yr
Risk factors via First Street. Map © Google.
Why this score? — see what drove the C+ grade
The composite is a weighted blend of 9 inputs, each scored 0–100. Each bar is that input's sub-score; the figure is the points it added to the 100-point composite (weight × sub-score).
- Cash flow +21.7/30.0
- ARV discount +13.2/15.0
- DSCR +6.9/10.0
- Appreciation +6.3/10.0
- 1% rule +5.2/10.0
- Livability +3.7/5.0
- Rent growth +2.8/5.0
- Schools +2.7/10.0
- Condition / age +2.5/5.0
$205,000
🖨 Deal sheet (PDF) 📄 Offer letter ✓ Due diligence
Listing remarks MLS
Beautiful and very spacious property south of highway 288, completely remodeled and ready for its new owner
Key facts
- Completely remodeled
- Spacious property
- 0.25 acre lot
Tags
Neighborhood map
What this means for you Summary
Snapshot
- This is a 4-bed/2.0-bath single-family listed at $205k.
Deal economics
- At list price, monthly cash flow is $313 ($4k/yr) — positive.
- The deal already cash-flows at list — no discount required.
- Meets the 1% rule at list price ($2k rent vs $205k).
- Recommended offer: $180k (12.0% below list) — sets the bar for market timing.
- Cap rate 8.1% vs local median 3.1% in Houston — top-decile yield for the area; either an underpriced asset or a hidden risk that comps aren't pricing in. Stress-test before assuming the spread holds.
Location & tenants
- Location reads 74/100 on livability (#184 in TX, #4,771 nationally) — a middle-class / working-renter tenant base. Strengths: amenities A+, cost of living A+, housing A+; Watch: schools D, crime F.
- Houston ISD (urban): math 27% / reading 35% proficiency, ranked #593 of 826 in TX (top 72%) — families likely to look elsewhere, expect single-tenant / working-renter base with shorter leases; 71% free/reduced lunch — lower-income household profile, screen leases tightly.
- Market conditions: Rents rising (+1.2%/yr); 303 active listings in the ZIP; 11 comparable units currently listed for rent nearby; rentals at typical pace (median 23d on market — plan ~3-4 weeks tenant-placement turnaround); 29,883 units permitted in Harris County in 2024 (8,621 in 5+ unit buildings).
- This rent runs 44% of the median local income ($57k/yr) — at the standard rent-burdened threshold; future hikes will face affordability resistance.
Forward outlook
- In year one you build about $7k of equity ($1k loan paydown + $5k appreciation (2.6% local appreciation)).
- Harris County population projected at +47% by 2050 — long-run rental-demand tailwind backs the buy-and-hold thesis.
- At projected returns (2.6% appreciation + 1.2% rent growth), your $57k cash investment doubles in ~6 years — after that, you're playing with house money.
- By year 6, paydown + projected appreciation supports a ~$36k cash-out refi (75% LTV) — recoverable capital for the next deal without selling this one.
Negotiation context
- It's been on market 225 days — a 12% lower offer ($180k) is reasonable based on typical stale-listing flexibility.
Risks & watch-outs
- Watch-outs: built in 1956 — expect roof / HVAC / electrical / plumbing capex.
- Climate carrying-cost: severe wind risk, 99% chance of damaging wind over 30y; extreme-heat days projected 7→22/yr by 2055 (HVAC capex compounding) — expect insurance premiums to compound above CPI over the hold.
Questions for the listing agent
- It's been on market 225 days. Have you received any prior offers? Is the seller open to a 12% concession, seller financing, or rate buy-down credit?
- Built in 1956 — when were the roof, HVAC, electrical panel, plumbing, and water heater last replaced?
- Why hasn't it sold? Are there any deal-killer items the seller is aware of (foundation, flood, title, zoning, code violations)?
- Is there a deadline driving the sale (1031 exchange, divorce, estate, relocation)? That informs how much negotiation room exists.
- Schools are D-rated, which usually means shorter tenancies and higher turnover. Who's the typical renter profile here, and what's been the actual vacancy rate?
- Crime grade is F in this area — have there been break-ins, vandalism, or insurance claims at this property in the last 3 years? What carrier currently insures it and at what premium?
- What's the average days-on-market for RENTAL listings here right now (not sales)? A rising rental-DOM trend means longer vacancies and softer asking-rent achievability than the comps imply.
- What's the recent tenant-quality profile in this submarket — average credit score on applications, eviction rate, late-payment / NSF rate, and stable-employment percentage? A property-management company in the area should have these aggregated.
- How much new for-sale + rental construction is in the pipeline within 1–3 miles? Heavy new supply typically softens prices + rents 12–24 months out; constrained supply supports both.
Investment metrics
- 1% rule
- 1.02% ✓
- Cap rate
- 8.13%
- Cash-on-cash
- 6.55%
- DSCR
- 1.29
- GRM
- 8.1
CMA / ARV
- ARV (median comp)
- $234,474
- List price
- $205,000
- Delta
- -12.57%
- Verdict
- UNDERPRICED
- Comps
- 20 within 1.0 mi
Show comp detail 8 sales within ~0.75 mi
| Address | Dist | Beds/Ba | Sqft | Sold | Price | $/sf | Match |
|---|---|---|---|---|---|---|---|
| 4123 Deerbriar Run Dr | 0.35mi | 3/2.0 (-1) | 1,440 (+1%) | 12mo | $236,000 | $164 | 68 |
| 13907 Prosperity Ridge Dr | 0.19mi | 3/2.0 (-1) | 1,505 (+5%) | 13mo | $240,000 | $159 | 67 |
| 14142 Bishop Bend Ln | 0.53mi | 4/2.5 | 1,505 (+5%) | 3mo | $225,000 | $150 | 62 |
| 4123 Mineral Haven Dr | 0.31mi | 3/2.0 (-1) | 1,505 (+5%) | 24mo | $235,000 | $156 | 52 |
| 14103 Ballfour Park Ln | 0.43mi | 4/2.5 | 1,514 (+6%) | 24mo | $249,900 | $165 | 48 |
| 13761 Cottingham St | 0.60mi | 4/2.0 | 1,344 (-6%) | 21mo | $550,000 | $409 | 45 |
| 14215 Dreamscape Cir | 0.61mi | 3/2.0 (-1) | 1,226 (-14%) | 3mo | $224,900 | $183 | 40 |
| 13319 Cottingham St | 0.73mi | 3/2.0 (-1) | 1,320 (-8%) | 11mo | $549,000 | $416 | 39 |
Match score weights: distance 35% · size 25% · config 20% · recency 20%. Top-matched comps best support the ARV.
Projected returns pro-forma
2.61% appreciation · 1.17% rent growth · sell at horizon
- IRR
- 11.5%
- Equity multiple
- 1.64×
- Total profit
- $36,668
- Equity at exit
- $87,729
- IRR
- 13.0%
- Equity multiple
- 2.80×
- Total profit
- $103,053
- Equity at exit
- $131,839
Cash invested: $57,400 (down + closing). Projections, not guarantees.
Landlord ↔ Tenant lean methodology
- Overall (STATE)
- 87 Strongly Landlord-Friendly
- State Texas
- 87 Strongly Landlord-Friendly · R+5
- County
- — inherits STATE
- City
- — inherits STATE
ZIP-level market 77048
- Home prices YoY
- 1.0%
- Rents YoY
- 1.2%
- Active inventory
- 303
- Price-to-rent
- 8.1×
Monthly cashflow live
- Estimated rent
- $2,097 high interval (Pro) →
- Mortgage (P&I)
- −$1,075
- Tax from tax record
- −$183 /mo · $2,196/yr
- Insurance
- −$85
- HOA
- −$0
- Vacancy / Maint / Mgmt
- −$440
- Net cashflow
- $313
Break-even live
Sensitivity live
| Price | -10% $429 | -5% $371 | +0% $313 | +5% $255 | +10% $197 |
|---|---|---|---|---|---|
| Rent | -10% $148 | -5% $231 | +0% $313 | +5% $396 | +10% $479 |
| Rate | -1.0pp $417 | -0.5pp $366 | base $313 | +0.5pp $260 | +1.0pp $206 |
UW: 25.0% down · 7.5% · 30yr · 1.5% tax · 5.0% vac · 8.0% maint · 8.0% mgmt
Financing live
Cash to close
- Down payment
- $51,250
- Closing costs
- $6,150
- Reserves months
- —
- Total cash needed
- —
Loan-product check · same deal, 3 products live
Conventional
25% down · 7.5% · 30yr
- Down + closing
- —
- Monthly P&I
- —
- Monthly cashflow
- —
- DSCR
- —
- Eligible?
- —
Personal DTI + credit; lowest rate.
DSCR
20% down · 8.5% · 30yr
- Down + closing
- —
- Monthly P&I
- —
- Monthly cashflow
- —
- DSCR
- —
- Eligible?
- —
No personal income docs; deal must DSCR.
Hard money
10% down · 12.0% · 12mo
- Down + closing
- —
- Monthly P&I
- —
- Monthly cashflow
- —
- DSCR
- —
- Eligible?
- —
Short-term bridge; refi at stabilization.
Rent comps 11 comps
| Address | Beds | Baths | Sqft | Rent | $/sqft | DOM | Units | Dist |
|---|---|---|---|---|---|---|---|---|
| 13555 Cullen Blvd Houston, TX | 1.0–3.0 | 1.0–2.0 | 917 | $1,900 | $2.07 | 44d | 35 | 0.59mi |
| 4814 Centipede Rd Unit B Houston, TX | 3.0 | 2.5 | 1701 | $1,950 | $1.15 | 22d | 1 | 0.85mi |
| 3918 Almeda-Genoa Rd Houston, TX | 1.0–3.0 | 1.0–2.0 | 1038 | $2,220 | $2.14 | 0d | 27 | 0.90mi |
| 13442 Lucky Bill Ln Houston, TX | 3.0 | 2.0 | 1427 | $2,195 | $1.54 | 22d | 1 | 0.97mi |
| 4023 Almond Lake Dr Houston, TX | 3.0 | 2.0 | 1414 | $1,980 | $1.40 | 44d | 1 | 0.98mi |
| 13427 Lucky Bill Ln Houston, TX | 3.0 | 2.5 | 1443 | $2,095 | $1.45 | 8d | 1 | 1.02mi |
| 13311 Lucky Bill Ln Houston, TX | 3.0 | 2.5 | 1597 | $2,250 | $1.41 | 44d | 1 | 1.11mi |
| 3403 Orchid Trace Ln Houston, TX | 3.0 | 2.5 | 1602 | $1,920 | $1.20 | 3d | 1 | 1.29mi |
| 12210 Roandale Dr Houston, TX | 3.0 | 2.0 | 1738 | $1,775 | $1.02 | 44d | 1 | 1.37mi |
| 12227 Cape Hyannis Dr Houston, TX | 3.0 | 2.0 | 1432 | $1,705 | $1.19 | 14d | 1 | 1.37mi |
| 5425 E Orem Dr Houston, TX | 1.0–3.0 | 1.0–2.0 | 910 | $1,499 | $1.65 | 0d | 13 | 1.50mi |
Listing history 21 events
-
2026-06-18days on market $205,000 Active 225 DOM
-
2026-06-17days on market $205,000 Active 224 DOM
-
2026-06-16days on market $205,000 Active 223 DOM
-
2026-06-15days on market $205,000 Active 222 DOM
-
2026-06-13days on market $205,000 Active 220 DOM
-
2026-06-10days on market $205,000 Active 216 DOM
-
2026-06-08days on market $205,000 Active 215 DOM
-
2026-06-07days on market $205,000 Active 214 DOM
-
2026-06-04days on market $205,000 Active 211 DOM
-
2026-06-01days on market $205,000 Active 208 DOM
-
2026-05-31days on market $205,000 Active 207 DOM
-
2026-05-08price $205,000 107-char remark
Show marketing remark (107 chars)
Beautiful and very spacious property south of highway 288, completely remodeled and ready for its new owner
-
2025-12-13price $230,000 107-char remark
Show marketing remark (107 chars)
Beautiful and very spacious property south of highway 288, completely remodeled and ready for its new owner
-
2025-11-05$245,000 Active 107-char remark
Show marketing remark (107 chars)
Beautiful and very spacious property south of highway 288, completely remodeled and ready for its new owner
-
2024-11-15soldstatus
-
2022-12-11historical
-
2021-12-01soldstatus
-
2009-02-04soldstatus
-
2007-06-25soldstatus
-
2002-01-07soldstatus
-
1989-04-18soldstatus
ⓘ Source: listings_history table (triggers on properties + properties_extension) + one-shot
backfill from property_details.listing_events for pre-trigger history.
Tax reassessment forecast TX · Resets to sale price
- Current annual tax
- $2,196 · $183/mo
- Projected year-2 tax
- $3,752 · $313/mo
- Expected delta
- +$1,555/yr (+$130/mo · 70.8%)
ⓘ Screening estimate from a state-policy table — verify with the county assessor before closing.
Climate risk First Street
- Flood 3/10 Moderate FEMA zone X (unshaded) · 7% chance over 30 yrs
- Wildfire 3/10 Moderate
- Heat 9/10 Extreme 7 d/yr ≥108°F today · 22 d/yr by 30 yrs out
- Wind 9/10 Extreme 99% chance of damaging wind over 30 yrs
- Air quality 2/10 Low 1 unhealthy d/yr today · 2 by 30 yrs out
Nearby sold comps map
Loading sold comps map…
Walkable amenities ~0.75 mi
Loading nearby amenities…
Taxation est. · year 1
- Rental income
- $25,168
- − Mortgage interest
- −$11,483
- − Property taxes
- −$2,196
- − Insurance
- −$1,025
- − Repairs & maintenance
- −$2,013
- − Management
- −$2,013
- − Depreciation
- −$5,964
- Taxable income
- $473
- Est. tax owed @ 24.0%
- −$113
- After-tax cash flow
- $3,647/yr
For passive investors: Depreciation is non-cash, so a rental often shows a tax loss while cash-flowing — sheltering income. Rental losses are passive: they offset passive income freely, and up to $25,000/yr can offset ordinary (W-2) income if you actively participate and your MAGI is under $100k (phasing out to $0 by $150k); unused losses carry forward. On sale, claimed depreciation is recaptured at up to 25%, and gains may owe capital-gains tax (a 1031 exchange can defer both). Figures are a year-1 estimate at your 24.0% rate — not tax advice; consult a CPA.
Schools (NCES district)
- District
- Houston ISD
- NCES district ID
- 4823640
- Math proficiency
- 27% ▼ -18.00%
- Reading proficiency
- 35% ▼ -6.00%
- Median HH income
- $46,054
- Composite
- 26.63/100
- National rank
- #7173
- State rank
- #593 of 826 in TX
Livability — Houston
- Score
- 74/100
- State rank
- #184
- US rank
- #4771
Category grades
Schools grade is shown separately in the Schools card above.
Census & demographics
- Census place
- Houston, TX
- County
- Harris County · 4,702,590 people
- City population
- 3,226,434
- Metro
- Houston-The Woodlands-Sugar Land, TX
- Population (ZIP)
- 21,151
- Household income
- $56,747
- Rent vs Own
- Severe rent burden
- 1117.0
Population outlook (Harris County) Hauer SSP2
- Today (2025)
- 5,571,493 people
- By 2030
- 6,089,821 · +9.3%
- By 2040
- 7,142,806 · +28.2%
- By 2050
- 8,185,864 · +46.9%
- By 2075
- 10,574,329 · +89.8%
- By 2100
- 12,109,958 · +117.4%
Race, ethnicity, and origin ACS 2023
- Neighborhood character
- Predominantly Black (69%)
- Race & ethnicity
- Black 69% Hispanic / Latino 24% Two or more races 6% Asian 3% White 2%
- Hispanic origin (detail)
- Mexican 17% Puerto Rican 1%
- Foreign-born
- 12% · Canada, Vietnam
- Languages at home
- 76% English-only · Spanish 20% Tagalog/Filipino 2% Vietnamese 1%
Political lean MEDSL · Harris
- 2024 margin
- Lean D (+5.5) · D 52.0% · R 46.4% · Other 1.6%
- 2008→2024 swing
- +3.9pp toward D · 2008: 1.6pp · 2024: 5.5pp
- All cycles
- 2024: D+5.5 2020: D+13.3 2016: D+12.4 2012: D+0.1 2008: D+1.6
Not yet ingested
- Civics
- —
Market trends
- HPI YoY
- ▲ 2.61%
- Current HPI
- 266.4468
- Rent YoY
- ▲ 1.17%
- Metro
- Houston-The Woodlands-Sugar Land, TX
- State GDP YoY
- ▲ 3.95%
- F500 in state
- 110
Industry mix (Fortune 500 HQ in TX)
| Industry | F500 HQs | Revenue |
|---|---|---|
| Energy | 16 | $1,198B |
|
||
| Technology | 5 | $198B |
|
||
| Engineering / Construction | 4 | $72B |
|
||
| Energy Services | 3 | $60B |
|
||
| Utilities | 3 | $41B |
|
||
| Healthcare | 2 | $330B |
|
||
Price history
-16.3% since first listed10 events — show timeline
- 2026-05-08 Price Changed $205,000 HARMLS
- 2025-12-13 Price Changed $230,000 HARMLS
- 2025-11-05 Listed $245,000 HARMLS
- 2024-11-15 Sold (Public Records) — Public Records
- 2022-12-11 Rental Removed — RENT.
- 2021-12-01 Sold (Public Records) — Public Records
- 2009-02-04 Sold (Public Records) — Public Records
- 2007-06-25 Sold (Public Records) — Public Records
- 2002-01-07 Sold (Public Records) — Public Records
- 1989-04-18 Sold (Public Records) — Public Records
Property tax history
+6.6%/yrLatest (2025): $2,196 · +9.3% YoY. Source: county tax records.
Cash-flow waterfall
monthlySold comps — $/sqft
last 12 mo · ≤1 miLoading sold comps…