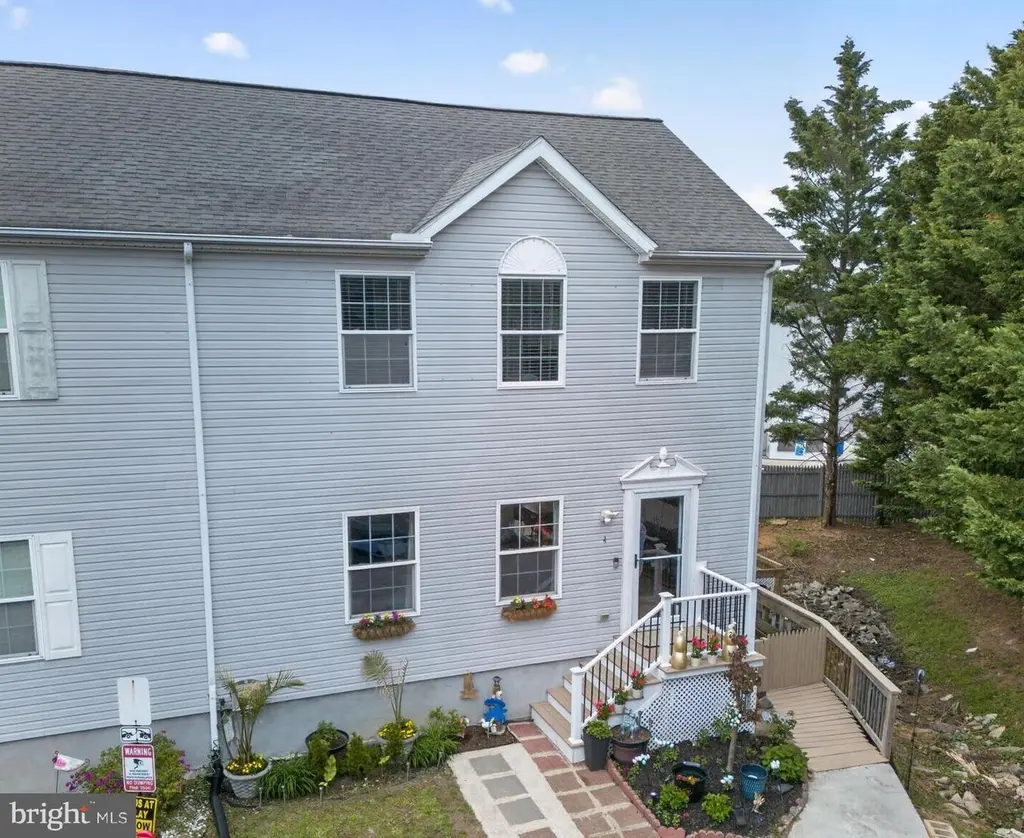
35615 South St #4 · Lewes, DE
Flood risk 6/10 · Moderate
- FEMA flood zone
- X (unshaded)
- Chance of flooding over 30 yrs
- 0.7%
- Est. flood insurance / yr
- $473 – $860
Fire risk 1/10 · Minimal
- Est. fire insurance / yr
- $476 – $884
Heat risk 9/10 · Severe
- Hot days now (above 101°F)
- 7 days/yr
- Hot days in 30 yrs
- 18 days/yr
Wind risk 8/10 · Major
- Chance of severe wind over 30 yrs
- 80.0%
Air-quality risk 2/10 · Minimal
- Unhealthy air days now
- 1 days/yr
- Unhealthy air days in 30 yrs
- 1 days/yr
Risk factors via First Street. Map © Google.
Why this score? — see what drove the F grade
The composite is a weighted blend of 9 inputs, each scored 0–100. Each bar is that input's sub-score; the figure is the points it added to the 100-point composite (weight × sub-score).
- ARV discount +15.0/15.0
- Schools +4.2/10.0
- Cash flow +4.0/30.0
- Livability +3.4/5.0
- Rent growth +2.5/5.0
- Condition / age +2.5/5.0
- 1% rule +1.0/10.0
- DSCR +0.0/10.0
- Appreciation +0.0/10.0
$420,000
🖨 Deal sheet (PDF) 📄 Offer letter ✓ Due diligence
Listing remarks
Welcome to 35615 South Street, Unit #4, a beautifully remodeled end-unit townhome in the centrally located community of South Street Station. Offering approximately 1,500 square feet of above-grade living space, this home delivers comfort, style, and exceptional convenience to everything coastal Delaware has to offer. The main living areas feature 4 bedrooms and 4 full bathrooms, including two primary suites—one conveniently located on the main level and another upstairs—offering flexibility for multi-generational living or hosting guests. The open and inviting layout is complemented by modern updates throughout. As an end unit, the home enjoys added natural light and privacy, w
Key facts
- Spacious bonus room
- $250 HOA
- 3 parking spots
Tags
Property features AI
Finance
- HOA & community: Quarterly condo fee of $750; Owner/self-managed association; HOA covers common area maintenance, exterior building maintenance, lawn maintenance, reserve funds, road maintenance, snow removal, trash, and water; Road maintenance responsibility handled by HOA; Ground rent paid annually
Exterior
- Parking: Paved parking lot with 3 spaces (total 3 garage/parking spaces)
- Utilities: Fiber optic internet available; Electric heating/cooling and hot water; Public sewer; Community / shared well water; No municipal trash service
- Home design: Condominium ownership; End of row townhouse; Very good condition; Year built (per assessor)
- Construction: Concrete perimeter foundation; Concrete and frame construction with vinyl siding; CPVC/PVC plumbing; Architectural shingle roof
- Exterior features: Deck(s); Not in a federal flood zone; Above- and below-grade structures
Interior
- Kitchen: Dishwasher; Microwave; Electric range/oven; Refrigerator; Stainless steel appliances
- Bedrooms: 3 bedrooms on the upper level; 1 bedroom on the main level
- Flooring: Ceramic tile; Luxury vinyl plank
- Bathrooms: 2 full bathrooms on the upper level; 1 full bathroom on the main level; 1 full bathroom on the lower level; 4 full bathrooms total
- Heating & cooling: Heat pump(s); Central air (electric); 200+ amp electrical service
- Interior features: Ceiling fans; Combination kitchen and dining area; Entry-level bedroom; Galley kitchen; Drywall walls and ceilings; Fully finished basement
- Laundry & utility: Washer; Dryer (electric); Laundry located on upper floor; Electric water heater
Neighborhood map
What this means for you Summary
Snapshot
- This is a 3-bed/3.0-bath townhouse listed at $420k.
Deal economics
- At list price, monthly cash flow is $-1k ($-14k/yr) — negative.
- To cash-flow at today's rent, offer at most $250k (40.6% below list).
- To meet the 1% rule (rent ≥ 1% of price), the offer needs to be $250k (40.5% below list).
- Recommended offer: $250k (40.6% below list) — sets the bar for cash-flow.
- Cap rate 2.9% vs local median 1.7% in Lewes — top-decile yield for the area; either an underpriced asset or a hidden risk that comps aren't pricing in. Stress-test before assuming the spread holds.
Location & tenants
- Location reads 67/100 on livability (#40 in DE) — a middle-class / working-renter tenant base. Strengths: crime A+, employment A+, health & safety A+; Watch: commute F, cost of living F.
- Cape Henlopen School District (town): math 42% / reading 55% proficiency, ranked #5 of 26 in DE (top 19%) — families likely to look elsewhere, expect single-tenant / working-renter base with shorter leases.
- Zoned schools: Rehoboth Elementary School (math 51% / reading 60%, grade C, #8 of 105 statewide, top 8%, 525 students, 0% FRL); Beacon Middle School (math 49% / reading 62%, grade B-, #1 of 36 statewide, top 0%, 648 students, 0% FRL); Cape Henlopen High School (math 26% / reading 51%, grade F, #14 of 40 statewide, top 33%, 1,813 students, 0% FRL) — zoned schools average 0% FRL vs 41% district-wide (41 pts lower); this property's tenant base skews higher-income than the district average.
- Market conditions: 331 active listings in the ZIP; 1 comparable units currently listed for rent nearby; solid renter incomes; 4,354 units permitted in Sussex County in 2024 (344 in 5+ unit buildings).
Forward outlook
- Local home prices are declining (-3.0%/yr); year-one equity from $3k of loan paydown is wiped out by about $13k of value loss. Plan a longer hold.
- Sussex County population projected at +25% by 2050 — long-run rental-demand tailwind backs the buy-and-hold thesis.
Negotiation context
- It's been on market 48 days — a 3% lower offer ($407k) is reasonable based on typical stale-listing flexibility.
Risks & watch-outs
- Climate carrying-cost: major flood risk; severe wind risk, 80% chance of damaging wind over 30y; extreme-heat days projected 7→18/yr by 2055 (HVAC capex compounding) — expect insurance premiums to compound above CPI over the hold.
Questions for the listing agent
- What do current leases actually rent for vs. the listed asking? Can we see a recent rent roll and the last 12 months of T-12 income?
- It's been on market 48 days. Have you received any prior offers? Is the seller open to a 41% concession, seller financing, or rate buy-down credit?
- What does the HOA fee cover, when was the last increase, and are there any pending special assessments or reserve-fund shortfalls?
- Is there a deadline driving the sale (1031 exchange, divorce, estate, relocation)? That informs how much negotiation room exists.
- Schools are B-rated — typically a magnet for longer-tenancy family renters. What's the average tenant stay here, and is there a school-zone premium baked into asking?
- The area grade is low — what's the realistic commute time and amenity access for the typical tenant pool here? Any planned neighborhood developments (good or bad) we should know about?
- What's the average days-on-market for RENTAL listings here right now (not sales)? A rising rental-DOM trend means longer vacancies and softer asking-rent achievability than the comps imply.
- What's the recent tenant-quality profile in this submarket — average credit score on applications, eviction rate, late-payment / NSF rate, and stable-employment percentage? A property-management company in the area should have these aggregated.
- How much new for-sale + rental construction is in the pipeline within 1–3 miles? Heavy new supply typically softens prices + rents 12–24 months out; constrained supply supports both.
Investment metrics
- 1% rule
- 0.60% ✗
- Cap rate
- 2.93%
- Cash-on-cash
- -12.02%
- DSCR
- 0.47
- GRM
- 14.0
CMA / ARV
- ARV (median comp)
- $511,504
- List price
- $420,000
- Delta
- -17.89%
- Verdict
- UNDERPRICED
- Comps
- 20 within 1.0 mi
Projected returns pro-forma
-3.0% appreciation · 3.0% rent growth · sell at horizon
- IRR
- -38.4%
- Equity multiple
- -0.22×
- Total profit
- $-142,907
- Equity at exit
- $62,623
- IRR
- -57.3%
- Equity multiple
- -0.87×
- Total profit
- $-220,290
- Equity at exit
- $36,314
Cash invested: $117,600 (down + closing). Projections, not guarantees.
Landlord ↔ Tenant lean methodology
- Overall (STATE)
- 70 Landlord-Friendly
- State Delaware
- 70 Landlord-Friendly · D+7
- County
- — inherits STATE
- City
- — inherits STATE
ZIP-level market 19971
- Active inventory
- 331
- Price-to-rent
- 14.0×
Monthly cashflow live
- Estimated rent
- $2,499 medium interval (Pro) →
- Mortgage (P&I)
- −$2,203
- Tax est. 1.5%
- −$525 /mo · $6,300/yr
- Insurance
- −$175
- HOA
- −$250
- Vacancy / Maint / Mgmt
- −$525
- Net cashflow
- $-1,178
Break-even live
Sensitivity live
| Price | -10% $-888 | -5% $-1,033 | +0% $-1,178 | +5% $-1,323 | +10% $-1,468 |
|---|---|---|---|---|---|
| Rent | -10% $-1,376 | -5% $-1,277 | +0% $-1,178 | +5% $-1,079 | +10% $-981 |
| Rate | -1.0pp $-967 | -0.5pp $-1,071 | base $-1,178 | +0.5pp $-1,287 | +1.0pp $-1,398 |
UW: 25.0% down · 7.5% · 30yr · 1.5% tax · 5.0% vac · 8.0% maint · 8.0% mgmt
Financing live
Cash to close
- Down payment
- $105,000
- Closing costs
- $12,600
- Reserves months
- —
- Total cash needed
- —
Loan-product check · same deal, 3 products live
Conventional
25% down · 7.5% · 30yr
- Down + closing
- —
- Monthly P&I
- —
- Monthly cashflow
- —
- DSCR
- —
- Eligible?
- —
Personal DTI + credit; lowest rate.
DSCR
20% down · 8.5% · 30yr
- Down + closing
- —
- Monthly P&I
- —
- Monthly cashflow
- —
- DSCR
- —
- Eligible?
- —
No personal income docs; deal must DSCR.
Hard money
10% down · 12.0% · 12mo
- Down + closing
- —
- Monthly P&I
- —
- Monthly cashflow
- —
- DSCR
- —
- Eligible?
- —
Short-term bridge; refi at stabilization.
Rent comps 1 comps
| Address | Beds | Baths | Sqft | Rent | $/sqft | DOM | Units | Dist |
|---|---|---|---|---|---|---|---|---|
| 32015 Azure Ave Rehoboth Beach, DE | 1.0–3.0 | 1.0–2.0 | 1054 | $2,375 | $2.25 | 45d | 1 | 0.33mi |
HOA detail
- Monthly dues
- $250 · $3,000/yr
Listing history 17 events
-
2026-06-18days on market $420,000 Active 48 DOM
-
2026-06-17days on market $420,000 Active 47 DOM
-
2026-06-16days on market $420,000 Active 46 DOM
-
2026-06-15days on market $420,000 Active 45 DOM
-
2026-06-14days on market $420,000 Active 43 DOM
-
2026-06-13days on market $420,000 Active 42 DOM
-
2026-06-10days on market $420,000 Active 40 DOM
-
2026-06-09days on market $420,000 Active 39 DOM
-
2026-06-08days on market $420,000 Active 38 DOM
-
2026-06-07days on market $420,000 Active 37 DOM
-
2026-06-05days on market $420,000 Active 34 DOM
-
2026-06-03days on market $420,000 Active 33 DOM
-
2026-06-02days on market $420,000 Active 32 DOM
-
2026-06-01days on market $420,000 Active 31 DOM
-
2026-05-31days on market $420,000 Active 30 DOM
-
2026-05-30days on market $420,000 Active 29 DOM
-
2026-05-02$420,000 Active 1593-char remark
ⓘ Source: listings_history table (triggers on properties + properties_extension) + one-shot
backfill from property_details.listing_events for pre-trigger history.
Climate risk First Street
- Flood 6/10 Major FEMA zone X (unshaded) · 70% chance over 30 yrs
- Wildfire 1/10 Low
- Heat 9/10 Extreme 7 d/yr ≥101°F today · 18 d/yr by 30 yrs out
- Wind 8/10 Severe 80% chance of damaging wind over 30 yrs
- Air quality 2/10 Low 1 unhealthy d/yr today · 1 by 30 yrs out
Nearby sold comps map
Loading sold comps map…
Walkable amenities ~0.75 mi
Loading nearby amenities…
Taxation est. · year 1
- Rental income
- $29,990
- − Mortgage interest
- −$23,527
- − Property taxes
- −$6,300
- − Insurance
- −$2,100
- − Repairs & maintenance
- −$2,399
- − Management
- −$2,399
- − HOA
- −$3,000
- − Depreciation
- −$12,218
- Taxable loss
- −$21,953
- Est. tax savings @ 24.0%
- +$5,269
- After-tax cash flow
- $-8,870/yr
For passive investors: Depreciation is non-cash, so a rental often shows a tax loss while cash-flowing — sheltering income. Rental losses are passive: they offset passive income freely, and up to $25,000/yr can offset ordinary (W-2) income if you actively participate and your MAGI is under $100k (phasing out to $0 by $150k); unused losses carry forward. On sale, claimed depreciation is recaptured at up to 25%, and gains may owe capital-gains tax (a 1031 exchange can defer both). Figures are a year-1 estimate at your 24.0% rate — not tax advice; consult a CPA.
Schools (NCES district)
- District
- Cape Henlopen School District
- NCES district ID
- 1000170
- Math proficiency
- 42% ▼ -14.00%
- Reading proficiency
- 55% ▼ -10.00%
- Median HH income
- $60,196
- Composite
- 42.47/100
- National rank
- #3214
- State rank
- #5 of 26 in DE
Livability — Lewes
- Score
- 67/100
- State rank
- #40
- US rank
- #11077
Category grades
Schools grade is shown separately in the Schools card above.
Census & demographics
- County
- Sussex County · 82,708 people
- City population
- 31,938
- Metro
- Salisbury, MD-DE
- Population (ZIP)
- 14,886
- Household income
- $102,146
- Rent vs Own
- Severe rent burden
- 317.0
Population outlook (Sussex County) Hauer SSP2
- Today (2025)
- 248,853 people
- By 2030
- 264,464 · +6.3%
- By 2040
- 290,980 · +16.9%
- By 2050
- 311,259 · +25.1%
- By 2075
- 352,488 · +41.6%
- By 2100
- 367,406 · +47.6%
Race, ethnicity, and origin ACS 2023
- Neighborhood character
- Predominantly White (88%)
- Race & ethnicity
- White 88% Black 4% Two or more races 4% Hispanic / Latino 3% Asian 2%
- Common ancestry
- Romanian 5% Slovak 3% Italian 3%
- Foreign-born
- 6% · Canada, China
- Languages at home
- 95% English-only · Spanish 2% Russian/Polish/Slavic 1% French/Haitian/Cajun 1%
Political lean MEDSL · Sussex
- 2024 margin
- R (+11.0) · D 43.9% · R 54.9% · Other 1.2%
- 2008→2024 swing
- -2.4pp toward R · 2008: -8.6pp · 2024: -11.0pp
- All cycles
- 2024: R+11.0 2020: R+11.2 2016: R+22.0 2012: R+13.0 2008: R+8.6
Not yet ingested
- Civics
- —
Market trends
- HPI YoY
- ▼ -220.39%
- Current HPI
- 353.3977
- Rent YoY
- —
- Metro
- Salisbury, MD-DE
- State GDP YoY
- —
- F500 in state
- 0
Price history
1 event — show timeline
- 2026-05-02 Listed $420,000 BRIGHT MLS
Property tax history
+1.3%/yrLatest (2025): $656 · -11.9% YoY. Source: county tax records.
Cash-flow waterfall
monthlySold comps — $/sqft
last 12 mo · ≤1 miLoading sold comps…