 Triplex
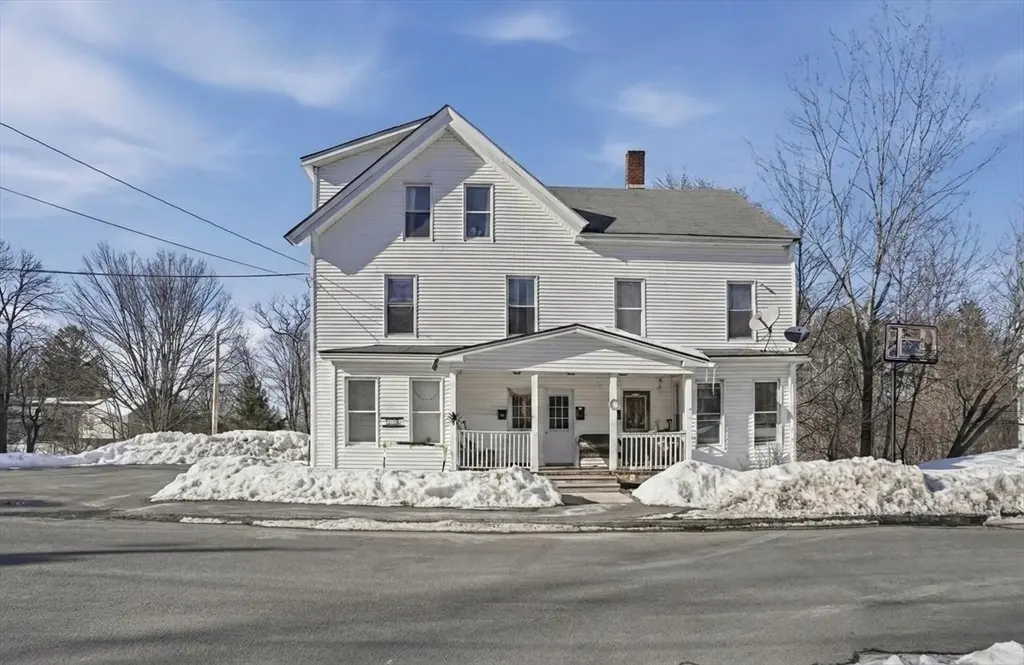
52-56 Green St · Athol, MA
Flood risk 1/10 · Minimal
- FEMA flood zone
- —
- Chance of flooding over 30 yrs
- 0.0%
- Est. flood insurance / yr
- —
Fire risk 3/10 · Minor
- Est. fire insurance / yr
- $915 – $1,699
Heat risk 3/10 · Minor
- Hot days now (above 92°F)
- 7 days/yr
- Hot days in 30 yrs
- 17 days/yr
Wind risk 4/10 · Minor
- Chance of severe wind over 30 yrs
- 18.0%
Air-quality risk 2/10 · Minimal
- Unhealthy air days now
- 1 days/yr
- Unhealthy air days in 30 yrs
- 1 days/yr
Risk factors via First Street. Map © Google.
Why this score? — see what drove the C grade
The composite is a weighted blend of 9 inputs, each scored 0–100. Each bar is that input's sub-score; the figure is the points it added to the 100-point composite (weight × sub-score).
- Cash flow +28.0/30.0
- DSCR +9.9/10.0
- 1% rule +7.0/10.0
- Livability +3.7/5.0
- Rent growth +2.5/5.0
- Condition / age +2.5/5.0
- Schools +2.4/10.0
- ARV discount +1.4/15.0
- Appreciation +0.0/10.0
$499,000
🖨 Deal sheet (PDF) 📄 Offer letter ✓ Due diligence
Multi-family units
County records classify this as Multi-Family (2-4 Unit). Listing-text estimate: 3 units. confirmed
Listing remarks
Investors take note! Exceptional opportunity to own a spacious three-unit multi-family property offering strong income potential & versatile living options. Each unit features its own private deck & generous storage space & electric is separately metered for each unit. The 1st unit offers convenient single-level living w/ 2 bedrooms, full bath, a spacious eat-in kitchen & living room. 2nd unit boasts a bright living room w/ a bay window, eat-in kitchen, 2 bedrooms & a half bath on the main level, plus 2 addit'l bedrooms & full bath on the 2nd floor. The third unit spans 3 levels & provides expansive living space, including an eat-in kitchen w/ walk-
Key facts
- Private deck
- Bay window
- Eat-in kitchen
Tags
Neighborhood map
What this means for you Summary
Snapshot
- This is a 3 × 2-bed/1.5-bath units multifamily listed at $499k.
Deal economics
- At list price, monthly cash flow is $2k ($19k/yr) — positive. Per door: $515/mo.
- The deal already cash-flows at list — no discount required.
- Meets the 1% rule at list price ($6k rent vs $499k).
- Recommended offer: $454k (9.0% below list) — sets the bar for market timing.
- Cap rate 10.0% vs local median 4.0% in Athol — top-decile yield for the area; either an underpriced asset or a hidden risk that comps aren't pricing in. Stress-test before assuming the spread holds.
Location & tenants
- Location reads 74/100 on livability (#84 in MA, #4,383 nationally) — a middle-class / working-renter tenant base. Strengths: housing A+, health & safety A+, cost of living A-; Watch: employment D, amenities F.
- Athol-Royalston (town): math 22% / reading 33% proficiency, ranked #265 of 302 in MA (top 88%) — low school quality limits family demand, transient renter base, plan for 1-2y turnover.
- Zoned schools: Athol-Royalston Middle School (math 15% / reading 24%, grade F, #258 of 305 statewide, top 86%, 429 students, 0% FRL); Athol High (math 22% / reading 42%, grade F, #255 of 343 statewide, top 77%, 404 students, 0% FRL) — zoned schools average 0% FRL vs 49% district-wide (49 pts lower); this property's tenant base skews higher-income than the district average.
- Market conditions: 48 active listings in the ZIP; 2,293 units permitted in Worcester County in 2024 (1,205 in 5+ unit buildings).
Forward outlook
- Local home prices are declining (-3.0%/yr); year-one equity from $3k of loan paydown is wiped out by about $15k of value loss. Plan a longer hold.
- At projected returns (-3.0% appreciation + 3.0% rent growth), your $140k cash investment doubles in ~9 years — after that, you're playing with house money.
Negotiation context
- It's been on market 98 days — a 9% lower offer ($454k) is reasonable based on typical stale-listing flexibility.
Risks & watch-outs
- Watch-outs: built in 1891 — expect roof / HVAC / electrical / plumbing capex.
Questions for the listing agent
- It's been on market 98 days. Have you received any prior offers? Is the seller open to a 9% concession, seller financing, or rate buy-down credit?
- Can we see the unit-by-unit rent roll, current vacancy, and any below-market leases? What's the average tenancy length?
- What capital expenditures (roof, boiler, parking lot, exteriors) have been made in the last 5 years, and what's planned in the next 2?
- Built in 1891 — when were the roof, HVAC, electrical panel, plumbing, and water heater last replaced?
- Why hasn't it sold? Are there any deal-killer items the seller is aware of (foundation, flood, title, zoning, code violations)?
- Is there a deadline driving the sale (1031 exchange, divorce, estate, relocation)? That informs how much negotiation room exists.
- Schools are F-rated, which usually means shorter tenancies and higher turnover. Who's the typical renter profile here, and what's been the actual vacancy rate?
- What's the average days-on-market for RENTAL listings here right now (not sales)? A rising rental-DOM trend means longer vacancies and softer asking-rent achievability than the comps imply.
- What's the recent tenant-quality profile in this submarket — average credit score on applications, eviction rate, late-payment / NSF rate, and stable-employment percentage? A property-management company in the area should have these aggregated.
- How much new apartment / multifamily construction is in the pipeline within 1–3 miles? Heavy new supply (>2% of stock underway) typically softens rents 12–24 months out; light construction supports rent growth.
Investment metrics
- 1% rule
- 1.20% ✓
- Cap rate
- 10.01%
- Cash-on-cash
- 13.27%
- DSCR
- 1.59
- GRM
- 7.0
CMA / ARV
- ARV (median comp)
- $439,116
- List price
- $499,000
- Delta
- 13.64%
- Verdict
- OVERPRICED
- Comps
- 17 within 1.0 mi
Projected returns pro-forma
-3.0% appreciation · 3.0% rent growth · sell at horizon
- IRR
- 3.2%
- Equity multiple
- 1.13×
- Total profit
- $17,476
- Equity at exit
- $74,403
- IRR
- 12.8%
- Equity multiple
- 2.01×
- Total profit
- $141,621
- Equity at exit
- $43,144
Cash invested: $139,720 (down + closing). Projections, not guarantees.
Landlord ↔ Tenant lean methodology
- Overall (STATE)
- 20 Strongly Tenant-Friendly
- State Massachusetts
- 20 Strongly Tenant-Friendly · D+15
- County
- — inherits STATE
- City
- — inherits STATE
ZIP-level market 01331
- Home prices YoY
- -9.9%
- Active inventory
- 48
- Price-to-rent
- 20.9×
Monthly cashflow live
- Estimated rent
- $5,973 high interval (Pro) →
- Mortgage (P&I)
- −$2,617
- Tax from tax record
- −$349 /mo · $4,185/yr
- Insurance
- −$208
- HOA
- −$0
- Vacancy / Maint / Mgmt
- −$1,254
- Net cashflow
- $1,545
Break-even live
Sensitivity live
| Price | -10% $1,828 | -5% $1,686 | +0% $1,545 | +5% $1,404 | +10% $1,263 |
|---|---|---|---|---|---|
| Rent | -10% $1,073 | -5% $1,309 | +0% $1,545 | +5% $1,781 | +10% $2,017 |
| Rate | -1.0pp $1,796 | -0.5pp $1,672 | base $1,545 | +0.5pp $1,416 | +1.0pp $1,284 |
3-unit breakdown (identical units grouped — click to expand)
| Units | Beds | Baths | Est. rent |
|---|---|---|---|
| 3× units | 2 | 1.5 | $5,973 |
| #1 | 2 | 1.5 | $1,991 |
| #2 | 2 | 1.5 | $1,991 |
| #3 | 2 | 1.5 | $1,991 |
| Total (3 units) | $5,973 | ||
UW: 25.0% down · 7.5% · 30yr · 1.5% tax · 5.0% vac · 8.0% maint · 8.0% mgmt
Financing live
Cash to close
- Down payment
- $124,750
- Closing costs
- $14,970
- Reserves months
- —
- Total cash needed
- —
Loan-product check · same deal, 3 products live
Conventional
25% down · 7.5% · 30yr
- Down + closing
- —
- Monthly P&I
- —
- Monthly cashflow
- —
- DSCR
- —
- Eligible?
- —
Personal DTI + credit; lowest rate.
DSCR
20% down · 8.5% · 30yr
- Down + closing
- —
- Monthly P&I
- —
- Monthly cashflow
- —
- DSCR
- —
- Eligible?
- —
No personal income docs; deal must DSCR.
Hard money
10% down · 12.0% · 12mo
- Down + closing
- —
- Monthly P&I
- —
- Monthly cashflow
- —
- DSCR
- —
- Eligible?
- —
Short-term bridge; refi at stabilization.
Listing history 17 events
-
2026-06-21days on market $499,000 Active 98 DOM
-
2026-06-21days on market $499,000 Active 97 DOM
-
2026-06-18days on market $499,000 Active 95 DOM
-
2026-06-17days on market $499,000 Active 94 DOM
-
2026-06-16days on market $499,000 Active 93 DOM
-
2026-06-15days on market $499,000 Active 92 DOM
-
2026-06-13days on market $499,000 Active 90 DOM
-
2026-06-12days on market $499,000 Active 89 DOM
-
2026-06-09days on market $499,000 Active 86 DOM
-
2026-06-08days on market $499,000 Active 85 DOM
-
2026-06-07days on market $499,000 Active 84 DOM
-
2026-06-07days on market $499,000 Active 83 DOM
-
2026-06-04days on market $499,000 Active 80 DOM
-
2026-06-02days on market $499,000 Active 79 DOM
-
2026-06-01days on market $499,000 Active 78 DOM
-
2026-05-31days on market $499,000 Active 77 DOM
-
2026-05-31days on market $499,000 Active 76 DOM
ⓘ Source: listings_history table (triggers on properties + properties_extension) + one-shot
backfill from property_details.listing_events for pre-trigger history.
Tax reassessment forecast MA · Partial reset (capped growth)
- Current annual tax
- $4,185 · $349/mo
- Projected year-2 tax
- $5,161 · $430/mo
- Expected delta
- +$976/yr (+$81/mo · 23.3%)
ⓘ Screening estimate from a state-policy table — verify with the county assessor before closing.
Climate risk First Street
- Flood 1/10 Low 0% chance over 30 yrs
- Wildfire 3/10 Moderate
- Heat 3/10 Moderate 7 d/yr ≥92°F today · 17 d/yr by 30 yrs out
- Wind 4/10 Moderate 18% chance of damaging wind over 30 yrs
- Air quality 2/10 Low 1 unhealthy d/yr today · 1 by 30 yrs out
Nearby sold comps map
Loading sold comps map…
Walkable amenities ~0.75 mi
Loading nearby amenities…
Taxation est. · year 1
- Rental income
- $71,676
- − Mortgage interest
- −$27,952
- − Property taxes
- −$4,185
- − Insurance
- −$2,495
- − Repairs & maintenance
- −$5,734
- − Management
- −$5,734
- − Depreciation
- −$14,516
- Taxable income
- $11,060
- Est. tax owed @ 24.0%
- −$2,654
- After-tax cash flow
- $15,888/yr
For passive investors: Depreciation is non-cash, so a rental often shows a tax loss while cash-flowing — sheltering income. Rental losses are passive: they offset passive income freely, and up to $25,000/yr can offset ordinary (W-2) income if you actively participate and your MAGI is under $100k (phasing out to $0 by $150k); unused losses carry forward. On sale, claimed depreciation is recaptured at up to 25%, and gains may owe capital-gains tax (a 1031 exchange can defer both). Figures are a year-1 estimate at your 24.0% rate — not tax advice; consult a CPA.
Schools (NCES district)
- District
- Athol-Royalston
- NCES district ID
- 2502160
- Math proficiency
- 22% ▼ -14.00%
- Reading proficiency
- 33% ▼ -5.00%
- Median HH income
- $49,570
- Composite
- 24.05/100
- National rank
- #7764
- State rank
- #265 of 302 in MA
Livability — Athol
- Score
- 74/100
- State rank
- #84
- US rank
- #4383
Category grades
Schools grade is shown separately in the Schools card above.
Census & demographics
- Census place
- Athol, MA
- Population (ZIP)
- 13,865
Population outlook (Worcester County) Hauer SSP2
- Today (2025)
- 850,858 people
- By 2030
- 860,403 · +1.1%
- By 2040
- 869,902 · +2.2%
- By 2050
- 869,110 · +2.1%
- By 2075
- 870,120 · +2.3%
- By 2100
- 829,703 · -2.5%
Race, ethnicity, and origin ACS 2023
- Neighborhood character
- Predominantly White (89%)
- Race & ethnicity
- White 89% Hispanic / Latino 5% Two or more races 4% Black 2%
- Hispanic origin (detail)
- Puerto Rican 4%
- Common ancestry
- Lithuanian 14% Romanian 6% Slovak 2%
- Foreign-born
- 3% · Canada
- Languages at home
- 94% English-only · Spanish 2% French/Haitian/Cajun 2% German/W. Germanic 1%
Political lean MEDSL · Worcester
- 2024 margin
- D (+10.0) · D 53.9% · R 43.9% · Other 2.2%
- 2008→2024 swing
- -3.8pp toward R · 2008: 13.8pp · 2024: 10.0pp
- All cycles
- 2024: D+10.0 2020: D+17.8 2016: D+10.5 2012: D+9.2 2008: D+13.8
Not yet ingested
- Civics
- —
Market trends
- HPI YoY
- ▼ -37.02%
- Current HPI
- 336.1238
- Rent YoY
- —
- Metro
- —
- State GDP YoY
- ▲ 2.28%
- F500 in state
- 38
Industry mix (Fortune 500 HQ in MA)
| Industry | F500 HQs | Revenue |
|---|---|---|
| Technology | 3 | $17B |
|
||
| Insurance | 2 | $84B |
|
||
| Retail | 2 | $76B |
|
||
| Life Sciences | 1 | $43B |
|
||
| Energy Technology | 1 | $31B |
|
||
| Aerospace / Defense | 1 | $18B |
|
||
Property tax history
+3.5%/yrLatest (2023): $4,185 · +18.7% YoY. Source: county tax records.
Cash-flow waterfall
monthlySold comps — $/sqft
last 12 mo · ≤1 miLoading sold comps…