625 Chesapeake St SE #301 · Washington, DC
Flood risk 1/10 · Minimal
- FEMA flood zone
- X (unshaded)
- Chance of flooding over 30 yrs
- 0.0%
- Est. flood insurance / yr
- $507 – $1,088
Fire risk 3/10 · Minor
- Est. fire insurance / yr
- $631 – $1,173
Heat risk 8/10 · Major
- Hot days now (above 104°F)
- 7 days/yr
- Hot days in 30 yrs
- 16 days/yr
Wind risk 4/10 · Minor
- Chance of severe wind over 30 yrs
- 17.0%
Air-quality risk 3/10 · Minor
- Unhealthy air days now
- 2 days/yr
- Unhealthy air days in 30 yrs
- 3 days/yr
Risk factors via First Street. Map © Google.
Why this score? — see what drove the C+ grade
The composite is a weighted blend of 9 inputs, each scored 0–100. Each bar is that input's sub-score; the figure is the points it added to the 100-point composite (weight × sub-score).
- Cash flow +25.3/30.0
- 1% rule +10.0/10.0
- DSCR +8.3/10.0
- ARV discount +7.5/15.0
- Livability +3.7/5.0
- Schools +3.6/10.0
- Rent growth +3.5/5.0
- Condition / age +2.5/5.0
- Appreciation +0.0/10.0
$99,000
🖨 Deal sheet 📄 Offer letter ✓ Due diligence
Listing remarks
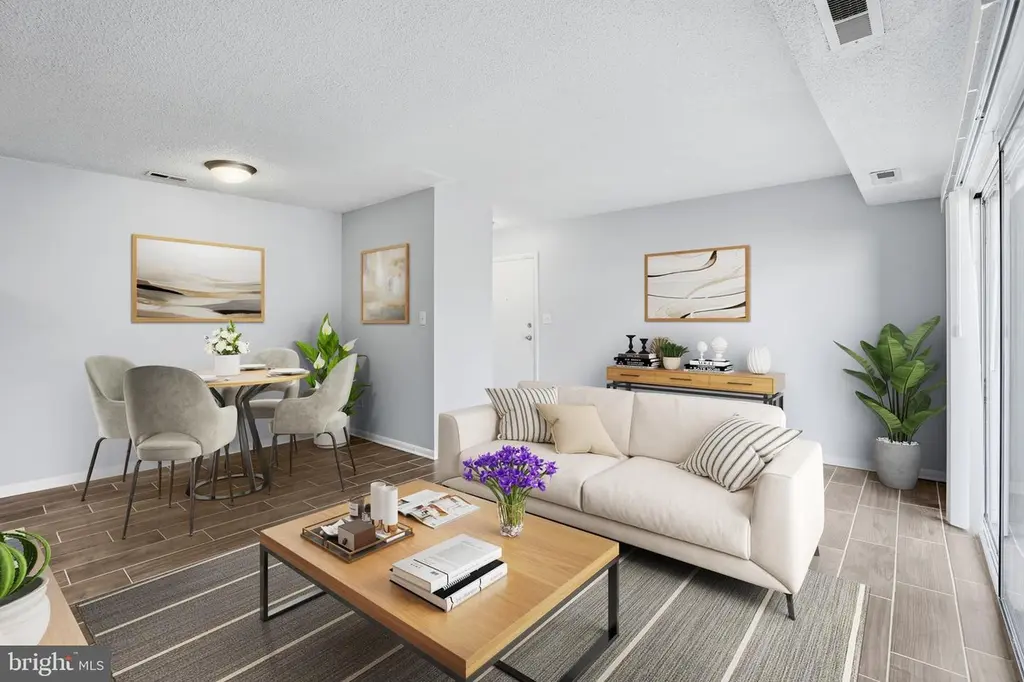
* Building Number is 625A Welcome to this move-in-ready top-floor 2-bedroom condo located in the heart of Congress Heights, Washington, DC. This refreshed unit features a bright, modern interior with stainless steel kitchen appliances, neutral finishes, and abundant natural light throughout. The open layout spans approximately 769 square feet, offering comfortable living and dining space ideal for everyday living or entertaining. Both bedrooms are generously sized, with the primary bedroom featuring a walk-in closet. This top-level unit offers added privacy and a quiet living experience. A community laundry room adds everyday convenience. The home includes assigned parking spaces, providin
Key facts
- Walk in closet
- Assigned parking
- Top floor
Tags
Property features AI
Finance
- HOA & community: Monthly condo fee of $350; Professionally managed off-site; Condo fee includes water, trash, and common area maintenance; Laundry facilities available through the association
Exterior
- Parking: Assigned parking (1 space); Off-street parking in a parking lot
- Utilities: Public water; Public sewer
- Home design: Condominium unit (Unit/Flat); Garden-style building (1–4 floors); Entry level: 3
- Construction: Year built: estimated
- Exterior features: Not in a federal flood zone; Pets allowed with no pet restrictions; Above grade and below grade structures
Interior
- Kitchen: Built-in microwave; Exhaust fan; Single oven; Refrigerator; Stainless steel appliances
- Bedrooms: 2 bedrooms on main level
- Bathrooms: 1 full bathroom on main level
- Heating & cooling: Forced air heating (electric); Central air conditioning (electric); Natural gas hot water
- Interior features: Excellent condition; Shared laundry in basement; Built-in microwave; Exhaust fan; Single oven; Refrigerator; Stainless steel appliances
- Laundry & utility: Shared laundry located in the basement; No in-unit washer/dryer hookup
Neighborhood map
What this means for you Summary
Snapshot
- This is a 2-bed/1.0-bath condo listed at $99k.
Deal economics
- At list price, monthly cash flow is $223 ($3k/yr) — positive.
- The deal already cash-flows at list — no discount required.
- Meets the 1% rule at list price ($2k rent vs $99k).
- Recommended offer: $96k (3.0% below list) — sets the bar for market timing.
- Cap rate 9.0% vs local median 2.5% in Washington — top-decile yield for the area; either an underpriced asset or a hidden risk that comps aren't pricing in. Stress-test before assuming the spread holds.
Location & tenants
- Location reads 73/100 on livability (#1 in DC) — a middle-class / working-renter tenant base. Strengths: amenities A+, commute A+, employment A+; Watch: crime F, cost of living F.
- District Of Columbia Public Schools (urban): math 33% / reading 40% proficiency, ranked #8 of 32 in DC (top 25%) — families likely to look elsewhere, expect single-tenant / working-renter base with shorter leases; 65% free/reduced lunch — lower-income household profile, screen leases tightly.
- Zoned schools: Ballou Hs (657 students, 0% FRL) — zoned schools average 0% FRL vs 65% district-wide (65 pts lower); this property's tenant base skews higher-income than the district average.
- Market conditions: Rents rising (+4.0%/yr); 145 active listings in the ZIP; 40 comparable units currently listed for rent nearby; rentals at typical pace (median 25d on market — plan ~3-4 weeks tenant-placement turnaround); 1,737 units permitted in District of Columbia in 2024 (1,506 in 5+ unit buildings).
- This rent runs 37% of the median local income ($49k/yr) — at the standard rent-burdened threshold; future hikes will face affordability resistance.
Forward outlook
- Local home prices are declining (-3.0%/yr); year-one equity from $684 of loan paydown is wiped out by about $3k of value loss. Plan a longer hold.
- District of Columbia County population projected at +50% by 2050 — long-run rental-demand tailwind backs the buy-and-hold thesis.
- At projected returns (-3.0% appreciation + 4.0% rent growth), your $28k cash investment doubles in ~10 years — after that, you're playing with house money.
Negotiation context
- It's been on market 54 days — a 3% lower offer ($96k) is reasonable based on typical stale-listing flexibility.
- 8 sale attempts since 17y ago; this cycle's ask has dropped $6k (6%) from the opening price — seller is motivated, your offer sets the floor, not the list.
Risks & watch-outs
- Watch-outs: HOA is 23% of rent.
- Climate carrying-cost: extreme-heat days projected 7→16/yr by 2055 (HVAC capex compounding) — expect insurance premiums to compound above CPI over the hold.
Questions for the listing agent
- It's been on market 54 days. Have you received any prior offers? Is the seller open to a 3% concession, seller financing, or rate buy-down credit?
- Built in 1960 — when were the roof, HVAC, electrical panel, plumbing, and water heater last replaced?
- What does the HOA fee cover, when was the last increase, and are there any pending special assessments or reserve-fund shortfalls?
- Any open or pending special assessments — roof, HVAC, plumbing, elevator, façade? What's the per-unit balance and payoff schedule, and is the seller paying it off at close or rolling it to the buyer?
- Is there a deadline driving the sale (1031 exchange, divorce, estate, relocation)? That informs how much negotiation room exists.
- Crime grade is F in this area — have there been break-ins, vandalism, or insurance claims at this property in the last 3 years? What carrier currently insures it and at what premium?
- What's the average days-on-market for RENTAL listings here right now (not sales)? A rising rental-DOM trend means longer vacancies and softer asking-rent achievability than the comps imply.
- What's the recent tenant-quality profile in this submarket — average credit score on applications, eviction rate, late-payment / NSF rate, and stable-employment percentage? A property-management company in the area should have these aggregated.
- How much new apartment / multifamily construction is in the pipeline within 1–3 miles? Heavy new supply (>2% of stock underway) typically softens rents 12–24 months out; light construction supports rent growth.
Investment metrics
- 1% rule
- 1.54% ✓
- Cap rate
- 9.00%
- Cash-on-cash
- 9.67%
- DSCR
- 1.43
- GRM
- 5.4
CMA / ARV
No comps found within radius.
Projected returns pro-forma
-3.0% appreciation · 3.96% rent growth · sell at horizon
- IRR
- -0.1%
- Equity multiple
- 1.00×
- Total profit
- $-133
- Equity at exit
- $14,761
- IRR
- 10.9%
- Equity multiple
- 1.91×
- Total profit
- $25,226
- Equity at exit
- $8,560
Cash invested: $27,720 (down + closing). Projections, not guarantees.
Landlord ↔ Tenant lean methodology
- Overall (CITY)
- 0 Strongly Tenant-Friendly
- State District of Columbia
- 12 Strongly Tenant-Friendly · D+43
- County
- — inherits STATE
- City Washington
- 0 Strongly Tenant-Friendly · D+43
ZIP-level market 20032
- Home prices YoY
- -15.6%
- Rents YoY
- 4.0%
- Active inventory
- 145
- Price-to-rent
- 5.4×
Monthly cashflow live
- Estimated rent
- $1,520 high interval (Pro) →
- Mortgage (P&I)
- −$519
- Tax from tax record
- −$67 /mo · $803/yr
- Insurance
- −$41
- HOA
- −$350
- Vacancy / Maint / Mgmt
- −$319
- Net cashflow
- $223
Break-even live
UW: 25.0% down · 7.5% · 30yr · 1.5% tax · 5.0% vac · 8.0% maint · 8.0% mgmt
Financing live
Cash to close
- Down payment
- $24,750
- Closing costs
- $2,970
- Reserves months
- —
- Total cash needed
- —
Loan-product check · same deal, 3 products live
Conventional
25% down · 7.5% · 30yr
- Down + closing
- —
- Monthly P&I
- —
- Monthly cashflow
- —
- DSCR
- —
- Eligible?
- —
Personal DTI + credit; lowest rate.
DSCR
20% down · 8.5% · 30yr
- Down + closing
- —
- Monthly P&I
- —
- Monthly cashflow
- —
- DSCR
- —
- Eligible?
- —
No personal income docs; deal must DSCR.
Hard money
10% down · 12.0% · 12mo
- Down + closing
- —
- Monthly P&I
- —
- Monthly cashflow
- —
- DSCR
- —
- Eligible?
- —
Short-term bridge; refi at stabilization.
Rent comps 40 comps
| Address | Beds | Baths | Sqft | Rent | $/sqft | DOM | Units | Dist |
|---|---|---|---|---|---|---|---|---|
| 625 Chesapeake St SE #205 Washington, DC | 2.0 | 1.0 | 773 | $1,400 | $1.81 | 24d | 1 | 0.01mi |
| 625A Chesapeake St SE Unit 101 Washington, DC | 2.0 | 1.0 | 768 | $1,400 | $1.82 | 24d | 1 | 0.02mi |
| 701 Brandywine St SE #201 Washington, DC | 2.0 | 1.0 | 706 | $1,400 | $1.98 | 18d | 1 | 0.07mi |
| 705 Brandywine St SE #303 Washington, DC | 2.0 | 1.0 | 655 | $1,550 | $2.37 | 4d | 1 | 0.08mi |
| 713 Brandywine St SE Washington, DC | 2.0 | 1.0 | 707 | $1,650 | $2.33 | 24d | 1 | 0.10mi |
| 730 Brandywine St SE #104 Washington, DC | 2.0 | 1.0 | 683 | $1,350 | $1.98 | 24d | 1 | 0.15mi |
| 811 Barnaby St SE Washington, DC | 1.0 | 1.0 | 650 | $1,275 | $1.96 | 24d | 1 | 0.16mi |
| 811 Barnaby St SE Apt 101 Washington, DC | 2.0 | 1.0 | 750 | $1,449 | $1.93 | 24d | 1 | 0.16mi |
| 742 Brandywine St SE Washington, DC | 1.0 | 1.0 | 599 | $1,095 | $1.83 | 4d | 1 | 0.17mi |
| 808 Chesapeake St SE Washington, DC | 2.0 | 1.0 | 700 | $1,700 | $2.43 | 24d | 1 | 0.19mi |
| 820 Southern Ave SE Washington, DC | 2.0–3.0 | 1.0–1.5 | 840 | $1,450 | $1.73 | 2d | 65 | 0.21mi |
| 310 Atlantic St SE Unit 102B Washington, DC | 2.0 | 1.0 | 859 | $1,875 | $2.18 | 5d | 1 | 0.28mi |
| 310 Atlantic St SE Washington, DC | 1.0–2.0 | 1.0 | 754 | $1,875 | $2.49 | 4d | 2 | 0.28mi |
| 3929 4th St SE Unit 4 Washington, DC | 2.0 | 1.0 | 852 | $1,557 | $1.83 | 24d | 1 | 0.29mi |
| 306 Atlantic St SE Unit 7 Washington, DC | 2.0 | 1.0 | 989 | $1,699 | $1.72 | 18d | 1 | 0.30mi |
| 306 Atlantic St SE Unit 7 Washington, DC | 2.0 | 1.0 | 800 | $1,700 | $2.12 | 24d | 1 | 0.30mi |
| 4030 Livingston Rd SE Washington, DC | 2.0 | 1.0 | 1000 | $1,648 | $1.65 | 24d | 1 | 0.33mi |
| 4040 Livingston Rd SE Washington, DC | 2.0 | 1.0 | 1000 | $1,256 | $1.26 | 24d | 1 | 0.34mi |
| 607 Southern Ave SE Oxon Hill, MD | 2.0 | 1.0 | 900 | $1,199 | $1.33 | 20d | 1 | 0.35mi |
| 852 Barnaby St SE Washington, DC | 2.0–3.0 | 1.0–1.5 | 761 | $1,400 | $1.84 | 15d | 10 | 0.38mi |
| 3878 9th St SE Washington, DC | 3.0 | 1.0 | 789 | $2,000 | $2.53 | 24d | 1 | 0.41mi |
| 3868 9th St SE Washington, DC | 2.0 | 1.0 | 740 | $1,450 | $1.96 | 24d | 1 | 0.43mi |
| 4641 6th St SE Washington, DC | 1.0 | 1.0 | 650 | $1,275 | $1.96 | 24d | 1 | 0.46mi |
| 4632 Livingston Rd SE Washington, DC | 1.0–2.0 | 1.0 | 755 | $1,329 | $1.76 | 24d | 10 | 0.49mi |
| 3930 1st St SE Unit 301 Washington, DC | 3.0 | 1.0 | 900 | $2,200 | $2.44 | 24d | 1 | 0.50mi |
| 207 Mississippi Ave SE Washington, DC | 1.0–2.0 | 1.0–1.5 | 656 | $1,559 | $2.38 | 24d | 10 | 0.51mi |
| 21 Chesapeake St SE Washington, DC | 2.0 | 1.0 | 670 | $1,250 | $1.87 | 20d | 1 | 0.52mi |
| 39 Mississippi Ave SE Washington, DC | 2.0 | 1.0 | 800 | $1,300 | $1.62 | 24d | 1 | 0.56mi |
| 2 Elmira St SE Washington, DC | 1.0 | 1.0 | 710 | $1,342 | $1.89 | 24d | 1 | 0.58mi |
| 1311 Southview Dr Oxon Hill, MD | 2.0 | 1.0 | 628 | $1,754 | $2.79 | 2d | 64 | 0.59mi |
| 6 Galveston St SW #303 Washington, DC | 2.0 | 1.0 | 708 | $1,700 | $2.40 | 24d | 1 | 0.62mi |
| 4001 S Capitol St SW Washington, DC | 3.0 | 1.0–2.0 | 782 | $1,975 | $2.52 | 14d | 1 | 0.63mi |
| 3865 Halley Ter SE Washington, DC | 1.0 | 1.0 | 650 | $1,210 | $1.86 | 24d | 1 | 0.63mi |
| 4721 1st St SW #203 Washington, DC | 2.0 | 1.0 | 741 | $1,600 | $2.16 | 24d | 1 | 0.64mi |
| 4725 1st St SW #102 Washington, DC | 2.0 | 1.0 | 580 | $1,850 | $3.19 | 24d | 1 | 0.64mi |
| 101 Wayne Pl SE Washington, DC | 2.0 | 1.0 | 919 | $1,695 | $1.84 | 22d | 1 | 0.65mi |
| 4729 1st St SW #202 Washington, DC | 2.0 | 1.0 | 589 | $1,650 | $2.80 | 24d | 1 | 0.66mi |
| 10 Halley Pl SE Washington, DC | 2.0–3.0 | 1.0 | 906 | $1,250 | $1.38 | 24d | 3 | 0.68mi |
| 61 Forrester St SW Unit 104 Washington, DC | 2.0 | 1.0 | 639 | $1,700 | $2.66 | 24d | 1 | 0.69mi |
| 19 Galveston Pl SW #202 Washington, DC | 1.0 | 1.0 | 700 | $1,400 | $2.00 | 24d | 1 | 0.69mi |
HOA detail condo
- Monthly dues
- $350 · $4,200/yr
- Likely covers
- parking
- Assessments
- None detected in remarks — confirm with the listing agent.
Listing history 31 events
-
2026-06-18days on market $99,000 Active 54 DOM
-
2026-06-17days on market $99,000 Active 53 DOM
-
2026-06-16days on market $99,000 Active 52 DOM
-
2026-06-15days on market $99,000 Active 51 DOM
-
2026-06-13days on market $99,000 Active 49 DOM
-
2026-06-09days on market $99,000 Active 45 DOM
-
2026-06-08days on market $99,000 Active 44 DOM
-
2026-06-07pricedays on market $99,000 Active 43 DOM
-
2026-06-04days on market $105,000 Active 40 DOM
-
2026-06-03days on market $105,000 Active 39 DOM
-
2026-06-02days on market $105,000 Active 38 DOM
-
2026-06-01days on market $105,000 Active 37 DOM
-
2026-05-31days on market $105,000 Active 36 DOM
-
2026-04-25$105,000 Active
-
2026-04-24historical
-
2026-04-16status Active
-
2026-02-02status Pending
-
2026-01-01status Active
-
2026-01-01historical
-
2026-01-01$105,000 Active
-
2025-12-24historical
-
2025-12-01historical
-
2025-11-18price $109,900
-
2025-09-24status Active
-
2025-09-21historical
-
2025-08-18price $115,000
-
2025-08-18$315,000 Active
-
2009-09-28historical
-
2009-09-28historical
-
2009-06-27
-
2009-06-27$155,000
ⓘ Source: listings_history table (triggers on properties + properties_extension) + one-shot
backfill from property_details.listing_events for pre-trigger history.
Tax reassessment forecast DC · Partial reset (capped growth)
- Current annual tax
- $803 · $67/mo
- Projected year-2 tax
- $803 · $67/mo
- Expected delta
- $0/yr ($0/mo · 0.0%)
ⓘ Screening estimate from a state-policy table — verify with the county assessor before closing.
Climate risk First Street
- Flood 1/10 Low FEMA zone X (unshaded) · 0% chance over 30 yrs
- Wildfire 3/10 Moderate
- Heat 8/10 Severe 7 d/yr ≥104°F today · 16 d/yr by 30 yrs out
- Wind 4/10 Moderate 17% chance of damaging wind over 30 yrs
- Air quality 3/10 Moderate 2 unhealthy d/yr today · 3 by 30 yrs out
Nearby sold comps map
Loading sold comps map…
Walkable amenities ~0.75 mi
Loading nearby amenities…
Taxation est. · year 1
- Rental income
- $18,238
- − Mortgage interest
- −$5,546
- − Property taxes
- −$803
- − Insurance
- −$495
- − Repairs & maintenance
- −$1,459
- − Management
- −$1,459
- − HOA
- −$4,200
- − Depreciation
- −$2,880
- Taxable income
- $1,396
- Est. tax owed @ 24.0%
- −$335
- After-tax cash flow
- $2,345/yr
For passive investors: Depreciation is non-cash, so a rental often shows a tax loss while cash-flowing — sheltering income. Rental losses are passive: they offset passive income freely, and up to $25,000/yr can offset ordinary (W-2) income if you actively participate and your MAGI is under $100k (phasing out to $0 by $150k); unused losses carry forward. On sale, claimed depreciation is recaptured at up to 25%, and gains may owe capital-gains tax (a 1031 exchange can defer both). Figures are a year-1 estimate at your 24.0% rate — not tax advice; consult a CPA.
Schools (NCES district)
- District
- District Of Columbia Public Schools
- NCES district ID
- 1100030
- Math proficiency
- 33% ▲ 3.00%
- Reading proficiency
- 40% ▲ 5.00%
- Median HH income
- $67,671
- Composite
- 35.84/100
- National rank
- #9606
- State rank
- #8 of 32 in DC
Livability — Washington
- Score
- 73/100
- State rank
- #1
- US rank
- #5327
Category grades
Schools grade is shown separately in the Schools card above.
Census & demographics
- Census place
- Washington, DC
- County
- District of Columbia · 671,873 people
- City population
- 671,873
- Metro
- Washington-Arlington-Alexandria, DC-VA-MD-WV
- Population (ZIP)
- 40,920
- Household income
- $49,139
- Rent vs Own
- Severe rent burden
- 4530.0
Population outlook (District of Columbia County) Hauer SSP2
- Today (2025)
- 821,926 people
- By 2030
- 899,517 · +9.4%
- By 2040
- 1,061,162 · +29.1%
- By 2050
- 1,231,493 · +49.8%
- By 2075
- 1,603,312 · +95.1%
- By 2100
- 1,847,141 · +124.7%
Race, ethnicity, and origin ACS 2023
- Neighborhood character
- Predominantly Black (80%)
- Race & ethnicity
- Black 80% White 8% Two or more races 7% Hispanic / Latino 5%
- Foreign-born
- 4% · Canada
- Languages at home
- 95% English-only · Spanish 3%
Political lean MEDSL · District of Columbia
- 2024 margin
- Solid D (+86.1) · D 91.2% · R 5.1% · Other 3.8%
- 2008→2024 swing
- +0.1pp no change · 2008: 85.9pp · 2024: 86.1pp
- All cycles
- 2024: D+86.1 2020: D+86.8 2016: D+88.7 2012: D+84.2 2008: D+85.9
Not yet ingested
- Civics
- —
Market trends
- HPI YoY
- ▼ -60.34%
- Current HPI
- 326.4077
- Rent YoY
- ▲ 3.96%
- Metro
- Washington-Arlington-Alexandria, DC-VA-MD-WV
- State GDP YoY
- ▲ 1.33%
- F500 in state
- 6
Industry mix (Fortune 500 HQ in DC)
| Industry | F500 HQs | Revenue |
|---|---|---|
| Financial Services | 1 | $153B |
|
||
| Life Sciences / Industrials | 1 | $25B |
|
||
| Industrial Machinery | 1 | $8B |
|
||
Price history
-32.3% since first listed18 events — show timeline
- 2026-04-25 Listed $105,000 BRIGHT MLS
- 2026-04-24 Listing Removed — BRIGHT MLS
- 2026-04-16 Relisted — BRIGHT MLS
- 2026-02-02 Pending — BRIGHT MLS
- 2026-01-01 Relisted — BRIGHT MLS
- 2026-01-01 Listing Removed — BRIGHT MLS
- 2026-01-01 Listed $105,000 BRIGHT MLS
- 2025-12-24 Coming Soon — BRIGHT MLS
- 2025-12-01 Listing Removed — BRIGHT MLS
- 2025-11-18 Price Changed $109,900 BRIGHT MLS
- 2025-09-24 Relisted — BRIGHT MLS
- 2025-09-21 Listing Removed — BRIGHT MLS
- 2025-08-18 Price Changed $115,000 BRIGHT MLS
- 2025-08-18 Listed $315,000 BRIGHT MLS
- 2009-09-28 Delisted — MRIS
- 2009-09-28 Listing Removed — BRIGHT MLS
- 2009-06-27 Listed — MRIS
- 2009-06-27 Listed $155,000 BRIGHT MLS
Property tax history
+5.0%/yrLatest (2025): $803 · +1.1% YoY. Source: county tax records.
Cash-flow waterfall
monthlySold comps — $/sqft
last 12 mo · ≤1 miLoading sold comps…