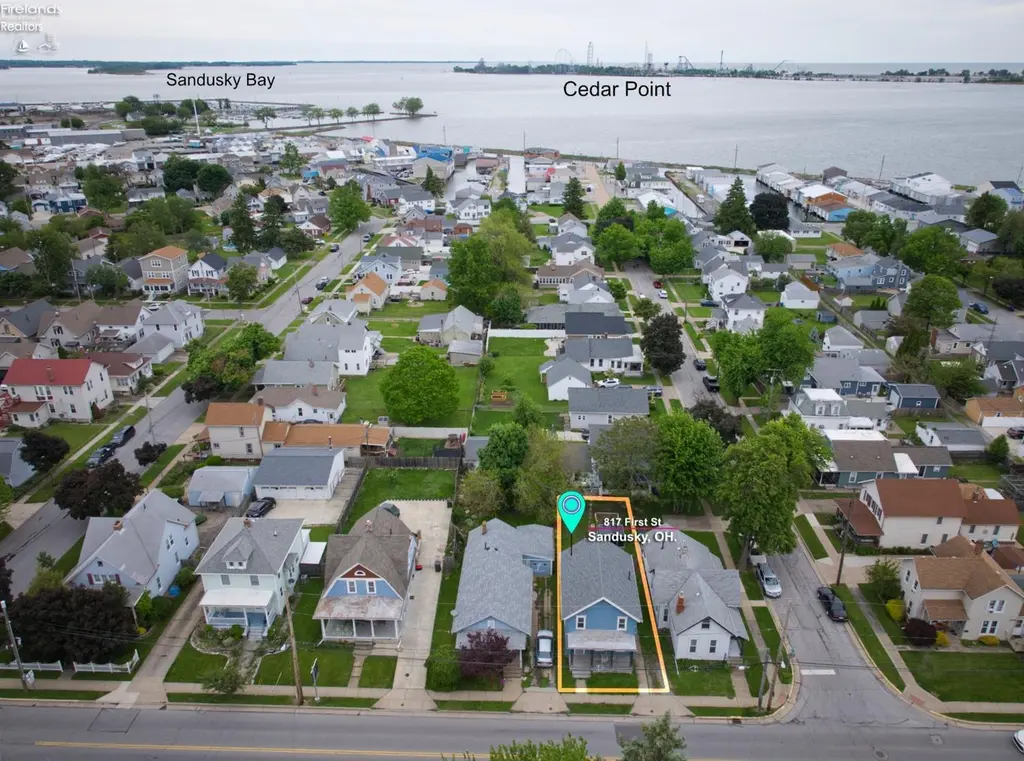
817 1st St · Sandusky, OH
Flood risk 1/10 · Minimal
- FEMA flood zone
- X (unshaded)
- Chance of flooding over 30 yrs
- 0.0%
- Est. flood insurance / yr
- $473 – $860
Fire risk 1/10 · Minimal
- Est. fire insurance / yr
- $713 – $1,323
Heat risk 3/10 · Minor
- Hot days now (above 94°F)
- 7 days/yr
- Hot days in 30 yrs
- 16 days/yr
Wind risk 2/10 · Minimal
- Chance of severe wind over 30 yrs
- —
Air-quality risk 3/10 · Minor
- Unhealthy air days now
- 2 days/yr
- Unhealthy air days in 30 yrs
- 3 days/yr
Risk factors via First Street. Map © Google.
Why this score? — see what drove the D grade
The composite is a weighted blend of 9 inputs, each scored 0–100. Each bar is that input's sub-score; the figure is the points it added to the 100-point composite (weight × sub-score).
- Cash flow +15.0/30.0
- ARV discount +7.5/15.0
- 1% rule +5.0/10.0
- DSCR +5.0/10.0
- Livability +4.2/5.0
- Rent growth +2.5/5.0
- Schools +2.5/10.0
- Condition / age +2.5/5.0
- Appreciation +0.0/10.0
$72,000
🖨 Deal sheet 📄 Offer letter ✓ Due diligence
Listing remarks
Just blocks from Lake Erie and located within Sandusky's desirable short-term rental district, this property is an incredible opportunity for investors. The demo has already been completed, which will save time and money. This is a true blank canvas ready to be transformed into a money-producing Lake Erie getaway. LEAD ABATEMENT DONE IN 2021!ROOF APPROXIMATELY 8 YEARS OLD!✔️ Airbnb/VRBO-friendly district✔️ Just blocks from Lake Erie✔️ Minutes from Cedar Point, ferries, marinas, downtown Sandusky, and restaurants✔️ Endless opportunity to create a custom vacation rental experience✔️ Strong income-producing potential with the right vision and finishes✔️ Ideal for investors, flippers, or short-
Key facts
- Lake erie getaway
- 3,202 sq ft lot
- Built 1933
Tags
Property features AI
Finance
- Other: Located in the Huntington & Andersons subdivision
Exterior
- Parking: Off-street parking
- Utilities: Public water; Public sewer
- Home design: Single-family residential property
- Construction: Aluminum siding exterior; Asphalt roof
- Exterior features: Asphalt roof; Aluminum siding; Lot approximately 0.0735 acres
Interior
- Bathrooms: 2 full bathrooms
- Heating & cooling: Natural gas forced-air heating
- Interior features: Full basement
Neighborhood map
What this means for you Summary
Snapshot
- This is a 4-bed/1.5-bath single-family listed at $72k.
Deal economics
- At list price, monthly cash flow is $2k ($23k/yr) — positive.
- The deal already cash-flows at list — no discount required.
- Meets the 1% rule at list price ($3k rent vs $72k).
- Cap rate 38.1% vs local median 5.4% in Sandusky — top-decile yield for the area; either an underpriced asset or a hidden risk that comps aren't pricing in. Stress-test before assuming the spread holds.
Location & tenants
- Location reads 83/100 on livability (#63 in OH, #929 nationally) — a professional / high-income tenant draw. Strengths: commute A+, cost of living A+, housing A+; Watch: crime D-, employment F.
- Sandusky City (town): math 24% / reading 37% proficiency, ranked #583 of 656 in OH (top 89%) — families likely to look elsewhere, expect single-tenant / working-renter base with shorter leases; 71% free/reduced lunch — lower-income household profile, screen leases tightly.
- Market conditions: 209 active listings in the ZIP; 2 comparable units currently listed for rent nearby; 128 units permitted in Erie County in 2024 (5 in 5+ unit buildings).
- At $3,069/mo this rent would consume 59% of the median local household income ($62k/yr) (locally 1602% of renters already pay >50% of income on rent) — very limited rent-growth headroom before tenants either downsize or default.
Forward outlook
- Local home prices are declining (-3.0%/yr); year-one equity from $498 of loan paydown is wiped out by about $2k of value loss. Plan a longer hold.
- Erie County population projected at -15% by 2050 — secular population decline; favor cash flow + early exit over multi-decade hold.
- At projected returns (-3.0% appreciation + 3.0% rent growth), your $20k cash investment doubles in ~1 year — after that, you're playing with house money.
Negotiation context
- Only 5 days on market — expect competitive offers; lowballing is unlikely to land.
Risks & watch-outs
- Watch-outs: built in 1933 — expect roof / HVAC / electrical / plumbing capex.
Questions for the listing agent
- Built in 1933 — when were the roof, HVAC, electrical panel, plumbing, and water heater last replaced?
- Is there a deadline driving the sale (1031 exchange, divorce, estate, relocation)? That informs how much negotiation room exists.
- Crime grade is D in this area — have there been break-ins, vandalism, or insurance claims at this property in the last 3 years? What carrier currently insures it and at what premium?
- The area grade is low — what's the realistic commute time and amenity access for the typical tenant pool here? Any planned neighborhood developments (good or bad) we should know about?
- What's the average days-on-market for RENTAL listings here right now (not sales)? A rising rental-DOM trend means longer vacancies and softer asking-rent achievability than the comps imply.
- What's the recent tenant-quality profile in this submarket — average credit score on applications, eviction rate, late-payment / NSF rate, and stable-employment percentage? A property-management company in the area should have these aggregated.
- How much new for-sale + rental construction is in the pipeline within 1–3 miles? Heavy new supply typically softens prices + rents 12–24 months out; constrained supply supports both.
Investment metrics
- 1% rule
- 4.26% ✓
- Cap rate
- 38.15%
- Cash-on-cash
- 113.76%
- DSCR
- 6.06
- GRM
- 2.0
CMA / ARV
- ARV (on-the-fly)
- $155,736
- Comps found
- 12
Show comp detail 12 sales within ~0.75 mi
| Address | Dist | Beds/Ba | Sqft | Sold | Price | $/sf | Match |
|---|---|---|---|---|---|---|---|
| 522 E Jefferson St | 0.28mi | 3/2.0 (-1) | 1,547 (+2%) | 4mo | $50,000 | $32 | 73 |
| 1130 Fourth St | 0.32mi | 4/2.0 | 1,589 (+5%) | 3mo | $140,000 | $88 | 72 |
| 604 E Jefferson St | 0.25mi | 4/1.5 | 1,400 (-7%) | 7mo | $143,900 | $103 | 70 |
| 919 Hancock St | 0.46mi | 3/1.0 (-1) | 1,426 (-6%) | 3mo | $72,000 | $50 | 60 |
| 318 High St | 0.75mi | 4/2.0 | 1,532 (+1%) | 3mo | $185,000 | $121 | 58 |
| 1002 Sycamore Line | 0.21mi | 3/1.0 (-1) | 1,288 (-15%) | 3mo | $140,000 | $109 | 56 |
| 623 E Market St | 0.52mi | 3/2.0 (-1) | 1,448 (-4%) | 9mo | $90,000 | $62 | 54 |
| 1111 Erie St | 0.33mi | 3/1.5 (-1) | 1,344 (-11%) | 9mo | $175,000 | $130 | 54 |
| 1104 Waverly Rd | 0.47mi | 3/1.0 (-1) | 1,336 (-12%) | 7mo | $180,000 | $135 | 46 |
| 914 Hayes Ave | 0.65mi | 3/1.0 (-1) | 1,320 (-13%) | 1mo | $133,000 | $101 | 41 |
| 817 Hayes Ave | 0.64mi | 3/2.5 (-1) | 1,721 (+14%) | 5mo | $179,900 | $105 | 34 |
| 205 W Madison St. St | 0.68mi | 3/1.0 (-1) | 1,726 (+14%) | 8mo | $104,900 | $61 | 31 |
Match score weights: distance 35% · size 25% · config 20% · recency 20%. Top-matched comps best support the ARV.
Projected returns pro-forma
-3.0% appreciation · 3.0% rent growth · sell at horizon
- IRR
- —
- Equity multiple
- 6.46×
- Total profit
- $110,118
- Equity at exit
- $10,735
- IRR
- —
- Equity multiple
- 13.54×
- Total profit
- $252,861
- Equity at exit
- $6,225
Cash invested: $20,160 (down + closing). Projections, not guarantees.
Landlord ↔ Tenant lean methodology
- Overall (STATE)
- 73 Landlord-Friendly
- State Ohio
- 73 Landlord-Friendly · R+6
- County
- — inherits STATE
- City
- — inherits STATE
ZIP-level market 44870
- Active inventory
- 209
- Price-to-rent
- 2.0×
Monthly cashflow live
- Estimated rent
- $3,069 medium interval (Pro) →
- Mortgage (P&I)
- −$378
- Tax from tax record
- −$106 /mo · $1,270/yr
- Insurance
- −$30
- HOA
- −$0
- Vacancy / Maint / Mgmt
- −$645
- Net cashflow
- $1,911
Break-even live
UW: 25.0% down · 7.5% · 30yr · 1.5% tax · 5.0% vac · 8.0% maint · 8.0% mgmt
Financing live
Cash to close
- Down payment
- $18,000
- Closing costs
- $2,160
- Reserves months
- —
- Total cash needed
- —
Loan-product check · same deal, 3 products live
Conventional
25% down · 7.5% · 30yr
- Down + closing
- —
- Monthly P&I
- —
- Monthly cashflow
- —
- DSCR
- —
- Eligible?
- —
Personal DTI + credit; lowest rate.
DSCR
20% down · 8.5% · 30yr
- Down + closing
- —
- Monthly P&I
- —
- Monthly cashflow
- —
- DSCR
- —
- Eligible?
- —
No personal income docs; deal must DSCR.
Hard money
10% down · 12.0% · 12mo
- Down + closing
- —
- Monthly P&I
- —
- Monthly cashflow
- —
- DSCR
- —
- Eligible?
- —
Short-term bridge; refi at stabilization.
Rent comps 2 comps
| Address | Beds | Baths | Sqft | Rent | $/sqft | DOM | Units | Dist |
|---|---|---|---|---|---|---|---|---|
| 1107 1st St Unit 1496057P Sandusky, OH | 4.0 | 3.0 | 1151 | $6,631 | $5.76 | 44d | 1 | 0.19mi |
| 1032 Perry St Sandusky, OH | 4.0 | 2.5 | 1845 | $850 | $0.46 | 44d | 1 | 0.24mi |
Listing history 4 events
-
2026-06-01status $72,000 Pending 5 DOM
-
2026-05-31days on market $72,000 Active 5 DOM
-
2026-05-30days on market $72,000 Active 4 DOM
-
2026-05-26$72,000 Active
ⓘ Source: listings_history table (triggers on properties + properties_extension) + one-shot
backfill from property_details.listing_events for pre-trigger history.
Tax reassessment forecast OH · Partial reset (capped growth)
- Current annual tax
- $1,270 · $106/mo
- Projected year-2 tax
- $1,270 · $106/mo
- Expected delta
- $0/yr ($0/mo · 0.0%)
ⓘ Screening estimate from a state-policy table — verify with the county assessor before closing.
Climate risk First Street
- Flood 1/10 Low FEMA zone X (unshaded) · 0% chance over 30 yrs
- Wildfire 1/10 Low
- Heat 3/10 Moderate 7 d/yr ≥94°F today · 16 d/yr by 30 yrs out
- Wind 2/10 Low
- Air quality 3/10 Moderate 2 unhealthy d/yr today · 3 by 30 yrs out
Nearby sold comps map
Loading sold comps map…
Walkable amenities ~0.75 mi
Loading nearby amenities…
Taxation est. · year 1
- Rental income
- $36,830
- − Mortgage interest
- −$4,033
- − Property taxes
- −$1,270
- − Insurance
- −$360
- − Repairs & maintenance
- −$2,946
- − Management
- −$2,946
- − Depreciation
- −$2,095
- Taxable income
- $23,180
- Est. tax owed @ 24.0%
- −$5,563
- After-tax cash flow
- $17,372/yr
For passive investors: Depreciation is non-cash, so a rental often shows a tax loss while cash-flowing — sheltering income. Rental losses are passive: they offset passive income freely, and up to $25,000/yr can offset ordinary (W-2) income if you actively participate and your MAGI is under $100k (phasing out to $0 by $150k); unused losses carry forward. On sale, claimed depreciation is recaptured at up to 25%, and gains may owe capital-gains tax (a 1031 exchange can defer both). Figures are a year-1 estimate at your 24.0% rate — not tax advice; consult a CPA.
Schools (NCES district)
- District
- Sandusky City
- NCES district ID
- 3904474
- Math proficiency
- 24% ▼ -17.00%
- Reading proficiency
- 37% ▼ -9.00%
- Median HH income
- $34,583
- Composite
- 25.1/100
- National rank
- #7532
- State rank
- #583 of 656 in OH
Livability — Sandusky
- Score
- 83/100
- State rank
- #63
- US rank
- #929
Category grades
Schools grade is shown separately in the Schools card above.
Census & demographics
- Census place
- Sandusky, OH
- County
- Erie County · 39,883 people
- City population
- 39,883
- Metro
- Sandusky, OH
- Population (ZIP)
- 39,883
- Household income
- $62,082
- Rent vs Own
- Severe rent burden
- 1602.0
Population outlook (Erie County) Hauer SSP2
- Today (2025)
- 73,204 people
- By 2030
- 71,341 · -2.5%
- By 2040
- 66,771 · -8.8%
- By 2050
- 62,512 · -14.6%
- By 2075
- 56,154 · -23.3%
- By 2100
- 49,045 · -33.0%
Race, ethnicity, and origin ACS 2023
- Neighborhood character
- Predominantly White (72%)
- Race & ethnicity
- White 72% Black 15% Two or more races 8% Hispanic / Latino 5%
- Common ancestry
- Romanian 3% Slovak 2% Subsaharan African 1%
- Foreign-born
- 1% · Canada
- Languages at home
- 96% English-only · Spanish 2%
Political lean MEDSL · Erie
- 2024 margin
- R (+14.1) · D 42.5% · R 56.6%
- 2008→2024 swing
- -28.0pp toward R · 2008: 13.9pp · 2024: -14.1pp
- All cycles
- 2024: R+14.1 2020: R+11.6 2016: R+9.8 2012: D+11.3 2008: D+13.9
Not yet ingested
- Civics
- —
Market trends
- HPI YoY
- ▼ -151.99%
- Current HPI
- 209.6383
- Rent YoY
- —
- Metro
- Sandusky, OH
- State GDP YoY
- ▲ 1.98%
- F500 in state
- 48
Industry mix (Fortune 500 HQ in OH)
| Industry | F500 HQs | Revenue |
|---|---|---|
| Insurance | 3 | $145B |
|
||
| Industrial Machinery | 3 | $49B |
|
||
| Financial Services | 3 | $24B |
|
||
| Consumer Goods | 2 | $93B |
|
||
| Aerospace / Defense | 2 | $47B |
|
||
| Utilities | 2 | $33B |
|
||
Price history
1 event — show timeline
- 2026-05-26 Listed $72,000 FAOR
Property tax history
+11.4%/yrLatest (2025): $1,270 · -1.0% YoY. Source: county tax records.
Cash-flow waterfall
monthlySold comps — $/sqft
last 12 mo · ≤1 miLoading sold comps…