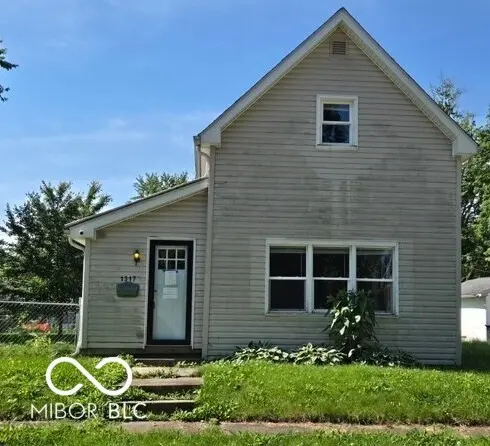
1317 Cottage Ave · Middletown, IN
Flood risk 1/10 · Minimal
- FEMA flood zone
- X (unshaded)
- Chance of flooding over 30 yrs
- 0.0%
- Est. flood insurance / yr
- $473 – $860
Fire risk 1/10 · Minimal
- Est. fire insurance / yr
- $717 – $1,331
Heat risk 3/10 · Minor
- Hot days now (above 99°F)
- 7 days/yr
- Hot days in 30 yrs
- 18 days/yr
Wind risk 2/10 · Minimal
- Chance of severe wind over 30 yrs
- 1.0%
Air-quality risk 3/10 · Minor
- Unhealthy air days now
- 2 days/yr
- Unhealthy air days in 30 yrs
- 4 days/yr
Risk factors via First Street. Map © Google.
Why this score? — see what drove the C grade
The composite is a weighted blend of 9 inputs, each scored 0–100. Each bar is that input's sub-score; the figure is the points it added to the 100-point composite (weight × sub-score).
- Cash flow +19.6/30.0
- ARV discount +15.0/15.0
- DSCR +6.2/10.0
- 1% rule +4.3/10.0
- Schools +3.6/10.0
- Livability +3.4/5.0
- Rent growth +2.5/5.0
- Condition / age +2.5/5.0
- Appreciation +0.0/10.0
$125,000
🖨 Deal sheet 📄 Offer letter ✓ Due diligence
Listing remarks MLS
This home is ready for a handyman family to come in and make it just the way they want it. The home is located just down the street from a park for the kids, has 3 bedrooms and a large detached garage. The fenced in backyard is great for pets and the large living areas make it easy to spread out.
Key facts
- 9,148 sq ft lot
- 2 garage spots
- Built 1972
Property features AI
Exterior
- Parking: Detached garage (2-car); Guest street parking available
- Utilities: Public water; Municipal sewer connected; Electricity connected; Natural gas available; Cable available
- Home design: Single-family residence; Updated/remodeled condition; One-and-a-half story home; North-facing
- Construction: Vinyl siding construction; Block foundation with crawl space; Partial, unfinished basement with storage space
- Exterior features: Full fencing (yard fenced); City lot with sidewalk access; Lot about 0.21 acres
Interior
- Kitchen: Eat-in kitchen (approx. 13x12)
- Bedrooms: Three bedrooms total (two on the main level, one on the upper level); Bedroom sizes include 15x11 (upper), 15x7 (main), and 12x11 (main)
- Flooring: Hardwood floors
- Bathrooms: Two full bathrooms (one on the main level, one on the upper level); Primary bathroom described as bath/half
- Heating & cooling: Forced air heating (natural gas); Central air conditioning
- Interior features: Attic access; High ceilings; Hardwood floors; Eat-in kitchen; Laundry in unit
- Laundry & utility: Laundry located in unit on the main level (room approx. 15x6)
Neighborhood map
What this means for you Summary
Snapshot
- This is a 3-bed/1.5-bath single-family listed at $125k.
Deal economics
- At list price, monthly cash flow is $145 ($2k/yr) — positive.
- The deal already cash-flows at list — no discount required.
- To meet the 1% rule (rent ≥ 1% of price), the offer needs to be $116k (7.2% below list).
- Recommended offer: $116k (7.2% below list) — sets the bar for 1% rule.
- Cap rate 7.7% vs local median 5.2% in Middletown — top-decile yield for the area; either an underpriced asset or a hidden risk that comps aren't pricing in. Stress-test before assuming the spread holds.
Location & tenants
- Location reads 67/100 on livability (#235 in IN) — a middle-class / working-renter tenant base. Strengths: crime A+, cost of living A+, housing A+; Watch: amenities F, commute F, health & safety F.
- Shenandoah School Corporation (rural): math 38% / reading 46% proficiency, ranked #118 of 301 in IN (top 39%) — families likely to look elsewhere, expect single-tenant / working-renter base with shorter leases.
- Zoned schools: Shenandoah Elementary School (math 48% / reading 49%, grade D, #304 of 994 statewide, top 31%, 624 students, 46% FRL); Shenandoah High School (math 42% / reading 72%, grade C, #64 of 369 statewide, top 18%, 410 students, 40% FRL).
- Market conditions: 35 active listings in the ZIP; 1 comparable units currently listed for rent nearby; 47 units permitted in Henry County in 2024 (0 in 5+ unit buildings).
Forward outlook
- Local home prices are declining (-3.0%/yr); year-one equity from $864 of loan paydown is wiped out by about $4k of value loss. Plan a longer hold.
- Henry County population projected at -12% by 2050 — secular population decline; favor cash flow + early exit over multi-decade hold.
Negotiation context
- It's been on market 22 days — a 2% lower offer ($123k) is reasonable based on typical stale-listing flexibility.
- 7 sale attempts since 26y ago with the ask held roughly flat each time — persistent listings suggest the price (not the market) is what's stuck; bring a comps-based counter.
- Current owner paid $85k; 47% above their basis — modest negotiation headroom, anchor on the comps not their cost.
Questions for the listing agent
- Built in 1972 — when were the roof, HVAC, electrical panel, plumbing, and water heater last replaced?
- Is there a deadline driving the sale (1031 exchange, divorce, estate, relocation)? That informs how much negotiation room exists.
- What's the average days-on-market for RENTAL listings here right now (not sales)? A rising rental-DOM trend means longer vacancies and softer asking-rent achievability than the comps imply.
- What's the recent tenant-quality profile in this submarket — average credit score on applications, eviction rate, late-payment / NSF rate, and stable-employment percentage? A property-management company in the area should have these aggregated.
- How much new for-sale + rental construction is in the pipeline within 1–3 miles? Heavy new supply typically softens prices + rents 12–24 months out; constrained supply supports both.
Investment metrics
- 1% rule
- 0.93% ✗
- Cap rate
- 7.68%
- Cash-on-cash
- 4.96%
- DSCR
- 1.22
- GRM
- 9.0
CMA / ARV
- ARV (on-the-fly)
- $174,528
- Comps found
- 12
Show comp detail 12 sales within ~0.75 mi
| Address | Dist | Beds/Ba | Sqft | Sold | Price | $/sf | Match |
|---|---|---|---|---|---|---|---|
| 1190 Cottage Ave | 0.14mi | 3/2.0 | 1,506 (-7%) | 2mo | $158,900 | $106 | 78 |
| 1485 Locust St | 0.16mi | 3/1.0 | 1,699 (+5%) | 7mo | $194,000 | $114 | 76 |
| 1256 Locust St | 0.07mi | 4/2.0 (+1) | 1,547 (-4%) | 10mo | $129,900 | $84 | 74 |
| 309 N 8th St | 0.52mi | 3/1.0 | 1,615 (-0%) | 5mo | $55,000 | $34 | 70 |
| 993 High St | 0.27mi | 3/2.0 | 1,506 (-7%) | 11mo | $204,000 | $135 | 65 |
| 511 N 12th St | 0.37mi | 3/2.0 | 1,764 (+9%) | 8mo | $254,900 | $145 | 58 |
| 1144 Cottage Ave | 0.16mi | 3/1.0 | 1,852 (+15%) | 10mo | $160,000 | $86 | 58 |
| 829 High St | 0.44mi | 3/1.0 | 1,486 (-8%) | 8mo | $138,400 | $93 | 58 |
| 127 N 8th St | 0.49mi | 2/1.0 (-1) | 1,678 (+4%) | 10mo | $165,000 | $98 | 56 |
| 8130 N Mechanicsburg Rd | 0.64mi | 3/1.5 | 1,680 (+4%) | 12mo | $265,000 | $158 | 53 |
| 602 Liberty St | 0.69mi | 3/2.0 | 1,632 (+1%) | 13mo | $200,000 | $123 | 53 |
| 553 Liberty St | 0.72mi | 2/1.0 (-1) | 1,503 (-7%) | 8mo | $163,000 | $108 | 41 |
Match score weights: distance 35% · size 25% · config 20% · recency 20%. Top-matched comps best support the ARV.
Projected returns pro-forma
-3.0% appreciation · 3.0% rent growth · sell at horizon
- IRR
- -8.6%
- Equity multiple
- 0.68×
- Total profit
- $-11,081
- Equity at exit
- $18,638
- IRR
- 0.8%
- Equity multiple
- 1.06×
- Total profit
- $2,056
- Equity at exit
- $10,808
Cash invested: $35,000 (down + closing). Projections, not guarantees.
Landlord ↔ Tenant lean methodology
- Overall (STATE)
- 90 Strongly Landlord-Friendly
- State Indiana
- 90 Strongly Landlord-Friendly · R+11
- County
- — inherits STATE
- City
- — inherits STATE
ZIP-level market 47356
- Home prices YoY
- -18.9%
- Active inventory
- 35
- Price-to-rent
- 9.0×
Monthly cashflow live
- Estimated rent
- $1,160 medium interval (Pro) →
- Mortgage (P&I)
- −$656
- Tax from tax record
- −$64 /mo · $770/yr
- Insurance
- −$52
- HOA
- −$0
- Vacancy / Maint / Mgmt
- −$244
- Net cashflow
- $145
Break-even live
UW: 25.0% down · 7.5% · 30yr · 1.5% tax · 5.0% vac · 8.0% maint · 8.0% mgmt
Financing live
Cash to close
- Down payment
- $31,250
- Closing costs
- $3,750
- Reserves months
- —
- Total cash needed
- —
Loan-product check · same deal, 3 products live
Conventional
25% down · 7.5% · 30yr
- Down + closing
- —
- Monthly P&I
- —
- Monthly cashflow
- —
- DSCR
- —
- Eligible?
- —
Personal DTI + credit; lowest rate.
DSCR
20% down · 8.5% · 30yr
- Down + closing
- —
- Monthly P&I
- —
- Monthly cashflow
- —
- DSCR
- —
- Eligible?
- —
No personal income docs; deal must DSCR.
Hard money
10% down · 12.0% · 12mo
- Down + closing
- —
- Monthly P&I
- —
- Monthly cashflow
- —
- DSCR
- —
- Eligible?
- —
Short-term bridge; refi at stabilization.
Rent comps 1 comps
| Address | Beds | Baths | Sqft | Rent | $/sqft | DOM | Units | Dist |
|---|---|---|---|---|---|---|---|---|
| 5 S Crestwood Dr Middletown, IN | 3.0 | 2.0 | 1216 | $1,160 | $0.95 | 2d | 1 | 0.73mi |
Listing history 37 events
-
2026-06-19days on market $125,000 Active 22 DOM
-
2026-06-18days on market $125,000 Active 21 DOM
-
2026-06-17days on market $125,000 Active 20 DOM
-
2026-06-16days on market $125,000 Active 19 DOM
-
2026-06-15days on market $125,000 Active 18 DOM
-
2026-06-14days on market $125,000 Active 16 DOM
-
2026-06-12remarks 546-char remark
-
2026-06-12days on market $125,000 Active 15 DOM
-
2026-06-09days on market $125,000 Active 12 DOM
-
2026-06-08days on market $125,000 Active 11 DOM
-
2026-06-07days on market $125,000 Active 10 DOM
-
2026-06-05days on market $125,000 Active 7 DOM
-
2026-06-03days on market $125,000 Active 6 DOM
-
2026-06-02days on market $125,000 Active 5 DOM
-
2026-06-01days on market $125,000 Active 4 DOM
-
2026-05-31days on market $125,000 Active 3 DOM
-
2026-05-30days on market $125,000 Active 2 DOM
-
2026-05-27$125,000 Active
-
2025-04-21historical
-
2025-01-13price $130,000
-
2025-01-09price $140,000
-
2024-12-21price $150,000
-
2024-11-06price $159,900
-
2024-10-24$164,900 Active
-
2022-07-01soldstatus $84,900
-
2022-06-30soldstatus $84,900 Closed 297-char remark
Show marketing remark (297 chars)
This home is ready for a handyman family to come in and make it just the way they want it. The home is located just down the street from a park for the kids, has 3 bedrooms and a large detached garage. The fenced in backyard is great for pets and the large living areas make it easy to spread out.
-
2022-05-29historical 297-char remark
Show marketing remark (297 chars)
This home is ready for a handyman family to come in and make it just the way they want it. The home is located just down the street from a park for the kids, has 3 bedrooms and a large detached garage. The fenced in backyard is great for pets and the large living areas make it easy to spread out.
-
2022-05-27$84,900 297-char remark
Show marketing remark (297 chars)
This home is ready for a handyman family to come in and make it just the way they want it. The home is located just down the street from a park for the kids, has 3 bedrooms and a large detached garage. The fenced in backyard is great for pets and the large living areas make it easy to spread out.
-
2015-04-13soldstatus $49,900
-
2015-04-13soldstatus $49,900
-
2015-02-24$49,900
-
2015-02-24$49,900
-
2008-09-05soldstatus $13,000
-
2008-05-12soldstatus $68,664
-
2008-04-29$19,900
-
2001-02-22soldstatus $59,900
-
2000-11-18$59,900
ⓘ Source: listings_history table (triggers on properties + properties_extension) + one-shot
backfill from property_details.listing_events for pre-trigger history.
Tax reassessment forecast IN · Partial reset (capped growth)
- Current annual tax
- $770 · $64/mo
- Projected year-2 tax
- $916 · $76/mo
- Expected delta
- +$146/yr (+$12/mo · 19.0%)
ⓘ Screening estimate from a state-policy table — verify with the county assessor before closing.
Climate risk First Street
- Flood 1/10 Low FEMA zone X (unshaded) · 0% chance over 30 yrs
- Wildfire 1/10 Low
- Heat 3/10 Moderate 7 d/yr ≥99°F today · 18 d/yr by 30 yrs out
- Wind 2/10 Low 100% chance of damaging wind over 30 yrs
- Air quality 3/10 Moderate 2 unhealthy d/yr today · 4 by 30 yrs out
Nearby sold comps map
Loading sold comps map…
Walkable amenities ~0.75 mi
Loading nearby amenities…
Taxation est. · year 1
- Rental income
- $13,920
- − Mortgage interest
- −$7,002
- − Property taxes
- −$770
- − Insurance
- −$625
- − Repairs & maintenance
- −$1,114
- − Management
- −$1,114
- − Depreciation
- −$3,636
- Taxable loss
- −$340
- Est. tax savings @ 24.0%
- +$82
- After-tax cash flow
- $1,818/yr
For passive investors: Depreciation is non-cash, so a rental often shows a tax loss while cash-flowing — sheltering income. Rental losses are passive: they offset passive income freely, and up to $25,000/yr can offset ordinary (W-2) income if you actively participate and your MAGI is under $100k (phasing out to $0 by $150k); unused losses carry forward. On sale, claimed depreciation is recaptured at up to 25%, and gains may owe capital-gains tax (a 1031 exchange can defer both). Figures are a year-1 estimate at your 24.0% rate — not tax advice; consult a CPA.
Schools (NCES district)
- District
- Shenandoah School Corporation
- NCES district ID
- 1808280
- Math proficiency
- 38% ▼ -15.00%
- Reading proficiency
- 46% ▼ -9.00%
- Median HH income
- $50,961
- Composite
- 36.22/100
- National rank
- #4723
- State rank
- #118 of 301 in IN
Livability — Middletown
- Score
- 67/100
- State rank
- #235
- US rank
- #10188
Category grades
Schools grade is shown separately in the Schools card above.
Census & demographics
- Census place
- Middletown, IN
- Population (ZIP)
- 5,508
Population outlook (Henry County) Hauer SSP2
- Today (2025)
- 48,028 people
- By 2030
- 47,125 · -1.9%
- By 2040
- 44,820 · -6.7%
- By 2050
- 42,207 · -12.1%
- By 2075
- 35,814 · -25.4%
- By 2100
- 26,779 · -44.2%
Race, ethnicity, and origin ACS 2023
- Neighborhood character
- Predominantly White (90%)
- Race & ethnicity
- White 90% Two or more races 5% Hispanic / Latino 3% Black 2%
- Common ancestry
- Serbian 3% Iranian 2% Slovak 2%
- Foreign-born
- 2%
- Languages at home
- 99% English-only · Spanish 1%
Political lean MEDSL · Henry
- 2024 margin
- Solid R (+47.7) · D 25.3% · R 73.0% · Other 1.7%
- 2008→2024 swing
- -43.8pp toward R · 2008: -3.9pp · 2024: -47.7pp
- All cycles
- 2024: R+47.7 2020: R+45.2 2016: R+43.7 2012: R+17.0 2008: R+3.9
Not yet ingested
- Civics
- —
Market trends
- HPI YoY
- ▼ -55.87%
- Current HPI
- 240.0691
- Rent YoY
- —
- Metro
- —
- State GDP YoY
- ▲ 2.90%
- F500 in state
- 18
Industry mix (Fortune 500 HQ in IN)
| Industry | F500 HQs | Revenue |
|---|---|---|
| Industrial Machinery | 2 | $37B |
|
||
| Healthcare | 1 | $177B |
|
||
| Pharmaceuticals | 1 | $45B |
|
||
| Metals / Steel | 1 | $18B |
|
||
| Agriculture | 1 | $17B |
|
||
| Packaging | 1 | $12B |
|
||
Price history
+108.7% since first listed20 events — show timeline
- 2026-05-27 Listed $125,000 MIBOR as Distributed by MLS Grid
- 2025-04-21 Listing Removed — MIBOR as Distributed by MLS Grid
- 2025-01-13 Price Changed $130,000 MIBOR as Distributed by MLS Grid
- 2025-01-09 Price Changed $140,000 MIBOR as Distributed by MLS Grid
- 2024-12-21 Price Changed $150,000 MIBOR as Distributed by MLS Grid
- 2024-11-06 Price Changed $159,900 MIBOR as Distributed by MLS Grid
- 2024-10-24 Listed $164,900 MIBOR as Distributed by MLS Grid
- 2022-07-01 Sold (Public Records) $84,900 Public Records
- 2022-06-30 Sold (MLS) $84,900 IRMLS
- 2022-05-29 Delisted — IRMLS
- 2022-05-27 Listed $84,900 IRMLS
- 2015-04-13 Sold (MLS) $49,900 MIBOR as Distributed by MLS Grid
- 2015-04-13 Sold (MLS) $49,900 IRMLS
- 2015-02-24 Listed $49,900 MIBOR as Distributed by MLS Grid
- 2015-02-24 Listed $49,900 IRMLS
- 2008-09-05 Sold (MLS) $13,000 MIBOR as Distributed by MLS Grid
- 2008-05-12 Sold (Public Records) $68,664 Public Records
- 2008-04-29 Listed $19,900 MIBOR as Distributed by MLS Grid
- 2001-02-22 Sold (MLS) $59,900 MIBOR as Distributed by MLS Grid
- 2000-11-18 Listed $59,900 MIBOR as Distributed by MLS Grid
Property tax history
+0.9%/yrLatest (2024): $770 · +36.6% YoY. Source: county tax records.
Cash-flow waterfall
monthlySold comps — $/sqft
last 12 mo · ≤1 miLoading sold comps…