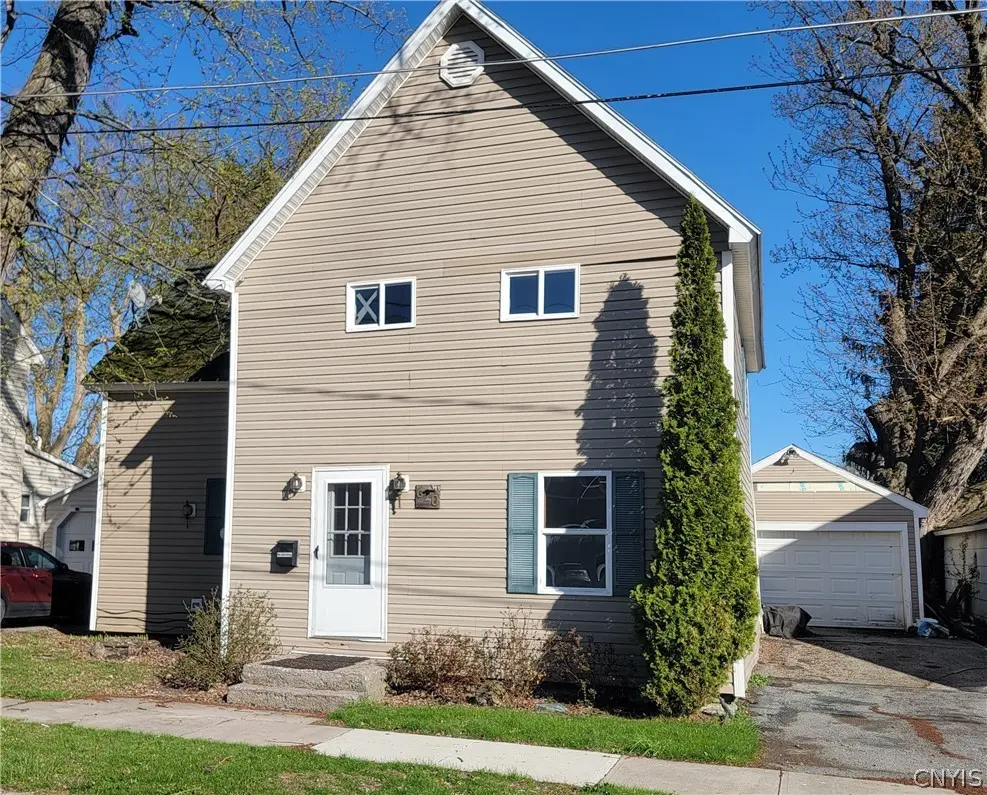
620 Mohawk St · Watertown, NY
Flood risk 10/10 · Severe
- FEMA flood zone
- X (shaded)
- Chance of flooding over 30 yrs
- 0.99%
- Est. flood insurance / yr
- $473 – $860
Fire risk 1/10 · Minimal
- Est. fire insurance / yr
- $691 – $1,283
Heat risk 2/10 · Minimal
- Hot days now (above 92°F)
- 7 days/yr
- Hot days in 30 yrs
- 15 days/yr
Wind risk 1/10 · Minimal
- Chance of severe wind over 30 yrs
- 0.0%
Air-quality risk 2/10 · Minimal
- Unhealthy air days now
- 1 days/yr
- Unhealthy air days in 30 yrs
- 1 days/yr
Risk factors via First Street. Map © Google.
Why this score? — see what drove the B+ grade
The composite is a weighted blend of 9 inputs, each scored 0–100. Each bar is that input's sub-score; the figure is the points it added to the 100-point composite (weight × sub-score).
- Cash flow +28.8/30.0
- ARV discount +15.0/15.0
- DSCR +10.0/10.0
- 1% rule +8.0/10.0
- Rent growth +5.0/5.0
- Schools +3.7/10.0
- Livability +3.4/5.0
- Condition / age +2.5/5.0
- Appreciation +0.0/10.0
$132,900
🖨 Deal sheet (PDF) 📄 Offer letter ✓ Due diligence
Listing remarks
Affordable, Spacious Home with Large Fully Fenced Yard – This 4-bedroom, 2 full bathroom home offers a functional layout and great potential. The main level features a large living room, a fully applianced, eat-in kitchen, and convenient first-floor full bathroom with laundry and storage. Upstairs, you’ll find 4 generously sized bedrooms providing ample space for a variety of uses. The property sits on a quiet, dead-end street. .. includes a one-car garage, fully fenced backyard with a patio offering plenty of outdoor space for family, pets and entertaining. Conveniently located, this home provides close proximity to shopping, healthcare facilities, parks, and major routes, w
Key facts
- 5,978 sq ft lot
- Garage
- Built 1930
Property features AI
Exterior
- Parking: Detached garage; 1 garage space
- Utilities: Public water (connected); Sewer connected
- Home design: Two-story house; Existing/Resale property
- Construction: Vinyl siding; Stone foundation
- Exterior features: Blacktop driveway; Near public transit; Rectangular residential lot; City street frontage
Interior
- Kitchen: Gas oven; Gas range; Refrigerator
- Bedrooms: 6 total rooms (includes bedroom count within room total)
- Flooring: Carpet; Laminate; Vinyl; Varied flooring
- Bathrooms: 2 full bathrooms; 1 main-level bathroom
- Heating & cooling: Gas heating; Hot water heat
- Interior features: Eat-in kitchen; Partial basement
- Laundry & utility: Main-level laundry; Washer
Neighborhood map
What this means for you Summary
Snapshot
- This is a 4-bed/1.5-bath single-family listed at $133k.
Deal economics
- At list price, monthly cash flow is $391 ($5k/yr) — positive.
- The deal already cash-flows at list — no discount required.
- Meets the 1% rule at list price ($2k rent vs $133k).
- Recommended offer: $129k (3.0% below list) — sets the bar for market timing.
- Cap rate 10.3% vs local median 6.2% in Watertown — top-decile yield for the area; either an underpriced asset or a hidden risk that comps aren't pricing in. Stress-test before assuming the spread holds.
Location & tenants
- Location reads 68/100 on livability (#540 in NY) — a middle-class / working-renter tenant base. Strengths: health & safety A+, cost of living A-, housing A-; Watch: amenities C-, schools D, crime F.
- Watertown City School District (urban): math 34% / reading 54% proficiency, ranked #481 of 590 in NY (top 82%) — families likely to look elsewhere, expect single-tenant / working-renter base with shorter leases.
- Market conditions: Rents rising fast (+10.0%/yr); 223 active listings in the ZIP; 5 comparable units currently listed for rent nearby; rentals lingering (median 45d on market — plan ~5-8 weeks vacancy on turnover, expect pricing pressure); 100% of comp listings sitting > 30 days — soft ceiling on asking rent; 196 units permitted in Jefferson County in 2024 (0 in 5+ unit buildings).
- This rent runs 35% of the median local income ($59k/yr) — at the standard rent-burdened threshold; future hikes will face affordability resistance.
Forward outlook
- Local home prices are declining (-3.0%/yr); year-one equity from $919 of loan paydown is wiped out by about $4k of value loss. Plan a longer hold.
- Jefferson County population projected at -12% by 2050 — secular population decline; favor cash flow + early exit over multi-decade hold.
- At projected returns (-3.0% appreciation + 8.0% rent growth), your $37k cash investment doubles in ~7 years — after that, you're playing with house money.
Negotiation context
- It's been on market 46 days — a 3% lower offer ($129k) is reasonable based on typical stale-listing flexibility.
Risks & watch-outs
- Watch-outs: flood insurance adds $56/mo; built in 1930 — expect roof / HVAC / electrical / plumbing capex.
- Climate carrying-cost: severe flood risk — expect insurance premiums to compound above CPI over the hold.
Questions for the listing agent
- It's been on market 46 days. Have you received any prior offers? Is the seller open to a 3% concession, seller financing, or rate buy-down credit?
- Built in 1930 — when were the roof, HVAC, electrical panel, plumbing, and water heater last replaced?
- What's the actual annual flood-insurance premium (NFIP or private), and is the property in a SFHA with mandatory coverage?
- Is there a deadline driving the sale (1031 exchange, divorce, estate, relocation)? That informs how much negotiation room exists.
- Schools are D-rated, which usually means shorter tenancies and higher turnover. Who's the typical renter profile here, and what's been the actual vacancy rate?
- Crime grade is F in this area — have there been break-ins, vandalism, or insurance claims at this property in the last 3 years? What carrier currently insures it and at what premium?
- What's the average days-on-market for RENTAL listings here right now (not sales)? A rising rental-DOM trend means longer vacancies and softer asking-rent achievability than the comps imply.
- What's the recent tenant-quality profile in this submarket — average credit score on applications, eviction rate, late-payment / NSF rate, and stable-employment percentage? A property-management company in the area should have these aggregated.
- How much new for-sale + rental construction is in the pipeline within 1–3 miles? Heavy new supply typically softens prices + rents 12–24 months out; constrained supply supports both.
Investment metrics
- 1% rule
- 1.30% ✓
- Cap rate
- 10.33%
- Cash-on-cash
- 14.41%
- DSCR
- 1.64
- GRM
- 6.4
CMA / ARV
- ARV (median comp)
- $191,214
- List price
- $132,900
- Delta
- -30.50%
- Verdict
- UNDERPRICED
- Comps
- 20 within 1.0 mi
Show comp detail 12 sales within ~0.75 mi
| Address | Dist | Beds/Ba | Sqft | Sold | Price | $/sf | Match |
|---|---|---|---|---|---|---|---|
| 522 Frontenac St | 0.11mi | 3/1.0 (-1) | 1,296 (-5%) | 6mo | $142,500 | $110 | 74 |
| 857 Superior St | 0.06mi | 3/1.0 (-1) | 1,194 (-13%) | 1mo | $175,000 | $147 | 68 |
| 509 Plum Ave | 0.23mi | 4/1.5 | 1,200 (-12%) | 4mo | $102,500 | $85 | 66 |
| 823 Morrison St | 0.28mi | 3/1.0 (-1) | 1,300 (-5%) | 10mo | $33,500 | $26 | 64 |
| 158 Cedar St | 0.70mi | 3/1.0 (-1) | 1,374 (+0%) | 1mo | $155,000 | $113 | 59 |
| 660 Cooper St | 0.69mi | 4/1.0 | 1,417 (+4%) | 3mo | $132,900 | $94 | 57 |
| 327 W Lynde St | 0.61mi | 3/2.0 (-1) | 1,295 (-5%) | 6mo | $232,000 | $179 | 51 |
| 137 N Orchard St | 0.73mi | 3/1.0 (-1) | 1,410 (+3%) | 7mo | $153,700 | $109 | 48 |
| 114 Gale St | 0.71mi | 3/2.0 (-1) | 1,300 (-5%) | 6mo | $80,000 | $62 | 47 |
| 646 Cooper St | 0.71mi | 4/1.0 | 1,519 (+11%) | 2mo | $195,000 | $128 | 45 |
| 653 Thompson St | 0.53mi | 3/1.5 (-1) | 1,164 (-15%) | 3mo | $160,700 | $138 | 43 |
| 211 W Lynde St | 0.73mi | 3/2.0 (-1) | 1,554 (+14%) | 1mo | $190,000 | $122 | 36 |
Match score weights: distance 35% · size 25% · config 20% · recency 20%. Top-matched comps best support the ARV.
Projected returns pro-forma
-3.0% appreciation · 8.0% rent growth · sell at horizon
- IRR
- 8.1%
- Equity multiple
- 1.34×
- Total profit
- $12,574
- Equity at exit
- $19,816
- IRR
- 21.4%
- Equity multiple
- 3.28×
- Total profit
- $84,817
- Equity at exit
- $11,491
Cash invested: $37,212 (down + closing). Projections, not guarantees.
Landlord ↔ Tenant lean methodology
- Overall (STATE)
- 15 Strongly Tenant-Friendly
- State New York
- 15 Strongly Tenant-Friendly · D+10
- County
- — inherits STATE
- City
- — inherits STATE
ZIP-level market 13601
- Home prices YoY
- -5.6%
- Rents YoY
- 10.0%
- Active inventory
- 223
- Price-to-rent
- 6.4×
Monthly cashflow live
- Estimated rent
- $1,727 high interval (Pro) →
- Mortgage (P&I)
- −$697
- Tax from tax record
- −$165 /mo · $1,979/yr
- Insurance
- −$55
- Flood insurance flood zone
- −$56 /mo · $666/yr
- HOA
- −$0
- Vacancy / Maint / Mgmt
- −$363
- Net cashflow
- $391
Break-even live
Sensitivity live
| Price | -10% $467 | -5% $429 | +0% $391 | +5% $354 | +10% $316 |
|---|---|---|---|---|---|
| Rent | -10% $255 | -5% $323 | +0% $391 | +5% $460 | +10% $528 |
| Rate | -1.0pp $458 | -0.5pp $425 | base $391 | +0.5pp $357 | +1.0pp $322 |
UW: 25.0% down · 7.5% · 30yr · 1.5% tax · 5.0% vac · 8.0% maint · 8.0% mgmt
Financing live
Cash to close
- Down payment
- $33,225
- Closing costs
- $3,987
- Reserves months
- —
- Total cash needed
- —
Loan-product check · same deal, 3 products live
Conventional
25% down · 7.5% · 30yr
- Down + closing
- —
- Monthly P&I
- —
- Monthly cashflow
- —
- DSCR
- —
- Eligible?
- —
Personal DTI + credit; lowest rate.
DSCR
20% down · 8.5% · 30yr
- Down + closing
- —
- Monthly P&I
- —
- Monthly cashflow
- —
- DSCR
- —
- Eligible?
- —
No personal income docs; deal must DSCR.
Hard money
10% down · 12.0% · 12mo
- Down + closing
- —
- Monthly P&I
- —
- Monthly cashflow
- —
- DSCR
- —
- Eligible?
- —
Short-term bridge; refi at stabilization.
Rent comps 5 comps
| Address | Beds | Baths | Sqft | Rent | $/sqft | DOM | Units | Dist |
|---|---|---|---|---|---|---|---|---|
| 611 Cooper St Watertown, NY | 3.0 | 1.0 | 1190 | $1,495 | $1.26 | 44d | 1 | 0.70mi |
| 207 Wealtha Ave Watertown, NY | 2.0–4.0 | 1.0–2.5 | 1435 | $1,695 | $1.18 | 44d | 9 | 0.94mi |
| 328 Clay St Unit 3 Watertown, NY | 3.0 | 2.0 | 1500 | $1,650 | $1.10 | 44d | 1 | 1.30mi |
| 123 State Pl Watertown, NY | 3.0 | 1.5 | 1500 | $1,750 | $1.17 | 44d | 1 | 1.39mi |
| 621 Academy St Watertown, NY | 3.0 | 2.0 | 1652 | $1,600 | $0.97 | 44d | 1 | 1.49mi |
Listing history 17 events
-
2026-06-19days on market $132,900 Active 46 DOM
-
2026-06-18days on market $132,900 Active 45 DOM
-
2026-06-17days on market $132,900 Active 44 DOM
-
2026-06-16days on market $132,900 Active 43 DOM
-
2026-06-15days on market $132,900 Active 42 DOM
-
2026-06-14days on market $132,900 Active 40 DOM
-
2026-06-12days on market $132,900 Active 39 DOM
-
2026-06-09days on market $132,900 Active 36 DOM
-
2026-06-08days on market $132,900 Active 35 DOM
-
2026-06-07days on market $132,900 Active 34 DOM
-
2026-06-05days on market $132,900 Active 31 DOM
-
2026-06-03days on market $132,900 Active 30 DOM
-
2026-06-02days on market $132,900 Active 29 DOM
-
2026-06-01days on market $132,900 Active 28 DOM
-
2026-05-31days on market $132,900 Active 27 DOM
-
2026-05-30days on market $132,900 Active 26 DOM
-
2026-05-04$137,500 Active 823-char remark
ⓘ Source: listings_history table (triggers on properties + properties_extension) + one-shot
backfill from property_details.listing_events for pre-trigger history.
Tax reassessment forecast NY · Partial reset (capped growth)
- Current annual tax
- $1,979 · $165/mo
- Projected year-2 tax
- $2,112 · $176/mo
- Expected delta
- +$134/yr (+$11/mo · 6.7%)
ⓘ Screening estimate from a state-policy table — verify with the county assessor before closing.
Climate risk First Street
- Flood 10/10 Extreme FEMA zone X (shaded) · 99% chance over 30 yrs
- Wildfire 1/10 Low
- Heat 2/10 Low 7 d/yr ≥92°F today · 15 d/yr by 30 yrs out
- Wind 1/10 Low 0% chance of damaging wind over 30 yrs
- Air quality 2/10 Low 1 unhealthy d/yr today · 1 by 30 yrs out
Nearby sold comps map
Loading sold comps map…
Walkable amenities ~0.75 mi
Loading nearby amenities…
Taxation est. · year 1
- Rental income
- $20,721
- − Mortgage interest
- −$7,444
- − Property taxes
- −$1,979
- − Insurance
- −$1,331
- − Repairs & maintenance
- −$1,658
- − Management
- −$1,658
- − Depreciation
- −$3,866
- Taxable income
- $2,785
- Est. tax owed @ 24.0%
- −$668
- After-tax cash flow
- $4,028/yr
For passive investors: Depreciation is non-cash, so a rental often shows a tax loss while cash-flowing — sheltering income. Rental losses are passive: they offset passive income freely, and up to $25,000/yr can offset ordinary (W-2) income if you actively participate and your MAGI is under $100k (phasing out to $0 by $150k); unused losses carry forward. On sale, claimed depreciation is recaptured at up to 25%, and gains may owe capital-gains tax (a 1031 exchange can defer both). Figures are a year-1 estimate at your 24.0% rate — not tax advice; consult a CPA.
Schools (NCES district)
- District
- Watertown City School District
- NCES district ID
- 3630120
- Math proficiency
- 34% ▼ -10.00%
- Reading proficiency
- 54% ▲ 12.00%
- Median HH income
- $40,919
- Composite
- 36.86/100
- National rank
- #4551
- State rank
- #481 of 590 in NY
Livability — Watertown
- Score
- 68/100
- State rank
- #540
- US rank
- #9700
Category grades
Schools grade is shown separately in the Schools card above.
Census & demographics
- Census place
- Watertown, NY
- County
- Jefferson County · 47,417 people
- City population
- 36,839
- Metro
- Watertown-Fort Drum, NY
- Population (ZIP)
- 36,839
- Household income
- $58,791
- Rent vs Own
- Severe rent burden
- 1634.0
Population outlook (Jefferson County) Hauer SSP2
- Today (2025)
- 111,748 people
- By 2030
- 109,370 · -2.1%
- By 2040
- 103,828 · -7.1%
- By 2050
- 98,523 · -11.8%
- By 2075
- 91,422 · -18.2%
- By 2100
- 78,214 · -30.0%
Race, ethnicity, and origin ACS 2023
- Neighborhood character
- Predominantly White (82%)
- Race & ethnicity
- White 82% Two or more races 7% Hispanic / Latino 6% Black 4% Asian 2%
- Hispanic origin (detail)
- Mexican 2% Puerto Rican 2%
- Common ancestry
- Lithuanian 7% Romanian 3% Slovak 2%
- Foreign-born
- 4% · Canada
- Languages at home
- 94% English-only · Spanish 3% Other Indo-European 1% German/W. Germanic 1%
Political lean MEDSL · Jefferson
- 2024 margin
- Strong R (+23.6) · D 38.2% · R 61.8%
- 2008→2024 swing
- -18.3pp toward R · 2008: -5.3pp · 2024: -23.6pp
- All cycles
- 2024: R+23.6 2020: R+19.0 2016: R+22.4 2012: R+2.9 2008: R+5.3
Not yet ingested
- Civics
- —
Market trends
- HPI YoY
- ▼ -18.86%
- Current HPI
- 316.636
- Rent YoY
- ▲ 9.96%
- Metro
- Watertown-Fort Drum, NY
- State GDP YoY
- ▲ 2.60%
- F500 in state
- 92
Industry mix (Fortune 500 HQ in NY)
| Industry | F500 HQs | Revenue |
|---|---|---|
| Financial Services | 10 | $950B |
|
||
| Consumer Goods | 9 | $162B |
|
||
| Insurance | 4 | $225B |
|
||
| Telecommunications | 2 | $144B |
|
||
| Pharmaceuticals | 2 | $112B |
|
||
| Media / Entertainment | 2 | $69B |
|
||
Price history
-3.3% since first listed2 events — show timeline
- 2026-05-19 Price Changed $132,900 CNYIS
- 2026-05-04 Listed $137,500 CNYIS
Property tax history
+18.7%/yrLatest (2025): $1,979 · +3.9% YoY. Source: county tax records.
Cash-flow waterfall
monthlySold comps — $/sqft
last 12 mo · ≤1 miLoading sold comps…