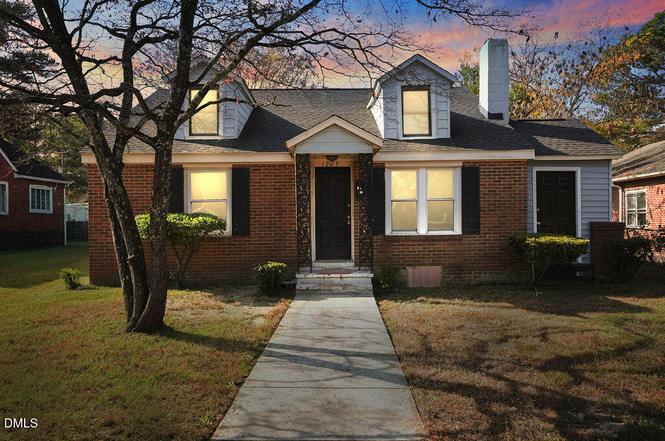
1905 Harris St · Fayetteville, NC
Flood risk 1/10 · Minimal
- FEMA flood zone
- X (unshaded)
- Chance of flooding over 30 yrs
- 0.0%
- Est. flood insurance / yr
- $507 – $1,088
Fire risk 4/10 · Minor
- Est. fire insurance / yr
- $906 – $1,684
Heat risk 7/10 · Major
- Hot days now (above 106°F)
- 7 days/yr
- Hot days in 30 yrs
- 16 days/yr
Wind risk 7/10 · Major
- Chance of severe wind over 30 yrs
- 78.0%
Air-quality risk 2/10 · Minimal
- Unhealthy air days now
- 0 days/yr
- Unhealthy air days in 30 yrs
- 1 days/yr
Risk factors via First Street. Map © Google.
Why this score? — see what drove the C grade
The composite is a weighted blend of 9 inputs, each scored 0–100. Each bar is that input's sub-score; the figure is the points it added to the 100-point composite (weight × sub-score).
- Cash flow +20.0/30.0
- ARV discount +14.9/15.0
- DSCR +6.3/10.0
- 1% rule +5.3/10.0
- Livability +3.8/5.0
- Rent growth +3.4/5.0
- Schools +3.1/10.0
- Condition / age +2.5/5.0
- Appreciation +0.0/10.0
$134,000
🖨 Deal sheet 📄 Offer letter ✓ Due diligence
Listing remarks
Great opportunity for investors or buyers seeking a value-add property. This three bedroom, two bath home features recent updates, including mini-split systems, fresh interior paint, upgraded bathrooms, and new fixtures. The living room offers high ceilings, creating an open and modern feel. A bonus room upstairs provides additional flexible space. With vision and finishing touches, this property has strong potential as a primary residence or investment. Property is being sold As Is. Schedule your showing today. This home will not last.
Key facts
- New fixtures
- High ceilings
- Upgraded bathrooms
Tags
Property features AI
Finance
- Other: Lot approximately 0.17 acres; Zoned SF6
- HOA & community: No association
Exterior
- Utilities: Public water; Public sewer
- Home design: House; One and one-half story
- Construction: Brick or brick veneer construction; Built with traditional foundation
- Exterior features: Private yard; Shingle roof
Interior
- Bedrooms: 3 bedrooms (all on the main level)
- Flooring: Laminate flooring; Tile flooring
- Bathrooms: 2 full bathrooms
- Heating & cooling: Electric heating; Ceiling fans; Electric cooling; Wall-mounted AC units
- Interior features: High ceilings; Vaulted ceilings
Neighborhood map
What this means for you Summary
Snapshot
- This is a 3-bed/2.0-bath single-family listed at $134k.
Deal economics
- At list price, monthly cash flow is $163 ($2k/yr) — positive.
- The deal already cash-flows at list — no discount required.
- Meets the 1% rule at list price ($1k rent vs $134k).
- Recommended offer: $122k (9.0% below list) — sets the bar for market timing.
- Cap rate 7.8% vs local median 4.9% in Fayetteville — top-decile yield for the area; either an underpriced asset or a hidden risk that comps aren't pricing in. Stress-test before assuming the spread holds.
Location & tenants
- Location reads 75/100 on livability (#45 in NC, #4,031 nationally) — a middle-class / working-renter tenant base. Strengths: commute A+, cost of living A+, housing A+; Watch: crime F, employment D-.
- Cumberland County Schools (urban): math 32% / reading 41% proficiency, ranked #126 of 178 in NC (top 71%) — families likely to look elsewhere, expect single-tenant / working-renter base with shorter leases.
- Zoned schools: Luther Nick Jeralds Middle (math 13% / reading 24%, grade F, #436 of 475 statewide, top 93%, 616 students, 100% FRL) — zoned schools average 100% FRL vs 55% district-wide (45 pts higher); higher-poverty schools than district average — tighter screening recommended.
- Zoned-school proficiency averages 18% at this address vs 36% district-wide (-18 pts) — the specific schools serving this property underperform the Cumberland County Schools average; the district grade overstates school quality for this exact location.
- Market conditions: Rents rising (+3.5%/yr); 132 active listings in the ZIP; 36 comparable units currently listed for rent nearby; rentals at typical pace (median 24d on market — plan ~3-4 weeks tenant-placement turnaround); lower-income renter base — watch delinquency; 1,125 units permitted in Cumberland County in 2024 (104 in 5+ unit buildings).
- This rent runs 42% of the median local income ($39k/yr) — at the standard rent-burdened threshold; future hikes will face affordability resistance.
Forward outlook
- Local home prices are declining (-3.0%/yr); year-one equity from $926 of loan paydown is wiped out by about $4k of value loss. Plan a longer hold.
Negotiation context
- It's been on market 108 days — a 9% lower offer ($122k) is reasonable based on typical stale-listing flexibility.
- 4 sale attempts; this cycle's ask has dropped $31k (19%) from the opening price — seller is motivated, your offer sets the floor, not the list.
- Current owner paid $31k; list at $134k implies a 332% gain — meaningful room to come down on a strong offer.
Risks & watch-outs
- Watch-outs: built in 1945 — expect roof / HVAC / electrical / plumbing capex.
- Climate carrying-cost: major wind risk, 78% chance of damaging wind over 30y; extreme-heat days projected 7→16/yr by 2055 (HVAC capex compounding) — expect insurance premiums to compound above CPI over the hold.
Questions for the listing agent
- It's been on market 108 days. Have you received any prior offers? Is the seller open to a 9% concession, seller financing, or rate buy-down credit?
- Built in 1945 — when were the roof, HVAC, electrical panel, plumbing, and water heater last replaced?
- Why hasn't it sold? Are there any deal-killer items the seller is aware of (foundation, flood, title, zoning, code violations)?
- Is there a deadline driving the sale (1031 exchange, divorce, estate, relocation)? That informs how much negotiation room exists.
- Crime grade is F in this area — have there been break-ins, vandalism, or insurance claims at this property in the last 3 years? What carrier currently insures it and at what premium?
- What's the average days-on-market for RENTAL listings here right now (not sales)? A rising rental-DOM trend means longer vacancies and softer asking-rent achievability than the comps imply.
- What's the recent tenant-quality profile in this submarket — average credit score on applications, eviction rate, late-payment / NSF rate, and stable-employment percentage? A property-management company in the area should have these aggregated.
- How much new for-sale + rental construction is in the pipeline within 1–3 miles? Heavy new supply typically softens prices + rents 12–24 months out; constrained supply supports both.
Investment metrics
- 1% rule
- 1.03% ✓
- Cap rate
- 7.76%
- Cash-on-cash
- 5.22%
- DSCR
- 1.23
- GRM
- 8.1
CMA / ARV
- ARV (on-the-fly)
- $160,174
- Comps found
- 12
Show comp detail 12 sales within ~0.75 mi
| Address | Dist | Beds/Ba | Sqft | Sold | Price | $/sf | Match |
|---|---|---|---|---|---|---|---|
| 1619 Minurva Dr | 0.39mi | 3/2.0 | 1,330 (-1%) | 3mo | $255,000 | $192 | 78 |
| 1108 Henderson Ave | 0.10mi | 3/2.0 | 1,220 (-9%) | 3mo | $145,000 | $119 | 77 |
| 1342 Essex Pl | 0.41mi | 3/1.5 | 1,302 (-3%) | 2mo | $110,250 | $85 | 71 |
| 1516 Murchison Rd | 0.38mi | 3/2.0 | 1,393 (+4%) | 14mo | $87,000 | $62 | 65 |
| 113 Jasper St | 0.28mi | 3/2.0 | 1,168 (-13%) | 1mo | $215,000 | $184 | 64 |
| 1100 Hood Ave | 0.05mi | 3/1.0 | 1,176 (-13%) | 13mo | $124,900 | $106 | 61 |
| 1467 Bridger St | 0.46mi | 3/1.5 | 1,255 (-7%) | 14mo | $148,000 | $118 | 54 |
| 1486 Thelbert Dr | 0.43mi | 3/1.5 | 1,479 (+10%) | 11mo | $169,000 | $114 | 52 |
| 520 Marion Ct | 0.58mi | 3/2.0 | 1,448 (+8%) | 12mo | $157,500 | $109 | 51 |
| 1900 Torrey Dr | 0.31mi | 4/2.0 (+1) | 1,527 (+13%) | 10mo | $203,000 | $133 | 50 |
| 1710 Mcgougan Rd | 0.67mi | 3/1.5 | 1,249 (-7%) | 14mo | $157,000 | $126 | 43 |
| 1612 Rogers Dr | 0.71mi | 3/2.0 | 1,541 (+14%) | 8mo | $252,000 | $164 | 36 |
Match score weights: distance 35% · size 25% · config 20% · recency 20%. Top-matched comps best support the ARV.
Projected returns pro-forma
-3.0% appreciation · 3.49% rent growth · sell at horizon
- IRR
- -7.6%
- Equity multiple
- 0.72×
- Total profit
- $-10,607
- Equity at exit
- $19,980
- IRR
- 2.6%
- Equity multiple
- 1.19×
- Total profit
- $7,070
- Equity at exit
- $11,586
Cash invested: $37,520 (down + closing). Projections, not guarantees.
Landlord ↔ Tenant lean methodology
- Overall (STATE)
- 85 Strongly Landlord-Friendly
- State North Carolina
- 85 Strongly Landlord-Friendly · R+3
- County
- — inherits STATE
- City
- — inherits STATE
ZIP-level market 28301
- Home prices YoY
- -12.5%
- Rents YoY
- 3.5%
- Active inventory
- 132
- Price-to-rent
- 8.1×
Monthly cashflow live
- Estimated rent
- $1,377 high interval (Pro) →
- Mortgage (P&I)
- −$703
- Tax from tax record
- −$166 /mo · $1,995/yr
- Insurance
- −$56
- HOA
- −$0
- Vacancy / Maint / Mgmt
- −$289
- Net cashflow
- $163
Break-even live
UW: 25.0% down · 7.5% · 30yr · 1.5% tax · 5.0% vac · 8.0% maint · 8.0% mgmt
Financing live
Cash to close
- Down payment
- $33,500
- Closing costs
- $4,020
- Reserves months
- —
- Total cash needed
- —
Loan-product check · same deal, 3 products live
Conventional
25% down · 7.5% · 30yr
- Down + closing
- —
- Monthly P&I
- —
- Monthly cashflow
- —
- DSCR
- —
- Eligible?
- —
Personal DTI + credit; lowest rate.
DSCR
20% down · 8.5% · 30yr
- Down + closing
- —
- Monthly P&I
- —
- Monthly cashflow
- —
- DSCR
- —
- Eligible?
- —
No personal income docs; deal must DSCR.
Hard money
10% down · 12.0% · 12mo
- Down + closing
- —
- Monthly P&I
- —
- Monthly cashflow
- —
- DSCR
- —
- Eligible?
- —
Short-term bridge; refi at stabilization.
Rent comps 36 comps
| Address | Beds | Baths | Sqft | Rent | $/sqft | DOM | Units | Dist |
|---|---|---|---|---|---|---|---|---|
| 1628 Murchison Rd Fayetteville, NC | 3.0 | 1.0 | 1700 | $1,295 | $0.76 | 23d | 1 | 0.25mi |
| 1704 Newark Ave Fayetteville, NC | 2.0 | 1.0 | 1100 | $850 | $0.77 | 23d | 1 | 0.31mi |
| 1817 McGougan Rd Fayetteville, NC | 3.0 | 2.0 | 1811 | $2,100 | $1.16 | 14d | 1 | 0.77mi |
| 809 Cape Fear Ave Fayetteville, NC | 2.0 | 1.0 | 1225 | $1,450 | $1.18 | 21d | 1 | 0.81mi |
| 808 Ethelored St Fayetteville, NC | 2.0 | 2.0 | 1701 | $1,395 | $0.82 | 23d | 1 | 0.83mi |
| 1000 Ivy Rd Fayetteville, NC | 3.0 | 1.0 | 1200 | $1,400 | $1.17 | 23d | 1 | 0.86mi |
| 1014 Enclave Dr Fayetteville, NC | 1.0–3.0 | 1.0–2.0 | 1112 | $1,685 | $1.52 | 14d | 19 | 0.95mi |
| 536 Pearl St Fayetteville, NC | 2.0 | 1.0 | 1101 | $1,349 | $1.23 | 14d | 1 | 0.97mi |
| 2532 Sourwood Dr Fayetteville, NC | 4.0 | 2.0 | 1562 | $1,700 | $1.09 | 23d | 1 | 0.98mi |
| 530 Pearl St Unit 1367379P Fayetteville, NC | 3.0 | 2.0 | 1194 | $3,577 | $3.00 | 14d | 1 | 1.00mi |
| 1216 Superior Pointe Pl Fayetteville, NC | 3.0 | 2.5 | 1288 | $1,450 | $1.13 | 23d | 1 | 1.03mi |
| 600 Glenville Ave Fayetteville, NC | 2.0 | 1.5 | 1105 | $1,295 | $1.17 | 14d | 1 | 1.06mi |
| 307 Hawthorne Rd Fayetteville, NC | 3.0 | 1.0 | 886 | $1,125 | $1.27 | 14d | 1 | 1.07mi |
| 2105 Wexford Oaks Ct Fayetteville, NC | 2.0 | 2.0 | 988 | $1,500 | $1.52 | 23d | 1 | 1.08mi |
| 1228 Woodland Dr Unit 1 Fayetteville, NC | 2.0 | 2.0 | 1465 | $1,595 | $1.09 | 14d | 1 | 1.09mi |
| 2328 Barrington Cir Fayetteville, NC | 2.0 | 1.0 | 1050 | $1,000 | $0.95 | 21d | 1 | 1.09mi |
| 2326 Barrington Cir Fayetteville, NC | 2.0 | 1.0 | 1050 | $1,200 | $1.14 | 23d | 1 | 1.10mi |
| 2326 Barrington Cir Fayetteville, NC | 2.0 | 1.0 | 1050 | $1,200 | $1.14 | 14d | 1 | 1.10mi |
| 2310 Barrington Cir Fayetteville, NC | 2.0 | 1.0 | 900 | $900 | $1.00 | 23d | 1 | 1.10mi |
| 620 Forest Rd Fayetteville, NC | 2.0 | 1.0 | 1000 | $975 | $0.97 | 23d | 2 | 1.12mi |
| 1547 Londonderry Pl Fayetteville, NC | 3.0 | 2.5 | 1636 | $1,750 | $1.07 | 23d | 1 | 1.17mi |
| 2436 Bragg Blvd Fayetteville, NC | 2.0 | 1.0 | 1000 | $1,200 | $1.20 | 23d | 1 | 1.18mi |
| 2436 Bragg Blvd Fayetteville, NC | 2.0 | 1.0 | 1000 | $1,200 | $1.20 | 14d | 1 | 1.18mi |
| 2434 Bragg Blvd Fayetteville, NC | 2.0 | 1.0 | 1000 | $1,200 | $1.20 | 23d | 1 | 1.18mi |
| 112 Quincy St Fayetteville, NC | 3.0 | 1.0 | 1080 | $1,320 | $1.22 | 14d | 1 | 1.18mi |
| 733 Ashburton Dr Fayetteville, NC | 3.0 | 1.5 | 1118 | $1,300 | $1.16 | 23d | 1 | 1.26mi |
| 501 Lambert St Fayetteville, NC | 2.0 | 2.0 | 1200 | $1,230 | $1.02 | 14d | 3 | 1.26mi |
| 2061 Osceola Dr Fayetteville, NC | 3.0 | 1.0 | 928 | $1,300 | $1.40 | 23d | 1 | 1.30mi |
| 1608 Fayette Ave Fayetteville, NC | 2.0 | 1.0 | 900 | $875 | $0.97 | 23d | 1 | 1.34mi |
| 1608 Fayette Ave Fayetteville, NC | 2.0 | 1.0 | 900 | $875 | $0.97 | 14d | 1 | 1.34mi |
| 715 Ashburton Dr Fayetteville, NC | 3.0 | 2.0 | 1278 | $1,600 | $1.25 | 23d | 1 | 1.36mi |
| 104 Brett Ct Fayetteville, NC | 2.0 | 2.5 | 1210 | $1,400 | $1.16 | 21d | 1 | 1.36mi |
| 113 Mullins Ave Fayetteville, NC | 2.0 | 1.0 | 1000 | $1,025 | $1.02 | 23d | 1 | 1.42mi |
| 1021 W Rowan St Unit H Fayetteville, NC | 2.0 | 1.5 | 930 | $850 | $0.91 | 23d | 1 | 1.42mi |
| 1847 Blake St Fayetteville, NC | 3.0 | 2.0 | 900 | $990 | $1.10 | 14d | 1 | 1.45mi |
| 1847 Blake St Fayetteville, NC | 3.0 | 2.0 | 900 | $990 | $1.10 | 23d | 1 | 1.45mi |
Listing history 16 events
-
2026-06-18days on market $134,000 Active 108 DOM
-
2026-06-17days on market $134,000 Active 107 DOM
-
2026-06-16days on market $134,000 Active 106 DOM
-
2026-06-16status $134,000 Active 105 DOM
-
2026-05-22price $134,000
-
2026-04-13price $138,000
-
2026-03-26price $149,000
-
2026-02-26price $155,000
-
2026-02-10status Active
-
2026-02-06historical
-
2026-02-06$165,000 Active
-
2025-12-29status Active
-
2025-12-22status Pending
-
2025-12-22historical
-
2025-11-20$165,000 Active
-
1995-12-07soldstatus $31,000
ⓘ Source: listings_history table (triggers on properties + properties_extension) + one-shot
backfill from property_details.listing_events for pre-trigger history.
Tax reassessment forecast NC · Resets to sale price
- Current annual tax
- $1,995 · $166/mo
- Projected year-2 tax
- $1,995 · $166/mo
- Expected delta
- $0/yr ($0/mo · 0.0%)
ⓘ Screening estimate from a state-policy table — verify with the county assessor before closing.
Climate risk First Street
- Flood 1/10 Low FEMA zone X (unshaded) · 0% chance over 30 yrs
- Wildfire 4/10 Moderate
- Heat 7/10 Severe 7 d/yr ≥106°F today · 16 d/yr by 30 yrs out
- Wind 7/10 Severe 78% chance of damaging wind over 30 yrs
- Air quality 2/10 Low 0 unhealthy d/yr today · 1 by 30 yrs out
Nearby sold comps map
Loading sold comps map…
Walkable amenities ~0.75 mi
Loading nearby amenities…
Taxation est. · year 1
- Rental income
- $16,529
- − Mortgage interest
- −$7,506
- − Property taxes
- −$1,995
- − Insurance
- −$670
- − Repairs & maintenance
- −$1,322
- − Management
- −$1,322
- − Depreciation
- −$3,898
- Taxable loss
- −$185
- Est. tax savings @ 24.0%
- +$44
- After-tax cash flow
- $2,005/yr
For passive investors: Depreciation is non-cash, so a rental often shows a tax loss while cash-flowing — sheltering income. Rental losses are passive: they offset passive income freely, and up to $25,000/yr can offset ordinary (W-2) income if you actively participate and your MAGI is under $100k (phasing out to $0 by $150k); unused losses carry forward. On sale, claimed depreciation is recaptured at up to 25%, and gains may owe capital-gains tax (a 1031 exchange can defer both). Figures are a year-1 estimate at your 24.0% rate — not tax advice; consult a CPA.
Schools (NCES district)
- District
- Cumberland County Schools
- NCES district ID
- 3700011
- Math proficiency
- 32% ▼ -2.00%
- Reading proficiency
- 41% ▼ -1.00%
- Median HH income
- $44,168
- Composite
- 31.0/100
- National rank
- #6096
- State rank
- #126 of 178 in NC
Livability — Fayetteville
- Score
- 75/100
- State rank
- #45
- US rank
- #4031
Category grades
Schools grade is shown separately in the Schools card above.
Census & demographics
- Census place
- Fayetteville, NC
- County
- Cumberland County · 265,314 people
- City population
- 226,118
- Metro
- Fayetteville, NC
- Population (ZIP)
- 16,798
- Household income
- $39,198
- Rent vs Own
- Severe rent burden
- 1389.0
Population outlook (Cumberland County) Hauer SSP2
- Today (2025)
- 330,855 people
- By 2030
- 333,523 · +0.8%
- By 2040
- 335,583 · +1.4%
- By 2050
- 335,325 · +1.4%
- By 2075
- 342,853 · +3.6%
- By 2100
- 340,698 · +3.0%
Race, ethnicity, and origin ACS 2023
- Neighborhood character
- Predominantly Black (68%)
- Race & ethnicity
- Black 68% White 19% Two or more races 6% Hispanic / Latino 5%
- Common ancestry
- Serbian 1% Slovak 1% Romanian 1%
- Foreign-born
- 3% · Canada
- Languages at home
- 95% English-only · Spanish 3% French/Haitian/Cajun 1%
Political lean MEDSL · Cumberland
- 2024 margin
- D (+13.4) · D 56.1% · R 42.7% · Other 1.2%
- 2008→2024 swing
- -4.3pp toward R · 2008: 17.7pp · 2024: 13.4pp
- All cycles
- 2024: D+13.4 2020: D+16.6 2016: D+16.0 2012: D+19.7 2008: D+17.7
Not yet ingested
- Civics
- —
Market trends
- HPI YoY
- ▼ -37.92%
- Current HPI
- 265.98
- Rent YoY
- ▲ 3.49%
- Metro
- Fayetteville, NC
- State GDP YoY
- ▲ 3.28%
- F500 in state
- 26
Industry mix (Fortune 500 HQ in NC)
| Industry | F500 HQs | Revenue |
|---|---|---|
| Financial Services | 2 | $213B |
|
||
| Retail | 2 | $95B |
|
||
| Industrial Conglomerate | 1 | $38B |
|
||
| Metals / Steel | 1 | $35B |
|
||
| Utilities | 1 | $30B |
|
||
| Industrial Machinery | 1 | $19B |
|
||
Price history
+332.3% since first listed12 events — show timeline
- 2026-05-22 Price Changed $134,000 TMLS
- 2026-04-13 Price Changed $138,000 TMLS
- 2026-03-26 Price Changed $149,000 TMLS
- 2026-02-26 Price Changed $155,000 TMLS
- 2026-02-10 Relisted — TMLS
- 2026-02-06 Listed $165,000 TMLS
- 2026-02-06 Listing Removed — TMLS
- 2025-12-29 Relisted — TMLS
- 2025-12-22 Pending — TMLS
- 2025-12-22 Listing Removed — TMLS
- 2025-11-20 Listed $165,000 TMLS
- 1995-12-07 Sold (Public Records) $31,000 Public Records
Property tax history
+6.7%/yrLatest (2025): $1,995 · +57.0% YoY. Source: county tax records.
Cash-flow waterfall
monthlySold comps — $/sqft
last 12 mo · ≤1 miLoading sold comps…