 🏷️ Likely Rental
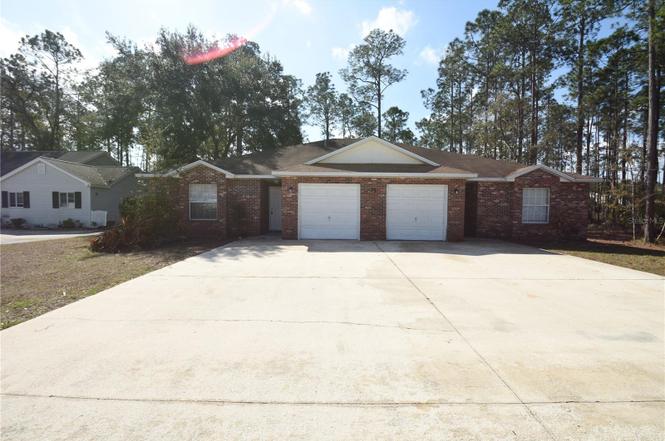
35 Brunswick Ln Unit A & B · Palm Coast, FL
Flood risk 1/10 · Minimal
- FEMA flood zone
- X (unshaded)
- Chance of flooding over 30 yrs
- 0.0%
- Est. flood insurance / yr
- $507 – $1,088
Fire risk 4/10 · Minor
- Est. fire insurance / yr
- $947 – $1,759
Heat risk 9/10 · Severe
- Hot days now (above 106°F)
- 7 days/yr
- Hot days in 30 yrs
- 20 days/yr
Wind risk 10/10 · Severe
- Chance of severe wind over 30 yrs
- 99.0%
Air-quality risk 2/10 · Minimal
- Unhealthy air days now
- 2 days/yr
- Unhealthy air days in 30 yrs
- 2 days/yr
Risk factors via First Street. Map © Google.
Why this score? — see what drove the D+ grade
The composite is a weighted blend of 9 inputs, each scored 0–100. Each bar is that input's sub-score; the figure is the points it added to the 100-point composite (weight × sub-score).
- ARV discount +15.0/15.0
- Cash flow +13.4/30.0
- Schools +4.6/10.0
- DSCR +4.0/10.0
- 1% rule +3.8/10.0
- Livability +3.5/5.0
- Rent growth +2.7/5.0
- Condition / age +2.5/5.0
- Appreciation +0.0/10.0
$425,000
🖨 Deal sheet (PDF) 📄 Offer letter ✓ Due diligence
Multi-family units
County records classify this as Multi-Family (5+ Unit). Listing-text estimate: 2 units. estimate disagrees with records
5+ unit building — per-unit beds/baths from public records are typically unavailable; the breakdown below (if shown) is an estimate from the listing text.
Listing remarks
Income-producing duplex in a prime central Palm Coast location—perfect for an owner occupant (live on one side and rent the other) or an investor (rent both). Projected gross annual income approximately $34,800. Conveniently located near the new Advent Health hospital, shopping, dining, and major intersections for easy commuting and strong tenant demand. Each side offers a spacious 3 bedroom / 2 bathroom layout with an expansive brick exterior. Side A features carpet; Side B is tile throughout. One HVAC was replaced in 2024; the other is original. Side B is currently tenant occupied at $1,450/month from 02/13/2026 through 01/31/2027 with a $2,500 security deposit. Side B is occupied f
Key facts
- Tenant occupied
- Value add potential
- Spacious layout
Tags
Property features AI
Finance
- Other: Zoned DPX; Development: Indian Trails
- Financial info: Estimated annual market income: $39,600; Annual net income: $34,800; Unit A pro forma rent: $1,400/month; Unit B pro forma rent: $1,450/month
- HOA & community: No association
Exterior
- Parking: Two garage spaces total; Each unit has 1 attached garage space
- Utilities: Public water; Public sewer; Broadband/high-speed internet available; Cable available; Sewer connected; Water connected
- Home design: Duplex residential income property; One building containing both units; Total living area reported as 2,728 sq ft; Total building area reported as 3,402 sq ft; Lot about 0.23 acre
- Construction: Brick and frame construction; Shingle roof; Slab foundation
- Exterior features: Private mailbox; Sliding doors; Paved road access
Interior
- Kitchen: Dishwasher; Range; Refrigerator
- Bedrooms: Two 3-bedroom units (one in each side)
- Bathrooms: Each unit has 2 bathrooms
- Heating & cooling: Central heating; Electric heating; Heat pump; Central air conditioning
- Interior features: Open floorplan; Thermostat; Walk-in closets
- Laundry & utility: Inside laundry
Neighborhood map
What this means for you Summary
Snapshot
- This is a 2 × 3-bed/2.0-bath units multifamily listed at $425k.
Deal economics
- At list price, monthly cash flow is $6 ($78/yr) — positive. Per door: $3/mo.
- The deal already cash-flows at list — no discount required.
- To meet the 1% rule (rent ≥ 1% of price), the offer needs to be $373k (12.3% below list).
- Recommended offer: $373k (12.3% below list) — sets the bar for 1% rule.
- Cap rate 6.3% vs local median 3.8% in Palm Coast — top-decile yield for the area; either an underpriced asset or a hidden risk that comps aren't pricing in. Stress-test before assuming the spread holds.
Location & tenants
- Location reads 69/100 on livability (#478 in FL) — a middle-class / working-renter tenant base. Strengths: housing A+, health & safety A+, cost of living B+; Watch: amenities F, commute F.
- Flagler (rural): math 53% / reading 56% proficiency, ranked #20 of 73 in FL (top 27%) — acceptable for families but not a draw, mixed tenant base, ~2y average lease.
- Zoned schools: Belle Terre Elementary School (math 64% / reading 64%, grade B, #552 of 2,144 statewide, top 26%, 1,190 students, 58% FRL); Indian Trails Middle School (math 64% / reading 59%, grade B+, #124 of 571 statewide, top 22%, 1,518 students, 50% FRL); Matanzas High School (math 36% / reading 53%, grade F, #237 of 667 statewide, top 36%, 1,978 students, 48% FRL) — zoned schools at 52% FRL track the district average.
- Market conditions: Rents flat; 1616 active listings in the ZIP; solid renter incomes; 2,588 units permitted in Flagler County in 2024 (0 in 5+ unit buildings).
- At $3,726/mo this rent would consume 53% of the median local household income ($84k/yr) (locally 816% of renters already pay >50% of income on rent) — very limited rent-growth headroom before tenants either downsize or default.
Forward outlook
- Local home prices are declining (-3.0%/yr); year-one equity from $3k of loan paydown is wiped out by about $13k of value loss. Plan a longer hold.
- Flagler County population projected at +28% by 2050 — long-run rental-demand tailwind backs the buy-and-hold thesis.
Negotiation context
- It's been on market 117 days — a 9% lower offer ($387k) is reasonable based on typical stale-listing flexibility.
- 3 sale attempts with the ask held roughly flat each time — persistent listings suggest the price (not the market) is what's stuck; bring a comps-based counter.
Risks & watch-outs
- Climate carrying-cost: severe wind risk, 99% chance of damaging wind over 30y; extreme-heat days projected 7→20/yr by 2055 (HVAC capex compounding) — expect insurance premiums to compound above CPI over the hold.
Questions for the listing agent
- It's been on market 117 days. Have you received any prior offers? Is the seller open to a 12% concession, seller financing, or rate buy-down credit?
- Can we see the unit-by-unit rent roll, current vacancy, and any below-market leases? What's the average tenancy length?
- What capital expenditures (roof, boiler, parking lot, exteriors) have been made in the last 5 years, and what's planned in the next 2?
- Why hasn't it sold? Are there any deal-killer items the seller is aware of (foundation, flood, title, zoning, code violations)?
- Is there a deadline driving the sale (1031 exchange, divorce, estate, relocation)? That informs how much negotiation room exists.
- The area grade is low — what's the realistic commute time and amenity access for the typical tenant pool here? Any planned neighborhood developments (good or bad) we should know about?
- What's the average days-on-market for RENTAL listings here right now (not sales)? A rising rental-DOM trend means longer vacancies and softer asking-rent achievability than the comps imply.
- What's the recent tenant-quality profile in this submarket — average credit score on applications, eviction rate, late-payment / NSF rate, and stable-employment percentage? A property-management company in the area should have these aggregated.
- How much new apartment / multifamily construction is in the pipeline within 1–3 miles? Heavy new supply (>2% of stock underway) typically softens rents 12–24 months out; light construction supports rent growth.
Investment metrics
- 1% rule
- 0.88% ✗
- Cap rate
- 6.31%
- Cash-on-cash
- 0.07%
- DSCR
- 1.00
- GRM
- 9.5
CMA / ARV
- ARV (on-the-fly)
- $531,960
- Comps found
- 6
Show comp detail 6 sales within ~0.75 mi
| Address | Dist | Beds/Ba | Sqft | Sold | Price | $/sf | Match |
|---|---|---|---|---|---|---|---|
| 133 Brunswick Ln | 0.41mi | 6/4.0 | 2,613 (-4%) | 2mo | $460,000 | $176 | 72 |
| 47 Wellwood Ln | 0.33mi | 6/4.0 | 2,649 (-3%) | 13mo | $410,000 | $155 | 69 |
| 29 Brunswick Ln Unit A | 0.03mi | 6/6.0 | 2,564 (-6%) | 14mo | $385,000 | $150 | 69 |
| 91 Brunswick Ln | 0.24mi | 6/4.0 | 2,422 (-11%) | 7mo | $480,000 | $198 | 65 |
| 35 Wellham Ln | 0.27mi | 6/4.0 | 2,596 (-5%) | 23mo | $529,980 | $204 | 60 |
| 104 Wellwood Ln | 0.28mi | 6/4.0 | 2,956 (+8%) | 17mo | $575,000 | $195 | 59 |
Match score weights: distance 35% · size 25% · config 20% · recency 20%. Top-matched comps best support the ARV.
Projected returns pro-forma
-3.0% appreciation · 0.85% rent growth · sell at horizon
- IRR
- -18.6%
- Equity multiple
- 0.36×
- Total profit
- $-76,292
- Equity at exit
- $63,369
- IRR
- -16.0%
- Equity multiple
- 0.19×
- Total profit
- $-96,690
- Equity at exit
- $36,746
Cash invested: $119,000 (down + closing). Projections, not guarantees.
Landlord ↔ Tenant lean methodology
- Overall (STATE)
- 87 Strongly Landlord-Friendly
- State Florida
- 87 Strongly Landlord-Friendly · R+3
- County
- — inherits STATE
- City
- — inherits STATE
ZIP-level market 32137
- Home prices YoY
- -34.5%
- Rents YoY
- 0.8%
- Active inventory
- 1616
- Price-to-rent
- 19.0×
Monthly cashflow live
- Estimated rent
- $3,726 high interval (Pro) →
- Mortgage (P&I)
- −$2,229
- Tax est. 1.5%
- −$531 /mo · $6,375/yr
- Insurance
- −$177
- HOA
- −$0
- Vacancy / Maint / Mgmt
- −$782
- Net cashflow
- $6
Break-even live
Sensitivity live
| Price | -10% $300 | -5% $153 | +0% $6 | +5% $-140 | +10% $-287 |
|---|---|---|---|---|---|
| Rent | -10% $-288 | -5% $-141 | +0% $6 | +5% $154 | +10% $301 |
| Rate | -1.0pp $220 | -0.5pp $115 | base $6 | +0.5pp $-104 | +1.0pp $-216 |
2-unit breakdown (identical units grouped — click to expand)
| Units | Beds | Baths | Est. rent |
|---|---|---|---|
| 2× units | 3 | 2 | $3,726 |
| #1 | 3 | 2 | $1,863 |
| #2 | 3 | 2 | $1,863 |
| Total (2 units) | $3,726 | ||
UW: 25.0% down · 7.5% · 30yr · 1.5% tax · 5.0% vac · 8.0% maint · 8.0% mgmt
Financing live
Cash to close
- Down payment
- $106,250
- Closing costs
- $12,750
- Reserves months
- —
- Total cash needed
- —
Loan-product check · same deal, 3 products live
Conventional
25% down · 7.5% · 30yr
- Down + closing
- —
- Monthly P&I
- —
- Monthly cashflow
- —
- DSCR
- —
- Eligible?
- —
Personal DTI + credit; lowest rate.
DSCR
20% down · 8.5% · 30yr
- Down + closing
- —
- Monthly P&I
- —
- Monthly cashflow
- —
- DSCR
- —
- Eligible?
- —
No personal income docs; deal must DSCR.
Hard money
10% down · 12.0% · 12mo
- Down + closing
- —
- Monthly P&I
- —
- Monthly cashflow
- —
- DSCR
- —
- Eligible?
- —
Short-term bridge; refi at stabilization.
Listing history 22 events
-
2026-06-21days on market $425,000 Active 117 DOM
-
2026-06-18days on market $425,000 Active 114 DOM
-
2026-06-17days on market $425,000 Active 113 DOM
-
2026-06-16days on market $425,000 Active 112 DOM
-
2026-06-15days on market $425,000 Active 111 DOM
-
2026-06-14days on market $425,000 Active 109 DOM
-
2026-06-13days on market $425,000 Active 108 DOM
-
2026-06-10days on market $425,000 Active 106 DOM
-
2026-06-09days on market $425,000 Active 105 DOM
-
2026-06-08days on market $425,000 Active 104 DOM
-
2026-06-07days on market $425,000 Active 103 DOM
-
2026-06-03days on market $425,000 Active 99 DOM
-
2026-06-02days on market $425,000 Active 98 DOM
-
2026-06-01days on market $425,000 Active 97 DOM
-
2026-05-31days on market $425,000 Active 96 DOM
-
2026-02-24$425,000 Active
-
2026-02-15historical $1,450
-
2026-02-05price $1,450
-
2025-12-27$1,500
-
2025-11-28historical $1,500
-
2025-11-06price $1,500
-
2025-10-25$1,550
ⓘ Source: listings_history table (triggers on properties + properties_extension) + one-shot
backfill from property_details.listing_events for pre-trigger history.
Climate risk First Street
- Flood 1/10 Low FEMA zone X (unshaded) · 0% chance over 30 yrs
- Wildfire 4/10 Moderate
- Heat 9/10 Extreme 7 d/yr ≥106°F today · 20 d/yr by 30 yrs out
- Wind 10/10 Extreme 99% chance of damaging wind over 30 yrs
- Air quality 2/10 Low 2 unhealthy d/yr today · 2 by 30 yrs out
Nearby sold comps map
Loading sold comps map…
Walkable amenities ~0.75 mi
Loading nearby amenities…
Taxation est. · year 1
- Rental income
- $44,712
- − Mortgage interest
- −$23,807
- − Property taxes
- −$6,375
- − Insurance
- −$2,125
- − Repairs & maintenance
- −$3,577
- − Management
- −$3,577
- − Depreciation
- −$12,364
- Taxable loss
- −$7,112
- Est. tax savings @ 24.0%
- +$1,707
- After-tax cash flow
- $1,784/yr
For passive investors: Depreciation is non-cash, so a rental often shows a tax loss while cash-flowing — sheltering income. Rental losses are passive: they offset passive income freely, and up to $25,000/yr can offset ordinary (W-2) income if you actively participate and your MAGI is under $100k (phasing out to $0 by $150k); unused losses carry forward. On sale, claimed depreciation is recaptured at up to 25%, and gains may owe capital-gains tax (a 1031 exchange can defer both). Figures are a year-1 estimate at your 24.0% rate — not tax advice; consult a CPA.
Schools (NCES district)
- District
- Flagler
- NCES district ID
- 1200540
- Math proficiency
- 53% ▼ -9.00%
- Reading proficiency
- 56% ▼ -4.00%
- Median HH income
- $48,354
- Composite
- 46.35/100
- National rank
- #2464
- State rank
- #20 of 73 in FL
Livability — Palm Coast
- Score
- 69/100
- State rank
- #478
- US rank
- #8721
Category grades
Schools grade is shown separately in the Schools card above.
Census & demographics
- Census place
- Palm Coast, FL
- County
- Flagler County · 113,412 people
- City population
- 105,049
- Metro
- Deltona-Daytona Beach-Ormond Beach, FL
- Population (ZIP)
- 48,391
- Household income
- $83,923
- Rent vs Own
- Severe rent burden
- 816.0
Population outlook (Flagler County) Hauer SSP2
- Today (2025)
- 123,474 people
- By 2030
- 131,864 · +6.8%
- By 2040
- 146,176 · +18.4%
- By 2050
- 157,398 · +27.5%
- By 2075
- 177,990 · +44.2%
- By 2100
- 183,381 · +48.5%
Race, ethnicity, and origin ACS 2023
- Neighborhood character
- Predominantly White (77%)
- Race & ethnicity
- White 77% Hispanic / Latino 10% Two or more races 8% Black 6% Asian 3%
- Hispanic origin (detail)
- Puerto Rican 4% Cuban 1%
- Common ancestry
- Romanian 4% Russian 2% Lithuanian 2%
- Foreign-born
- 13% · Canada, Jamaica
- Languages at home
- 85% English-only · Spanish 7% Other Indo-European 3% Russian/Polish/Slavic 2%
Political lean MEDSL · Flagler
- 2024 margin
- Strong R (+28.2) · D 35.6% · R 63.8%
- 2008→2024 swing
- -29.8pp toward R · 2008: 1.6pp · 2024: -28.2pp
- All cycles
- 2024: R+28.2 2020: R+20.8 2016: R+20.6 2012: R+7.4 2008: D+1.6
Not yet ingested
- Civics
- —
Market trends
- HPI YoY
- ▼ -153.27%
- Current HPI
- 290.4607
- Rent YoY
- ▲ 0.85%
- Metro
- Deltona-Daytona Beach-Ormond Beach, FL
- State GDP YoY
- ▲ 3.28%
- F500 in state
- 36
Industry mix (Fortune 500 HQ in FL)
| Industry | F500 HQs | Revenue |
|---|---|---|
| Industrial Technology | 2 | $29B |
|
||
| Insurance | 2 | $17B |
|
||
| Retail | 1 | $60B |
|
||
| Technology Distribution | 1 | $58B |
|
||
| Homebuilding | 1 | $35B |
|
||
| Technology Manufacturing | 1 | $35B |
|
||
Price history
+27319.4% since first listed7 events — show timeline
- 2026-02-24 Listed $425,000 Stellar MLS as Distributed by MLS Grid
- 2026-02-15 Rental Removed $1,450 APPFOLIO
- 2026-02-05 Price Changed $1,450 APPFOLIO
- 2025-12-27 Listed for Rent $1,500 APPFOLIO
- 2025-11-28 Rental Removed $1,500 APPFOLIO
- 2025-11-06 Price Changed $1,500 APPFOLIO
- 2025-10-25 Listed for Rent $1,550 APPFOLIO
Cash-flow waterfall
monthlySold comps — $/sqft
last 12 mo · ≤1 miLoading sold comps…