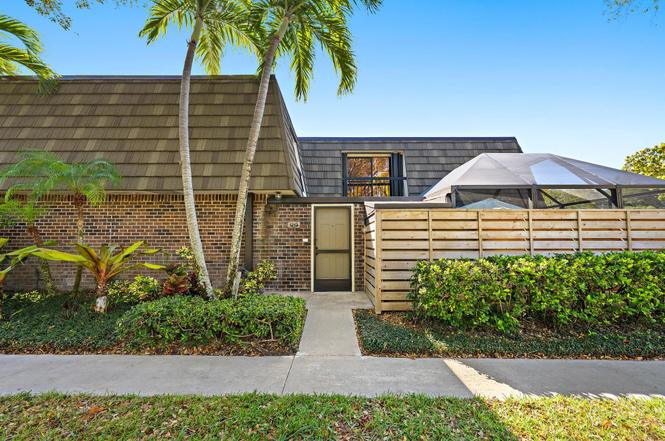
1213 12th Ter #1213 · Palm Beach Gardens, FL
Flood risk 1/10 · Minimal
- FEMA flood zone
- X (unshaded)
- Chance of flooding over 30 yrs
- 0.0%
- Est. flood insurance / yr
- $507 – $1,088
Fire risk 2/10 · Minimal
- Est. fire insurance / yr
- $947 – $1,759
Heat risk 10/10 · Severe
- Hot days now (above 106°F)
- 7 days/yr
- Hot days in 30 yrs
- 24 days/yr
Wind risk 10/10 · Severe
- Chance of severe wind over 30 yrs
- 99.0%
Air-quality risk 2/10 · Minimal
- Unhealthy air days now
- 0 days/yr
- Unhealthy air days in 30 yrs
- 1 days/yr
Risk factors via First Street. Map © Google.
Why this score? — see what drove the D- grade
The composite is a weighted blend of 9 inputs, each scored 0–100. Each bar is that input's sub-score; the figure is the points it added to the 100-point composite (weight × sub-score).
- Cash flow +10.7/30.0
- ARV discount +7.5/15.0
- 1% rule +4.8/10.0
- Schools +4.3/10.0
- Livability +3.5/5.0
- DSCR +3.1/10.0
- Rent growth +3.0/5.0
- Condition / age +2.5/5.0
- Appreciation +0.0/10.0
$379,000
🖨 Deal sheet (PDF) 📄 Offer letter ✓ Due diligence
Listing remarks
Welcome to this beautifully renovated 2-bedroom, 2.5-bath townhouse located in the desirable Glenwood community of PGA National. Thoughtfully updated throughout, this home offers the perfect blend of modern style and everyday comfort. The open-concept layout features a brand-new kitchen, new flooring, and new ceiling fans (2025), creating a fresh and contemporary feel. Both bathrooms have been tastefully updated, and the home showcases newer tile floors upstairs and down, fresh interior paint, and new siding for added curb appeal. Enjoy seamless indoor-outdoor living in the fully redone screened and fenced patio -- ideal for relaxing or entertaining. Additional upgrades include newer kitche
Key facts
- Renovated townhouse
- Brand new kitchen
- New flooring
Tags
Property features AI
Finance
- Other: Pets allowed with restrictions and limits
- HOA & community: Community amenities: jogging path, park, playground, pool, tennis courts, pickleball courts, sidewalks, street lights; HOA dues paid monthly
Exterior
- Parking: Assigned parking; Guest parking (2 open spaces)
- Security: Gated community with guard; Security patrol
- Utilities: Public water; Public sewer; Three-phase electric; Sewer and water available
- Home design: Townhouse; Multi/split levels (2 stories); Faces east; Resale property
- Construction: CBS construction; Mansard roof
- Exterior features: Covered patio; Screened porch; Patio; Porch; Not waterfront
Interior
- Kitchen: Dishwasher; Electric range; Microwave; Refrigerator
- Bedrooms: No main-level bedrooms
- Bathrooms: 2 full bathrooms and 1 half bathroom
- Interior features: Built-in features; Blinds
- Laundry & utility: Inside laundry; Electric water heater
Neighborhood map
What this means for you Summary
Snapshot
- This is a 2-bed/2.5-bath townhouse listed at $379k.
Deal economics
- At list price, monthly cash flow is $-179 ($-2k/yr) — negative.
- To cash-flow at today's rent, offer at most $353k (6.8% below list).
- To meet the 1% rule (rent ≥ 1% of price), the offer needs to be $371k (2.2% below list).
- Recommended offer: $345k (9.0% below list) — sets the bar for market timing.
Location & tenants
- Location reads 69/100 on livability (#464 in FL) — a middle-class / working-renter tenant base. Strengths: crime A+, employment A+, housing A+; Watch: amenities F, commute F, cost of living F.
- Palm Beach (suburban): math 46% / reading 53% proficiency, ranked #34 of 73 in FL (top 47%) — families likely to look elsewhere, expect single-tenant / working-renter base with shorter leases.
- Zoned schools: Timber Trace Elementary School (math 76% / reading 79%, grade A, #163 of 2,144 statewide, top 8%, 825 students, 34% FRL); Watson B. Duncan Middle School (math 54% / reading 59%, grade B, #171 of 571 statewide, top 30%, 1,157 students, 41% FRL); Palm Beach Gardens High School (math 19% / reading 40%, grade F, #447 of 667 statewide, top 68%, 2,570 students, 61% FRL).
- Market conditions: Rents rising (+2.0%/yr); 542 active listings in the ZIP; 40 comparable units currently listed for rent nearby; rentals at typical pace (median 26d on market — plan ~3-4 weeks tenant-placement turnaround); high-income renter base; 3,974 units permitted in Palm Beach County in 2024 (1,012 in 5+ unit buildings).
- This rent runs 35% of the median local income ($125k/yr) — at the standard rent-burdened threshold; future hikes will face affordability resistance.
Forward outlook
- Local home prices are declining (-3.0%/yr); year-one equity from $3k of loan paydown is wiped out by about $11k of value loss. Plan a longer hold.
- Palm Beach County population projected at +30% by 2050 — long-run rental-demand tailwind backs the buy-and-hold thesis.
Negotiation context
- It's been on market 115 days — a 9% lower offer ($345k) is reasonable based on typical stale-listing flexibility.
- 2 sale attempts since 2y ago with the ask held roughly flat each time — persistent listings suggest the price (not the market) is what's stuck; bring a comps-based counter.
Risks & watch-outs
- Climate carrying-cost: severe wind risk, 99% chance of damaging wind over 30y; extreme-heat days projected 7→24/yr by 2055 (HVAC capex compounding) — expect insurance premiums to compound above CPI over the hold.
Questions for the listing agent
- What do current leases actually rent for vs. the listed asking? Can we see a recent rent roll and the last 12 months of T-12 income?
- It's been on market 115 days. Have you received any prior offers? Is the seller open to a 9% concession, seller financing, or rate buy-down credit?
- What does the HOA fee cover, when was the last increase, and are there any pending special assessments or reserve-fund shortfalls?
- Why hasn't it sold? Are there any deal-killer items the seller is aware of (foundation, flood, title, zoning, code violations)?
- Is there a deadline driving the sale (1031 exchange, divorce, estate, relocation)? That informs how much negotiation room exists.
- Schools are B-rated — typically a magnet for longer-tenancy family renters. What's the average tenant stay here, and is there a school-zone premium baked into asking?
- The area grade is low — what's the realistic commute time and amenity access for the typical tenant pool here? Any planned neighborhood developments (good or bad) we should know about?
- What's the average days-on-market for RENTAL listings here right now (not sales)? A rising rental-DOM trend means longer vacancies and softer asking-rent achievability than the comps imply.
- What's the recent tenant-quality profile in this submarket — average credit score on applications, eviction rate, late-payment / NSF rate, and stable-employment percentage? A property-management company in the area should have these aggregated.
- How much new for-sale + rental construction is in the pipeline within 1–3 miles? Heavy new supply typically softens prices + rents 12–24 months out; constrained supply supports both.
Investment metrics
- 1% rule
- 0.98% ✗
- Cap rate
- 5.73%
- Cash-on-cash
- -2.02%
- DSCR
- 0.91
- GRM
- 8.5
CMA / ARV
No comps found within radius.
Projected returns pro-forma
-3.0% appreciation · 2.0% rent growth · sell at horizon
- IRR
- -20.9%
- Equity multiple
- 0.28×
- Total profit
- $-76,151
- Equity at exit
- $56,510
- IRR
- -16.9%
- Equity multiple
- 0.11×
- Total profit
- $-94,394
- Equity at exit
- $32,769
Cash invested: $106,120 (down + closing). Projections, not guarantees.
Landlord ↔ Tenant lean methodology
- Overall (STATE)
- 87 Strongly Landlord-Friendly
- State Florida
- 87 Strongly Landlord-Friendly · R+3
- County
- — inherits STATE
- City
- — inherits STATE
ZIP-level market 33418
- Home prices YoY
- -32.4%
- Rents YoY
- 2.0%
- Active inventory
- 542
- Price-to-rent
- 8.5×
Monthly cashflow live
- Estimated rent
- $3,705 high interval (Pro) →
- Mortgage (P&I)
- −$1,988
- Tax est. 1.5%
- −$474 /mo · $5,685/yr
- Insurance
- −$158
- HOA
- −$487
- Vacancy / Maint / Mgmt
- −$778
- Net cashflow
- $-179
Break-even live
Sensitivity live
| Price | -10% $83 | -5% $-48 | +0% $-179 | +5% $-310 | +10% $-441 |
|---|---|---|---|---|---|
| Rent | -10% $-472 | -5% $-325 | +0% $-179 | +5% $-33 | +10% $114 |
| Rate | -1.0pp $12 | -0.5pp $-83 | base $-179 | +0.5pp $-277 | +1.0pp $-377 |
UW: 25.0% down · 7.5% · 30yr · 1.5% tax · 5.0% vac · 8.0% maint · 8.0% mgmt
Financing live
Cash to close
- Down payment
- $94,750
- Closing costs
- $11,370
- Reserves months
- —
- Total cash needed
- —
Loan-product check · same deal, 3 products live
Conventional
25% down · 7.5% · 30yr
- Down + closing
- —
- Monthly P&I
- —
- Monthly cashflow
- —
- DSCR
- —
- Eligible?
- —
Personal DTI + credit; lowest rate.
DSCR
20% down · 8.5% · 30yr
- Down + closing
- —
- Monthly P&I
- —
- Monthly cashflow
- —
- DSCR
- —
- Eligible?
- —
No personal income docs; deal must DSCR.
Hard money
10% down · 12.0% · 12mo
- Down + closing
- —
- Monthly P&I
- —
- Monthly cashflow
- —
- DSCR
- —
- Eligible?
- —
Short-term bridge; refi at stabilization.
Rent comps 40 comps
| Address | Beds | Baths | Sqft | Rent | $/sqft | DOM | Units | Dist |
|---|---|---|---|---|---|---|---|---|
| 1410 14th Ter #1410 Palm Beach Gardens, FL | 2.0 | 2.5 | 1488 | $3,000 | $2.02 | 26d | 1 | 0.05mi |
| 1424 14th Ter Unit 1424 Palm Beach Gardens, FL | 3.0 | 2.5 | 1488 | $3,000 | $2.02 | 26d | 1 | 0.05mi |
| 227 2nd Ter Palm Beach Gardens, FL | 2.0 | 2.5 | 1488 | $2,750 | $1.85 | 3d | 1 | 0.08mi |
| 1520 15th Ter Palm Beach Gardens, FL | 3.0 | 2.5 | 1488 | $2,950 | $1.98 | 12d | 1 | 0.11mi |
| 1608 16th Ter Palm Beach Gardens, FL | 3.0 | 2.5 | 1488 | $3,300 | $2.22 | 3d | 1 | 0.14mi |
| 1608 16th Ter Palm Beach Gardens, FL | 3.0 | 2.5 | 1488 | $3,300 | $2.22 | 26d | 1 | 0.14mi |
| 1608 16th Ter Palm Beach Gardens, FL | 3.0 | 2.5 | 1488 | $3,300 | $2.22 | 1d | 1 | 0.14mi |
| 1608 16th Ter Palm Beach Gardens, FL | 3.0 | 2.5 | 1488 | $3,300 | $2.22 | 22d | 1 | 0.14mi |
| 118 1st Ter Palm Beach Gardens, FL | 2.0 | 2.5 | 1488 | $3,200 | $2.15 | 26d | 1 | 0.16mi |
| 502 5th Ter Palm Beach Gardens, FL | 2.0 | 2.5 | 1488 | $3,250 | $2.18 | 26d | 1 | 0.18mi |
| 107 Resort Ln Palm Beach Gardens, FL | 3.0 | 2.5 | 1710 | $11,000 | $6.43 | 26d | 1 | 0.23mi |
| 401 Resort Ln Palm Beach Gardens, FL | 3.0 | 2.5 | 1710 | $9,600 | $5.61 | 26d | 1 | 0.28mi |
| 103 Old Meadow Way Palm Beach Gardens, FL | 2.0 | 2.0 | 1491 | $3,600 | $2.41 | 15d | 1 | 0.31mi |
| 229 Old Meadow Way Palm Beach Gardens, FL | 3.0 | 3.0 | 1694 | $4,500 | $2.66 | 26d | 1 | 0.33mi |
| 135 Old Meadow Way Palm Beach Gardens, FL | 2.0 | 2.0 | 1418 | $6,000 | $4.23 | 26d | 1 | 0.34mi |
| 150 Old Meadow Way Palm Beach Gardens, FL | 2.0 | 2.0 | 1418 | $6,999 | $4.94 | 22d | 1 | 0.35mi |
| 204 Old Meadow Way Palm Beach Gardens, FL | 2.0 | 2.0 | 1491 | $4,100 | $2.75 | 26d | 1 | 0.38mi |
| 265 Old Meadow Way Palm Beach Gardens, FL | 2.0 | 2.0 | 1491 | $3,400 | $2.28 | 26d | 1 | 0.40mi |
| 112 Club Dr Palm Beach Gardens, FL | 2.0 | 2.0 | 1135 | $2,800 | $2.47 | 26d | 1 | 0.41mi |
| 112 Club Dr #112 Palm Beach Gardens, FL | 2.0 | 2.0 | 1156 | $2,850 | $2.47 | 14d | 1 | 0.41mi |
| 293 Old Meadow Way Palm Beach Gardens, FL | 3.0 | 3.0 | 1694 | $6,000 | $3.54 | 26d | 1 | 0.41mi |
| 105 Club Dr #105 Palm Beach Gardens, FL | 2.0 | 2.0 | 1135 | $10,000 | $8.81 | 23d | 1 | 0.45mi |
| 305 Club Dr Palm Beach Gardens, FL | 2.0 | 2.0 | 1135 | $2,750 | $2.42 | 26d | 1 | 0.45mi |
| 311 Club Dr Palm Beach Gardens, FL | 2.0 | 2.0 | 1135 | $6,500 | $5.73 | 26d | 1 | 0.46mi |
| 206 Club Dr Palm Beach Gardens, FL | 2.0 | 2.0 | 1135 | $5,000 | $4.41 | 26d | 1 | 0.52mi |
| 26 Via Aurelia Palm Beach Gardens, FL | 3.0 | 2.5 | 1830 | $8,500 | $4.64 | 26d | 1 | 0.52mi |
| 116 Coral Cay Dr Palm Beach Gardens, FL | 2.0 | 2.0 | 1752 | $7,000 | $4.00 | 26d | 1 | 0.54mi |
| 515 Club Dr Palm Beach Gardens, FL | 2.0 | 2.0 | 1135 | $5,000 | $4.41 | 26d | 1 | 0.54mi |
| 402 Club Dr Palm Beach Gardens, FL | 2.0 | 2.0 | 1135 | $7,500 | $6.61 | 26d | 1 | 0.55mi |
| 913 Club Dr Palm Beach Gardens, FL | 2.0 | 2.0 | 1135 | $3,500 | $3.08 | 26d | 1 | 0.55mi |
| 915 Club Dr Palm Beach Gardens, FL | 2.0 | 2.0 | 1135 | $4,500 | $3.96 | 26d | 1 | 0.56mi |
| 406 Club Dr Palm Beach Gardens, FL | 2.0 | 2.0 | 1135 | $7,000 | $6.17 | 26d | 1 | 0.56mi |
| 523 Club Dr Palm Beach Gardens, FL | 2.0 | 2.0 | 1135 | $3,500 | $3.08 | 22d | 1 | 0.57mi |
| 706 Club Dr Palm Beach Gardens, FL | 2.0 | 2.0 | 1135 | $2,700 | $2.38 | 7d | 1 | 0.58mi |
| 533 Club Dr Palm Beach Gardens, FL | 2.0 | 2.0 | 1135 | $3,000 | $2.64 | 23d | 1 | 0.60mi |
| 615 Club Dr Palm Beach Gardens, FL | 2.0 | 2.0 | 1135 | $6,000 | $5.29 | 26d | 1 | 0.64mi |
| 11 Ironwood Way N Palm Beach Gardens, FL | 3.0 | 2.0 | 1573 | $4,800 | $3.05 | 26d | 1 | 0.64mi |
| 836 Club Dr Palm Beach Gardens, FL | 2.0 | 2.0 | 1135 | $8,450 | $7.44 | 1d | 1 | 0.65mi |
| 811 Club Dr Palm Beach Gardens, FL | 2.0 | 2.0 | 1135 | $9,000 | $7.93 | 26d | 1 | 0.66mi |
| 36 Ironwood Way N Unit 36 Palm Beach Gardens, FL | 3.0 | 2.0 | 1480 | $6,500 | $4.39 | 26d | 1 | 0.67mi |
HOA detail
- Monthly dues
- $487 · $5,844/yr
Listing history 18 events
-
2026-06-21days on market $379,000 Active 115 DOM
-
2026-06-18days on market $379,000 Active 112 DOM
-
2026-06-17days on market $379,000 Active 111 DOM
-
2026-06-16days on market $379,000 Active 110 DOM
-
2026-06-15days on market $379,000 Active 109 DOM
-
2026-06-13days on market $379,000 Active 107 DOM
-
2026-06-09days on market $379,000 Active 103 DOM
-
2026-06-08days on market $379,000 Active 102 DOM
-
2026-06-07days on market $379,000 Active 101 DOM
-
2026-06-04days on market $379,000 Active 98 DOM
-
2026-06-03days on market $379,000 Active 97 DOM
-
2026-06-02days on market $379,000 Active 96 DOM
-
2026-06-01days on market $379,000 Active 95 DOM
-
2026-05-31days on market $379,000 Active 94 DOM
-
2026-02-23$379,000 Active
-
2024-02-07historical
-
2024-01-24price $404,000
-
2024-01-04$419,000 Active
ⓘ Source: listings_history table (triggers on properties + properties_extension) + one-shot
backfill from property_details.listing_events for pre-trigger history.
Climate risk First Street
- Flood 1/10 Low FEMA zone X (unshaded) · 0% chance over 30 yrs
- Wildfire 2/10 Low
- Heat 10/10 Extreme 7 d/yr ≥106°F today · 24 d/yr by 30 yrs out
- Wind 10/10 Extreme 99% chance of damaging wind over 30 yrs
- Air quality 2/10 Low 0 unhealthy d/yr today · 1 by 30 yrs out
Nearby sold comps map
Loading sold comps map…
Walkable amenities ~0.75 mi
Loading nearby amenities…
Taxation est. · year 1
- Rental income
- $44,464
- − Mortgage interest
- −$21,230
- − Property taxes
- −$5,685
- − Insurance
- −$1,895
- − Repairs & maintenance
- −$3,557
- − Management
- −$3,557
- − HOA
- −$5,844
- − Depreciation
- −$11,025
- Taxable loss
- −$8,330
- Est. tax savings @ 24.0%
- +$1,999
- After-tax cash flow
- $-149/yr
For passive investors: Depreciation is non-cash, so a rental often shows a tax loss while cash-flowing — sheltering income. Rental losses are passive: they offset passive income freely, and up to $25,000/yr can offset ordinary (W-2) income if you actively participate and your MAGI is under $100k (phasing out to $0 by $150k); unused losses carry forward. On sale, claimed depreciation is recaptured at up to 25%, and gains may owe capital-gains tax (a 1031 exchange can defer both). Figures are a year-1 estimate at your 24.0% rate — not tax advice; consult a CPA.
Schools (NCES district)
- District
- Palm Beach
- NCES district ID
- 1201500
- Math proficiency
- 46% ▼ -16.00%
- Reading proficiency
- 53% ▼ -4.00%
- Median HH income
- $53,943
- Composite
- 42.72/100
- National rank
- #3160
- State rank
- #34 of 73 in FL
Livability — Palm Beach Gardens
- Score
- 69/100
- State rank
- #464
- US rank
- #8366
Category grades
Schools grade is shown separately in the Schools card above.
Census & demographics
- Census place
- Palm Beach Gardens, FL
- County
- Palm Beach County · 1,438,312 people
- City population
- 96,294
- Metro
- Miami-Fort Lauderdale-Pompano Beach, FL
- Population (ZIP)
- 43,676
- Household income
- $125,497
- Rent vs Own
- Severe rent burden
- 1339.0
Population outlook (Palm Beach County) Hauer SSP2
- Today (2025)
- 1,637,487 people
- By 2030
- 1,743,255 · +6.5%
- By 2040
- 1,948,712 · +19.0%
- By 2050
- 2,132,979 · +30.3%
- By 2075
- 2,530,027 · +54.5%
- By 2100
- 2,706,979 · +65.3%
Race, ethnicity, and origin ACS 2023
- Neighborhood character
- Predominantly White (75%)
- Race & ethnicity
- White 75% Hispanic / Latino 13% Two or more races 9% Black 5% Asian 4%
- Hispanic origin (detail)
- Mexican 2% Puerto Rican 2% Cuban 2%
- Common ancestry
- Romanian 5% Lithuanian 4% Scotch-Irish 4%
- Foreign-born
- 15% · Canada, China, Jamaica
- Languages at home
- 83% English-only · Spanish 8% German/W. Germanic 2% Other Indo-European 2%
Political lean MEDSL · Palm Beach
- 2024 margin
- Toss-up / Even · D 50.0% · R 49.2%
- 2008→2024 swing
- -22.1pp toward R · 2008: 22.9pp · 2024: 0.8pp
- All cycles
- 2024: D+0.8 2020: D+12.8 2016: D+15.3 2012: D+17.0 2008: D+22.9
Not yet ingested
- Civics
- —
Market trends
- HPI YoY
- ▼ -172.79%
- Current HPI
- 361.1997
- Rent YoY
- ▲ 2.00%
- Metro
- Miami-Fort Lauderdale-Pompano Beach, FL
- State GDP YoY
- ▲ 3.28%
- F500 in state
- 36
Industry mix (Fortune 500 HQ in FL)
| Industry | F500 HQs | Revenue |
|---|---|---|
| Industrial Technology | 2 | $29B |
|
||
| Insurance | 2 | $17B |
|
||
| Retail | 1 | $60B |
|
||
| Technology Distribution | 1 | $58B |
|
||
| Homebuilding | 1 | $35B |
|
||
| Technology Manufacturing | 1 | $35B |
|
||
Price history
-9.5% since first listed4 events — show timeline
- 2026-02-23 Listed $379,000 Beaches MLS
- 2024-02-07 Listing Removed — Beaches MLS
- 2024-01-24 Price Changed $404,000 Beaches MLS
- 2024-01-04 Listed $419,000 Beaches MLS
Cash-flow waterfall
monthlySold comps — $/sqft
last 12 mo · ≤1 miLoading sold comps…