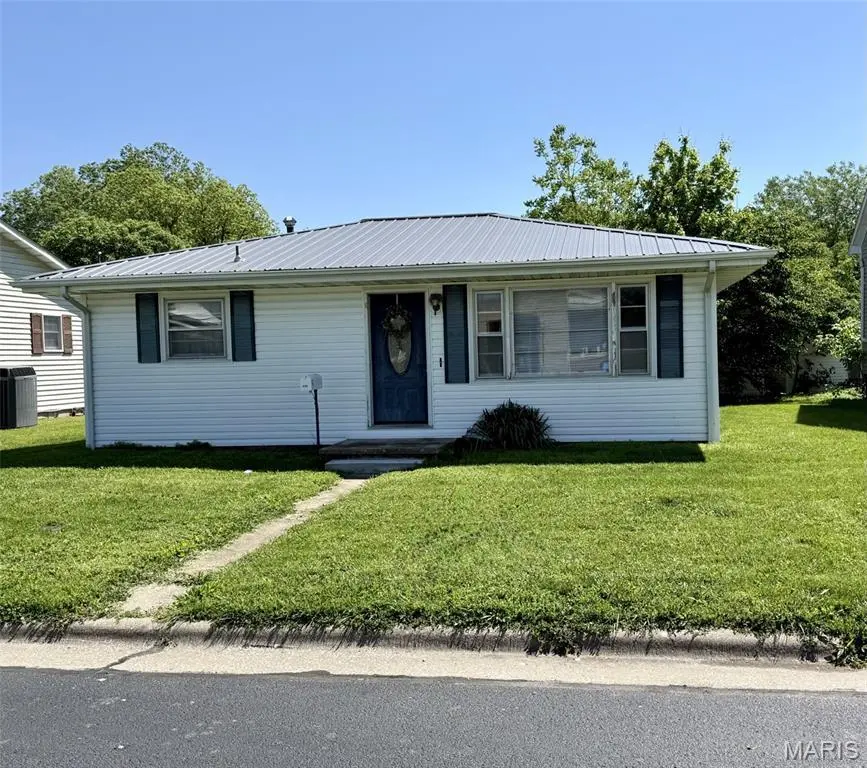
406 Madison St · Red Bud, IL
Flood risk 1/10 · Minimal
- FEMA flood zone
- X (unshaded)
- Chance of flooding over 30 yrs
- 0.0%
- Est. flood insurance / yr
- $473 – $860
Fire risk 1/10 · Minimal
- Est. fire insurance / yr
- $804 – $1,492
Heat risk 5/10 · Moderate
- Hot days now (above 107°F)
- 7 days/yr
- Hot days in 30 yrs
- 20 days/yr
Wind risk 2/10 · Minimal
- Chance of severe wind over 30 yrs
- 1.0%
Air-quality risk 1/10 · Minimal
- Unhealthy air days now
- 0 days/yr
- Unhealthy air days in 30 yrs
- 0 days/yr
Risk factors via First Street. Map © Google.
Why this score? — see what drove the D grade
The composite is a weighted blend of 9 inputs, each scored 0–100. Each bar is that input's sub-score; the figure is the points it added to the 100-point composite (weight × sub-score).
- ARV discount +13.7/15.0
- Cash flow +12.0/30.0
- DSCR +3.6/10.0
- Livability +3.2/5.0
- 1% rule +3.1/10.0
- Rent growth +2.5/5.0
- Schools +2.5/10.0
- Condition / age +2.5/5.0
- Appreciation +0.0/10.0
$125,000
🖨 Deal sheet (PDF) 📄 Offer letter ✓ Due diligence
Listing remarks
Welcome to 406 Madison St in charming Red Bud! Perfect opportunity for affordable, low maintenance living in a great location that keeps you close to everything! Cozy 1 bedroom, 1 bath ranch is ideal for a first-time buyer, those looking to downsize, or investors seeking to to add to their rental portfolio! On the exterior is a metal roof, vinyl siding, a small manageable yard, storage shed plus a nice 12 x 15 covered deck for quiet mornings and coffee! Enjoy the convenience of being just minutes from local businesses and dining, making errands a breeze! Roof, furnace and water heater all replaced in 2019. Call today for a showing! Don't miss your chance to make this cute home your own in a
Key facts
- 3,920 sq ft lot
- Built 1952
- Listed 51 days
Property features AI
Finance
- Other: 768 above-grade finished area (source: Other); Lot size about 0.09 acre (public records)
- Financial info: Lease not considered
Exterior
- Parking: On-street parking
- Utilities: Public water; Public sewer; Electric service by Ameren; Natural gas connected; Electricity connected; Water available; Sewer available
- Home design: Single-family residence; One story
- Construction: Vinyl siding; Metal roof
- Exterior features: Covered patio/porch; Deck; Level, rectangular lot; City street frontage
Interior
- Kitchen: Free-standing range; Refrigerator; Eat-in layout
- Bedrooms: One bedroom on the main level (11x11)
- Bathrooms: One full bathroom on the main level (8x6)
- Heating & cooling: Forced air heating (natural gas); Central air conditioning
- Interior features: Eat-in kitchen; Five total rooms
- Laundry & utility: Main-level laundry (11x10); Washer/Dryer included
Neighborhood map
What this means for you Summary
Snapshot
- This is a 1-bed/1.0-bath single-family listed at $125k.
Deal economics
- At list price, monthly cash flow is $-29 ($-347/yr) — negative.
- To cash-flow at today's rent, offer at most $120k (4.1% below list).
- To meet the 1% rule (rent ≥ 1% of price), the offer needs to be $102k (18.5% below list).
- Recommended offer: $102k (18.5% below list) — sets the bar for 1% rule.
Location & tenants
- Location reads 64/100 on livability (#727 in IL) — a middle-class / working-renter tenant base. Strengths: crime A+, cost of living A+, housing A+; Watch: amenities F, commute F, health & safety F.
- Red Bud CUSD 132 (town): math 20% / reading 35% proficiency, ranked #268 of 620 in IL (top 43%) — low school quality limits family demand, transient renter base, plan for 1-2y turnover.
- Zoned schools: Red Bud Elem School (math 20% / reading 36%, grade F, #736 of 2,056 statewide, top 36%, 618 students, 0% FRL); Red Bud High School (math 22% / reading 27%, grade F, #256 of 693 statewide, top 44%, 410 students, 0% FRL) — zoned schools average 0% FRL vs 36% district-wide (36 pts lower); this property's tenant base skews higher-income than the district average.
- Market conditions: 25 active listings in the ZIP; 3 units permitted in Randolph County in 2024 (0 in 5+ unit buildings).
Forward outlook
- Local home prices are declining (-3.0%/yr); year-one equity from $864 of loan paydown is wiped out by about $4k of value loss. Plan a longer hold.
- Randolph County population projected at -14% by 2050 — secular population decline; favor cash flow + early exit over multi-decade hold.
Negotiation context
- It's been on market 52 days — a 3% lower offer ($121k) is reasonable based on typical stale-listing flexibility.
- 2 sale attempts with the ask held roughly flat each time — persistent listings suggest the price (not the market) is what's stuck; bring a comps-based counter.
- Current owner paid $62k; list at $125k implies a 103% gain — meaningful room to come down on a strong offer.
Risks & watch-outs
- Watch-outs: built in 1952 — expect roof / HVAC / electrical / plumbing capex.
- Climate carrying-cost: extreme-heat days projected 7→20/yr by 2055 (HVAC capex compounding) — expect insurance premiums to compound above CPI over the hold.
Questions for the listing agent
- What do current leases actually rent for vs. the listed asking? Can we see a recent rent roll and the last 12 months of T-12 income?
- It's been on market 52 days. Have you received any prior offers? Is the seller open to a 19% concession, seller financing, or rate buy-down credit?
- Built in 1952 — when were the roof, HVAC, electrical panel, plumbing, and water heater last replaced?
- Is there a deadline driving the sale (1031 exchange, divorce, estate, relocation)? That informs how much negotiation room exists.
- Schools are D-rated, which usually means shorter tenancies and higher turnover. Who's the typical renter profile here, and what's been the actual vacancy rate?
- The area grade is low — what's the realistic commute time and amenity access for the typical tenant pool here? Any planned neighborhood developments (good or bad) we should know about?
- What's the average days-on-market for RENTAL listings here right now (not sales)? A rising rental-DOM trend means longer vacancies and softer asking-rent achievability than the comps imply.
- What's the recent tenant-quality profile in this submarket — average credit score on applications, eviction rate, late-payment / NSF rate, and stable-employment percentage? A property-management company in the area should have these aggregated.
- How much new for-sale + rental construction is in the pipeline within 1–3 miles? Heavy new supply typically softens prices + rents 12–24 months out; constrained supply supports both.
Investment metrics
- 1% rule
- 0.81% ✗
- Cap rate
- 6.02%
- Cash-on-cash
- -0.99%
- DSCR
- 0.96
- GRM
- 10.2
CMA / ARV
- ARV (median comp)
- $144,955
- List price
- $125,000
- Delta
- -13.77%
- Verdict
- UNDERPRICED
- Comps
- 10 within 1.0 mi
Show comp detail 1 sale within ~0.75 mi
| Address | Dist | Beds/Ba | Sqft | Sold | Price | $/sf | Match |
|---|---|---|---|---|---|---|---|
| 422 Washington St | 0.08mi | 2/1.0 (+1) | 723 (-6%) | 11mo | $149,900 | $207 | 72 |
Match score weights: distance 35% · size 25% · config 20% · recency 20%. Top-matched comps best support the ARV.
Projected returns pro-forma
-3.0% appreciation · 3.0% rent growth · sell at horizon
- IRR
- -17.9%
- Equity multiple
- 0.37×
- Total profit
- $-22,099
- Equity at exit
- $18,638
- IRR
- -10.1%
- Equity multiple
- 0.38×
- Total profit
- $-21,626
- Equity at exit
- $10,808
Cash invested: $35,000 (down + closing). Projections, not guarantees.
Landlord ↔ Tenant lean methodology
- Overall (STATE)
- 43 Moderately Tenant-Leaning
- State Illinois
- 43 Moderately Tenant-Leaning · D+7
- County
- — inherits STATE
- City
- — inherits STATE
ZIP-level market 62278
- Home prices YoY
- -29.7%
- Active inventory
- 25
- Price-to-rent
- 10.2×
Monthly cashflow live
- Estimated rent
- $1,018 medium interval (Pro) →
- Mortgage (P&I)
- −$656
- Tax from tax record
- −$126 /mo · $1,509/yr
- Insurance
- −$52
- HOA
- −$0
- Vacancy / Maint / Mgmt
- −$214
- Net cashflow
- $-29
Break-even live
Sensitivity live
| Price | -10% $42 | -5% $6 | +0% $-29 | +5% $-64 | +10% $-100 |
|---|---|---|---|---|---|
| Rent | -10% $-109 | -5% $-69 | +0% $-29 | +5% $11 | +10% $52 |
| Rate | -1.0pp $34 | -0.5pp $3 | base $-29 | +0.5pp $-61 | +1.0pp $-94 |
UW: 25.0% down · 7.5% · 30yr · 1.5% tax · 5.0% vac · 8.0% maint · 8.0% mgmt
Financing live
Cash to close
- Down payment
- $31,250
- Closing costs
- $3,750
- Reserves months
- —
- Total cash needed
- —
Loan-product check · same deal, 3 products live
Conventional
25% down · 7.5% · 30yr
- Down + closing
- —
- Monthly P&I
- —
- Monthly cashflow
- —
- DSCR
- —
- Eligible?
- —
Personal DTI + credit; lowest rate.
DSCR
20% down · 8.5% · 30yr
- Down + closing
- —
- Monthly P&I
- —
- Monthly cashflow
- —
- DSCR
- —
- Eligible?
- —
No personal income docs; deal must DSCR.
Hard money
10% down · 12.0% · 12mo
- Down + closing
- —
- Monthly P&I
- —
- Monthly cashflow
- —
- DSCR
- —
- Eligible?
- —
Short-term bridge; refi at stabilization.
Listing history 23 events
-
2026-06-21days on market $125,000 Active 52 DOM
-
2026-06-21days on market $125,000 Active 51 DOM
-
2026-06-18days on market $125,000 Active 49 DOM
-
2026-06-17days on market $125,000 Active 48 DOM
-
2026-06-16days on market $125,000 Active 47 DOM
-
2026-06-15days on market $125,000 Active 46 DOM
-
2026-06-13days on market $125,000 Active 44 DOM
-
2026-06-12days on market $125,000 Active 43 DOM
-
2026-06-09days on market $125,000 Active 40 DOM
-
2026-06-08days on market $125,000 Active 39 DOM
-
2026-06-07days on market $125,000 Active 38 DOM
-
2026-06-05days on market $125,000 Active 36 DOM
-
2026-06-04days on market $125,000 Active 34 DOM
-
2026-06-02days on market $125,000 Active 33 DOM
-
2026-06-01price $125,000 Active 32 DOM
-
2026-06-01days on market $129,000 Active 32 DOM
-
2026-05-31days on market $129,000 Active 31 DOM
-
2026-05-31days on market $129,000 Active 30 DOM
-
2026-05-17status Active 748-char remark
-
2026-05-03historical Active Under Contract 748-char remark
-
2026-05-01$129,000 Active 748-char remark
-
2026-04-30historical $129,000 748-char remark
-
2008-03-05soldstatus $61,500
ⓘ Source: listings_history table (triggers on properties + properties_extension) + one-shot
backfill from property_details.listing_events for pre-trigger history.
Tax reassessment forecast IL · Partial reset (capped growth)
- Current annual tax
- $1,509 · $126/mo
- Projected year-2 tax
- $2,173 · $181/mo
- Expected delta
- +$664/yr (+$55/mo · 44.0%)
ⓘ Screening estimate from a state-policy table — verify with the county assessor before closing.
Climate risk First Street
- Flood 1/10 Low FEMA zone X (unshaded) · 0% chance over 30 yrs
- Wildfire 1/10 Low
- Heat 5/10 Major 7 d/yr ≥107°F today · 20 d/yr by 30 yrs out
- Wind 2/10 Low 100% chance of damaging wind over 30 yrs
- Air quality 1/10 Low 0 unhealthy d/yr today · 0 by 30 yrs out
Nearby sold comps map
Loading sold comps map…
Walkable amenities ~0.75 mi
Loading nearby amenities…
Taxation est. · year 1
- Rental income
- $12,220
- − Mortgage interest
- −$7,002
- − Property taxes
- −$1,509
- − Insurance
- −$625
- − Repairs & maintenance
- −$978
- − Management
- −$978
- − Depreciation
- −$3,636
- Taxable loss
- −$2,508
- Est. tax savings @ 24.0%
- +$602
- After-tax cash flow
- $255/yr
For passive investors: Depreciation is non-cash, so a rental often shows a tax loss while cash-flowing — sheltering income. Rental losses are passive: they offset passive income freely, and up to $25,000/yr can offset ordinary (W-2) income if you actively participate and your MAGI is under $100k (phasing out to $0 by $150k); unused losses carry forward. On sale, claimed depreciation is recaptured at up to 25%, and gains may owe capital-gains tax (a 1031 exchange can defer both). Figures are a year-1 estimate at your 24.0% rate — not tax advice; consult a CPA.
Schools (NCES district)
- District
- Red Bud CUSD 132
- NCES district ID
- 1733300
- Math proficiency
- 20% ▼ -8.00%
- Reading proficiency
- 35% ▼ -10.00%
- Median HH income
- $54,391
- Composite
- 24.5/100
- National rank
- #7652
- State rank
- #268 of 620 in IL
Livability — Red Bud
- Score
- 64/100
- State rank
- #727
- US rank
- #14772
Category grades
Schools grade is shown separately in the Schools card above.
Census & demographics
- Census place
- Red Bud, IL
- City population
- 6,425
- Population (ZIP)
- 6,425
Population outlook (Randolph County) Hauer SSP2
- Today (2025)
- 31,417 people
- By 2030
- 30,519 · -2.9%
- By 2040
- 28,841 · -8.2%
- By 2050
- 27,150 · -13.6%
- By 2075
- 22,569 · -28.2%
- By 2100
- 16,584 · -47.2%
Race, ethnicity, and origin ACS 2023
- Neighborhood character
- Predominantly White (94%)
- Race & ethnicity
- White 94% Two or more races 3% Asian 2% Hispanic / Latino 1%
- Common ancestry
- Lithuanian 6% Romanian 3% Serbian 1%
- Foreign-born
- 3%
- Languages at home
- 97% English-only · Other Asian/Pacific 2%
Political lean MEDSL · Randolph
- 2024 margin
- Solid R (+50.0) · D 24.1% · R 74.1% · Other 1.7%
- 2008→2024 swing
- -49.0pp toward R · 2008: -0.9pp · 2024: -50.0pp
- All cycles
- 2024: R+50.0 2020: R+50.2 2016: R+46.8 2012: R+17.6 2008: R+0.9
Not yet ingested
- Civics
- —
Market trends
- HPI YoY
- ▼ -71.77%
- Current HPI
- 170.2242
- Rent YoY
- —
- Metro
- —
- State GDP YoY
- ▲ 1.59%
- F500 in state
- 60
Industry mix (Fortune 500 HQ in IL)
| Industry | F500 HQs | Revenue |
|---|---|---|
| Insurance | 4 | $201B |
|
||
| Consumer Goods | 4 | $87B |
|
||
| Industrial Machinery | 3 | $64B |
|
||
| Healthcare | 2 | $55B |
|
||
| Retail / Pharmacy | 1 | $148B |
|
||
| Agriculture / Food | 1 | $86B |
|
||
Price history
+103.3% since first listed6 events — show timeline
- 2026-06-01 Price Changed $125,000 MARIS as Distributed by MLS Grid
- 2026-05-17 Relisted — MARIS as Distributed by MLS Grid
- 2026-05-03 Contingent — MARIS as Distributed by MLS Grid
- 2026-05-01 Listed $129,000 MARIS as Distributed by MLS Grid
- 2026-04-30 Coming Soon $129,000 MARIS as Distributed by MLS Grid
- 2008-03-05 Sold (Public Records) $61,500 Public Records
Property tax history
+1.4%/yrLatest (2024): $1,509 · +4.3% YoY. Source: county tax records.
Cash-flow waterfall
monthlySold comps — $/sqft
last 12 mo · ≤1 miLoading sold comps…