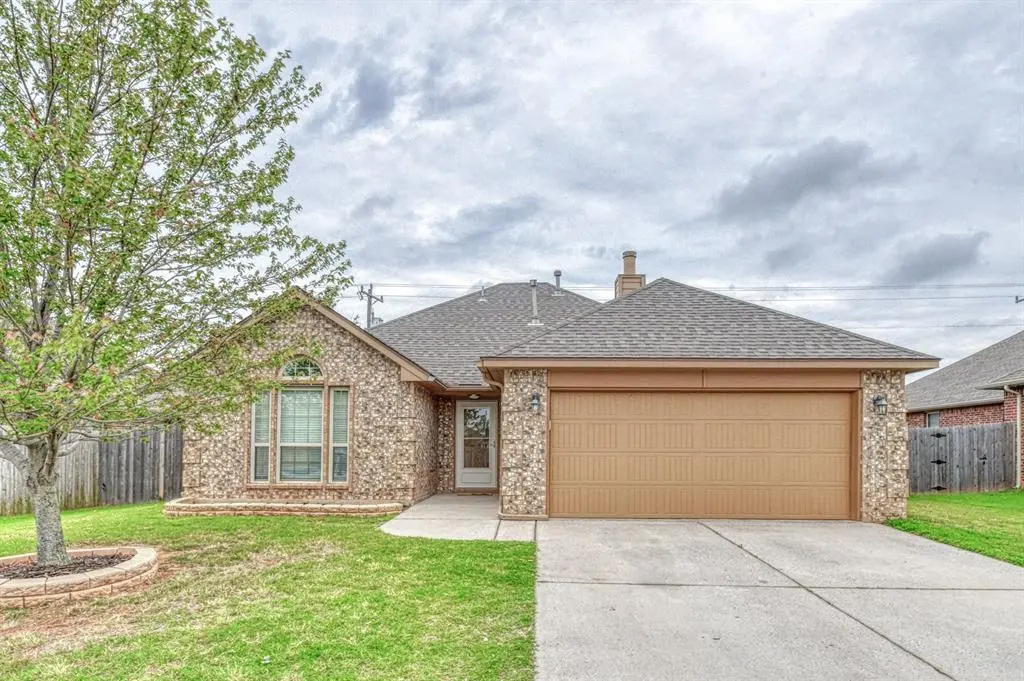
4109 Johnson Farms Dr · Oklahoma City, OK
Flood risk 1/10 · Minimal
- FEMA flood zone
- X (unshaded)
- Chance of flooding over 30 yrs
- 0.0%
- Est. flood insurance / yr
- $507 – $1,088
Fire risk 4/10 · Minor
- Est. fire insurance / yr
- $2,463 – $4,575
Heat risk 6/10 · Moderate
- Hot days now (above 106°F)
- 7 days/yr
- Hot days in 30 yrs
- 20 days/yr
Wind risk 2/10 · Minimal
- Chance of severe wind over 30 yrs
- 4.0%
Air-quality risk 1/10 · Minimal
- Unhealthy air days now
- 0 days/yr
- Unhealthy air days in 30 yrs
- 0 days/yr
Risk factors via First Street. Map © Google.
Why this score? — see what drove the D- grade
The composite is a weighted blend of 9 inputs, each scored 0–100. Each bar is that input's sub-score; the figure is the points it added to the 100-point composite (weight × sub-score).
- Cash flow +12.4/30.0
- ARV discount +8.3/15.0
- Livability +4.0/5.0
- DSCR +3.7/10.0
- 1% rule +3.3/10.0
- Schools +3.1/10.0
- Condition / age +2.5/5.0
- Rent growth +2.4/5.0
- Appreciation +0.0/10.0
$227,000
🖨 Deal sheet (PDF) 📄 Offer letter ✓ Due diligence
Listing remarks MLS
Better than new-Great House inside and out! High ceiling, rounded corners, fireplace, granite countertops, covered patio, in garage storm shelter. Ceiling fans in all bedrooms and living room! Fenced, sodded and landscaped yard. Easy Access to Major highways I-40, Hwy 152 and Kilpatrick Turnpike. Minutes from anywhere in Mustang/Yukon/OKC area
Key facts
- Walk-in closet
- Covered back patio
- Abundant cabinetry
Tags
Property features AI
Finance
- Financial info: Not assumable
- HOA & community: Mandatory association dues; Association fee $200 (includes greenbelt)
Exterior
- Parking: 2-car garage
- Utilities: Public utilities
- Home design: One-level single family residence; Residential property; Existing construction
- Construction: Brick construction; Composition roof (replaced/installed 2022); Double-pane windows; Slab foundation
- Exterior features: Covered patio; Open deck; Wood fencing; Interior lot
Interior
- Kitchen: Free-standing electric range/oven
- Bedrooms: 3 bedrooms
- Flooring: Combination flooring; Concrete; Tile
- Bathrooms: 2 full bathrooms
- Interior features: In-law plan; Dishwasher; Disposal
- Laundry & utility: Garage floor storm shelter
Neighborhood map
What this means for you Summary
Snapshot
- This is a 3-bed/2.0-bath single-family listed at $227k.
Deal economics
- At list price, monthly cash flow is $-37 ($-447/yr) — negative.
- To cash-flow at today's rent, offer at most $220k (2.9% below list).
- To meet the 1% rule (rent ≥ 1% of price), the offer needs to be $188k (17.4% below list).
- Recommended offer: $188k (17.4% below list) — sets the bar for 1% rule.
- Cap rate 6.1% vs local median 3.7% in Oklahoma City — top-decile yield for the area; either an underpriced asset or a hidden risk that comps aren't pricing in. Stress-test before assuming the spread holds.
Location & tenants
- Location reads 80/100 on livability (#3 in OK, #1,635 nationally) — a professional / high-income tenant draw. Strengths: amenities A+, commute A+, cost of living A+; Watch: crime F.
- Mustang (suburban): math 35% / reading 33% proficiency, ranked #28 of 270 in OK (top 10%) — families likely to look elsewhere, expect single-tenant / working-renter base with shorter leases.
- Zoned schools: Mustang Centennial Es (math 46% / reading 42%, grade F, #73 of 845 statewide, top 9%, 643 students, 0% FRL); Mustang Hs (math 28% / reading 39%, grade F, #65 of 447 statewide, top 14%, 3,756 students, 0% FRL) — zoned schools average 0% FRL vs 28% district-wide (28 pts lower); this property's tenant base skews higher-income than the district average.
- Market conditions: Rents soft (-0.3%/yr); 512 active listings in the ZIP; 33 comparable units currently listed for rent nearby; rentals at typical pace (median 22d on market — plan ~3-4 weeks tenant-placement turnaround); solid renter incomes; 260 units permitted in Canadian County in 2024 (0 in 5+ unit buildings).
Forward outlook
- Local home prices are declining (-3.0%/yr); year-one equity from $2k of loan paydown is wiped out by about $7k of value loss. Plan a longer hold.
- Canadian County population projected at +64% by 2050 — long-run rental-demand tailwind backs the buy-and-hold thesis.
Negotiation context
- Only 12 days on market — expect competitive offers; lowballing is unlikely to land.
- 3 sale attempts since 14y ago with the ask held roughly flat each time — persistent listings suggest the price (not the market) is what's stuck; bring a comps-based counter.
- Current owner paid $145k; list at $227k implies a 57% gain — meaningful room to come down on a strong offer.
Risks & watch-outs
- Climate carrying-cost: extreme-heat days projected 7→20/yr by 2055 (HVAC capex compounding) — expect insurance premiums to compound above CPI over the hold.
Questions for the listing agent
- What do current leases actually rent for vs. the listed asking? Can we see a recent rent roll and the last 12 months of T-12 income?
- What does the HOA fee cover, when was the last increase, and are there any pending special assessments or reserve-fund shortfalls?
- Is there a deadline driving the sale (1031 exchange, divorce, estate, relocation)? That informs how much negotiation room exists.
- Schools are F-rated, which usually means shorter tenancies and higher turnover. Who's the typical renter profile here, and what's been the actual vacancy rate?
- Crime grade is F in this area — have there been break-ins, vandalism, or insurance claims at this property in the last 3 years? What carrier currently insures it and at what premium?
- The area grade is low — what's the realistic commute time and amenity access for the typical tenant pool here? Any planned neighborhood developments (good or bad) we should know about?
- What's the average days-on-market for RENTAL listings here right now (not sales)? A rising rental-DOM trend means longer vacancies and softer asking-rent achievability than the comps imply.
- What's the recent tenant-quality profile in this submarket — average credit score on applications, eviction rate, late-payment / NSF rate, and stable-employment percentage? A property-management company in the area should have these aggregated.
- How much new for-sale + rental construction is in the pipeline within 1–3 miles? Heavy new supply typically softens prices + rents 12–24 months out; constrained supply supports both.
Investment metrics
- 1% rule
- 0.83% ✗
- Cap rate
- 6.10%
- Cash-on-cash
- -0.70%
- DSCR
- 0.97
- GRM
- 10.1
CMA / ARV
- ARV (on-the-fly)
- $231,330
- Comps found
- 12
Show comp detail 12 sales within ~0.75 mi
| Address | Dist | Beds/Ba | Sqft | Sold | Price | $/sf | Match |
|---|---|---|---|---|---|---|---|
| 3705 Johnson Farms Dr | 0.25mi | 3/2.0 | 1,250 (-11%) | 1mo | $185,000 | $148 | 70 |
| 10624 SW 35th St | 0.73mi | 3/2.0 | 1,383 (-1%) | 2mo | $235,000 | $170 | 62 |
| 12304 SW 32nd St | 0.55mi | 3/2.0 | 1,500 (+7%) | 0mo | $321,840 | $215 | 62 |
| 11520 SW 40th St | 0.50mi | 3/2.0 | 1,280 (-9%) | 0mo | $220,990 | $173 | 62 |
| 3409 Furrow Dr | 0.47mi | 3/2.0 | 1,570 (+12%) | 1mo | $225,000 | $143 | 57 |
| 3732 Montage Blvd | 0.59mi | 3/2.0 | 1,522 (+9%) | 2mo | $226,200 | $149 | 56 |
| 3716 Los Cabos Dr | 0.69mi | 3/2.0 | 1,302 (-7%) | 2mo | $212,906 | $164 | 54 |
| 10736 SW 35th St | 0.59mi | 3/2.0 | 1,246 (-11%) | 2mo | $205,000 | $165 | 52 |
| 11521 SW 40th St | 0.50mi | 4/2.0 (+1) | 1,572 (+12%) | 1mo | $245,990 | $156 | 51 |
| 12321 SW 32nd St | 0.55mi | 3/2.0 | 1,200 (-14%) | 1mo | $266,990 | $222 | 49 |
| 12309 SW 32nd St | 0.55mi | 4/2.0 (+1) | 1,565 (+12%) | 2mo | $306,990 | $196 | 48 |
| 4212 Moonlight Rd | 0.62mi | 3/2.0 | 1,611 (+15%) | 1mo | $251,000 | $156 | 46 |
Match score weights: distance 35% · size 25% · config 20% · recency 20%. Top-matched comps best support the ARV.
Projected returns pro-forma
-3.0% appreciation · 0.0% rent growth · sell at horizon
- IRR
- -20.8%
- Equity multiple
- 0.30×
- Total profit
- $-44,656
- Equity at exit
- $33,846
- IRR
- -22.5%
- Equity multiple
- 0.01×
- Total profit
- $-63,193
- Equity at exit
- $19,627
Cash invested: $63,560 (down + closing). Projections, not guarantees.
Landlord ↔ Tenant lean methodology
- Overall (STATE)
- 83 Strongly Landlord-Friendly
- State Oklahoma
- 83 Strongly Landlord-Friendly · R+20
- County
- — inherits STATE
- City
- — inherits STATE
ZIP-level market 73064
- Home prices YoY
- -17.9%
- Rents YoY
- -0.3%
- Active inventory
- 512
- Price-to-rent
- 10.1×
Monthly cashflow live
- Estimated rent
- $1,876 high interval (Pro) →
- Mortgage (P&I)
- −$1,190
- Tax from tax record
- −$217 /mo · $2,603/yr
- Insurance
- −$95
- HOA
- −$17
- Vacancy / Maint / Mgmt
- −$394
- Net cashflow
- $-37
Break-even live
Sensitivity live
| Price | -10% $91 | -5% $27 | +0% $-37 | +5% $-102 | +10% $-166 |
|---|---|---|---|---|---|
| Rent | -10% $-185 | -5% $-111 | +0% $-37 | +5% $37 | +10% $111 |
| Rate | -1.0pp $77 | -0.5pp $20 | base $-37 | +0.5pp $-96 | +1.0pp $-156 |
UW: 25.0% down · 7.5% · 30yr · 1.5% tax · 5.0% vac · 8.0% maint · 8.0% mgmt
Financing live
Cash to close
- Down payment
- $56,750
- Closing costs
- $6,810
- Reserves months
- —
- Total cash needed
- —
Loan-product check · same deal, 3 products live
Conventional
25% down · 7.5% · 30yr
- Down + closing
- —
- Monthly P&I
- —
- Monthly cashflow
- —
- DSCR
- —
- Eligible?
- —
Personal DTI + credit; lowest rate.
DSCR
20% down · 8.5% · 30yr
- Down + closing
- —
- Monthly P&I
- —
- Monthly cashflow
- —
- DSCR
- —
- Eligible?
- —
No personal income docs; deal must DSCR.
Hard money
10% down · 12.0% · 12mo
- Down + closing
- —
- Monthly P&I
- —
- Monthly cashflow
- —
- DSCR
- —
- Eligible?
- —
Short-term bridge; refi at stabilization.
Rent comps 33 comps
| Address | Beds | Baths | Sqft | Rent | $/sqft | DOM | Units | Dist |
|---|---|---|---|---|---|---|---|---|
| 11128 SW 40th St Yukon, OK | 3.0 | 2.0 | 1762 | $1,870 | $1.06 | 12d | 1 | 0.06mi |
| 11120 SW 42nd St Mustang, OK | 4.0 | 2.0 | 1801 | $2,065 | $1.15 | 24d | 1 | 0.10mi |
| 3300 S Mustang Rd Yukon, OK | 1.0–2.0 | 1.0–2.0 | 818 | $1,693 | $2.07 | 2d | 16 | 0.58mi |
| 11623 SW 38th St Mustang, OK | 3.0 | 2.0 | 1515 | $1,545 | $1.02 | 24d | 1 | 0.65mi |
| 11632 SW 40th St Mustang, OK | 4.0 | 2.5 | 1822 | $1,700 | $0.93 | 24d | 1 | 0.67mi |
| 3805 Palmetto Bluff Dr Mustang, OK | 4.0 | 2.0 | 1720 | $1,895 | $1.10 | 24d | 1 | 0.76mi |
| 10524 SW 38th St Mustang, OK | 3.0–5.0 | 2.0–2.5 | 1680 | $1,800 | $1.07 | 2d | 4 | 0.81mi |
| 4904 Vine Cliff Rd Mustang, OK | 3.0 | 2.0 | 1838 | $2,295 | $1.25 | 24d | 1 | 0.83mi |
| 10425 SW 41st St Oklahoma City, OK | 4.0 | 2.5 | 1822 | $1,950 | $1.07 | 24d | 1 | 0.85mi |
| 2933 Ember Dr Yukon, OK | 4.0 | 2.0 | 1796 | $1,895 | $1.06 | 24d | 1 | 1.01mi |
| 2933 Ember Dr Yukon, OK | 4.0 | 2.0 | 1796 | $1,895 | $1.06 | 15d | 1 | 1.01mi |
| 2924 Firefly Dr Yukon, OK | 3.0 | 2.0 | 1607 | $1,850 | $1.15 | 24d | 1 | 1.04mi |
| 3629 Maggie Rd Mustang, OK | 4.0 | 2.0 | 1459 | $1,595 | $1.09 | 24d | 1 | 1.16mi |
| 3629 Maggie Rd Mustang, OK | 4.0 | 2.0 | 1459 | $1,595 | $1.09 | 21d | 1 | 1.16mi |
| 3617 Maggie Rd Mustang, OK | 4.0 | 2.0 | 1459 | $1,595 | $1.09 | 24d | 1 | 1.17mi |
| 3617 Maggie Rd Mustang, OK | 4.0 | 2.0 | 1459 | $1,595 | $1.09 | 15d | 1 | 1.17mi |
| 3605 Maggie Rd Mustang, OK | 4.0 | 2.0 | 1459 | $1,595 | $1.09 | 15d | 1 | 1.18mi |
| 11424 SW 25th St Yukon, OK | 4.0 | 2.0 | 1721 | $1,833 | $1.07 | 24d | 1 | 1.18mi |
| 12044 SW 36th St Mustang, OK | 4.0 | 2.0 | 1459 | $1,595 | $1.09 | 16d | 1 | 1.20mi |
| 12044 SW 36th St Mustang, OK | 4.0 | 2.0 | 1524 | $1,595 | $1.05 | 3d | 1 | 1.20mi |
| 10748 SW 23rd Pl Yukon, OK | 3.0 | 2.0 | 1203 | $1,495 | $1.24 | 24d | 1 | 1.22mi |
| 10804 SW 23rd Pl Yukon, OK | 3.0 | 2.0 | 1241 | $1,495 | $1.20 | 22d | 1 | 1.22mi |
| 10925 SW 23rd Pl Yukon, OK | 3.0 | 2.0 | 1260 | $1,495 | $1.19 | 22d | 1 | 1.25mi |
| 2809 Tracys Mnr Yukon, OK | 4.0 | 2.0 | 1614 | $1,849 | $1.15 | 5d | 1 | 1.25mi |
| 2200 Bleeker St Yukon, OK | 4.0 | 2.0 | 1784 | $1,595 | $0.89 | 15d | 1 | 1.30mi |
| 10921 SW 22nd St Yukon, OK | 4.0 | 2.0 | 1784 | $1,640 | $0.92 | 24d | 1 | 1.30mi |
| 2613 Kathleens Xing Yukon, OK | 4.0 | 2.0 | 1614 | $2,100 | $1.30 | 24d | 1 | 1.33mi |
| 11521 SW 24th St Yukon, OK | 3.0 | 2.0 | 1398 | $1,595 | $1.14 | 5d | 1 | 1.35mi |
| 3909 Dutch LN Mustang, OK | 4.0 | 2.0 | 1613 | $1,595 | $0.99 | 16d | 1 | 1.42mi |
| 3909 Dutch LN Mustang, OK | 4.0 | 2.0 | 1613 | $1,595 | $0.99 | 15d | 1 | 1.42mi |
| 4004 Dutch LN Mustang, OK | 3.0 | 2.0 | 1544 | $1,595 | $1.03 | 12d | 1 | 1.45mi |
| 4004 Dutch LN Mustang, OK | 4.0 | 2.0 | 1544 | $1,595 | $1.03 | 15d | 1 | 1.45mi |
| 4000 Dutch LN Mustang, OK | 4.0 | 2.0 | 1690 | $1,795 | $1.06 | 24d | 1 | 1.45mi |
HOA detail
- Monthly dues
- $17 · $204/yr
Listing history 9 events
-
2026-06-17status $227,000 Pending 12 DOM
-
2026-06-17days on market $227,000 Active 12 DOM
-
2026-06-16days on market $227,000 Active 11 DOM
-
2026-06-15days on market $227,000 Active 10 DOM
-
2026-06-13days on market $227,000 Active 8 DOM
-
2026-06-09days on market $227,000 Active 4 DOM
-
2026-06-08days on market $227,000 Active 3 DOM
-
2026-06-07remarks 681-char remark
-
2026-06-07$227,000 Active 2 DOM
ⓘ Source: listings_history table (triggers on properties + properties_extension) + one-shot
backfill from property_details.listing_events for pre-trigger history.
Tax reassessment forecast OK · Resets to sale price
- Current annual tax
- $2,603 · $217/mo
- Projected year-2 tax
- $2,603 · $217/mo
- Expected delta
- $0/yr ($0/mo · 0.0%)
ⓘ Screening estimate from a state-policy table — verify with the county assessor before closing.
Climate risk First Street
- Flood 1/10 Low FEMA zone X (unshaded) · 0% chance over 30 yrs
- Wildfire 4/10 Moderate
- Heat 6/10 Major 7 d/yr ≥106°F today · 20 d/yr by 30 yrs out
- Wind 2/10 Low 4% chance of damaging wind over 30 yrs
- Air quality 1/10 Low 0 unhealthy d/yr today · 0 by 30 yrs out
Nearby sold comps map
Loading sold comps map…
Walkable amenities ~0.75 mi
Loading nearby amenities…
Taxation est. · year 1
- Rental income
- $22,506
- − Mortgage interest
- −$12,716
- − Property taxes
- −$2,603
- − Insurance
- −$1,135
- − Repairs & maintenance
- −$1,800
- − Management
- −$1,800
- − HOA
- −$204
- − Depreciation
- −$6,604
- Taxable loss
- −$4,356
- Est. tax savings @ 24.0%
- +$1,045
- After-tax cash flow
- $598/yr
For passive investors: Depreciation is non-cash, so a rental often shows a tax loss while cash-flowing — sheltering income. Rental losses are passive: they offset passive income freely, and up to $25,000/yr can offset ordinary (W-2) income if you actively participate and your MAGI is under $100k (phasing out to $0 by $150k); unused losses carry forward. On sale, claimed depreciation is recaptured at up to 25%, and gains may owe capital-gains tax (a 1031 exchange can defer both). Figures are a year-1 estimate at your 24.0% rate — not tax advice; consult a CPA.
Schools (NCES district)
- District
- Mustang
- NCES district ID
- 4021000
- Math proficiency
- 35% ▼ -10.00%
- Reading proficiency
- 33% ▼ -7.00%
- Median HH income
- $67,559
- Composite
- 31.21/100
- National rank
- #6038
- State rank
- #28 of 270 in OK
Livability — Oklahoma City
- Score
- 80/100
- State rank
- #3
- US rank
- #1635
Category grades
Schools grade is shown separately in the Schools card above.
Census & demographics
- Census place
- Oklahoma City, OK
- County
- Canadian County · 154,341 people
- City population
- 498,656
- Metro
- Oklahoma City, OK
- Population (ZIP)
- 28,919
- Household income
- $94,402
- Rent vs Own
- Severe rent burden
- 384.0
Population outlook (Canadian County) Hauer SSP2
- Today (2025)
- 174,062 people
- By 2030
- 195,170 · +12.1%
- By 2040
- 239,293 · +37.5%
- By 2050
- 285,457 · +64.0%
- By 2075
- 403,766 · +132.0%
- By 2100
- 498,766 · +186.5%
Race, ethnicity, and origin ACS 2023
- Neighborhood character
- Predominantly White (74%)
- Race & ethnicity
- White 74% Two or more races 11% Hispanic / Latino 10% Native American 3% Black 3% Asian 2%
- Hispanic origin (detail)
- Mexican 8%
- Common ancestry
- Italian 2% Scottish 2% Slovak 2%
- Foreign-born
- 4% · Canada, Vietnam
- Languages at home
- 93% English-only · Spanish 5% Other Indo-European 1% Tagalog/Filipino 1%
Political lean MEDSL · Canadian
- 2024 margin
- Solid R (+40.4) · D 28.8% · R 69.2% · Other 2.0%
- 2008→2024 swing
- +11.9pp toward D · 2008: -52.2pp · 2024: -40.4pp
- All cycles
- 2024: R+40.4 2020: R+43.3 2016: R+51.2 2012: R+54.4 2008: R+52.2
Not yet ingested
- Civics
- —
Market trends
- HPI YoY
- ▼ -56.66%
- Current HPI
- 260.2863
- Rent YoY
- ▼ -0.33%
- Metro
- Oklahoma City, OK
- State GDP YoY
- ▲ 1.55%
- F500 in state
- 6
Industry mix (Fortune 500 HQ in OK)
| Industry | F500 HQs | Revenue |
|---|---|---|
| Energy | 3 | $48B |
|
||
Price history
-87.9% since first listed7 events — show timeline
- 2026-06-04 Listed $227,000 MLSOK
- 2014-10-15 Sold (Public Records) $145,000 Public Records
- 2014-10-10 Sold (MLS) $145,000 MLSOK
- 2014-06-05 Listed $149,500 MLSOK
- 2012-09-28 Sold (MLS) $139,990 MLSOK
- 2012-05-01 Listed $139,990 MLSOK
- 2011-05-04 Sold (Public Records) $1,875,000 Public Records
Property tax history
+3.3%/yrLatest (2025): $2,603 · +6.2% YoY. Source: county tax records.
Cash-flow waterfall
monthlySold comps — $/sqft
last 12 mo · ≤1 miLoading sold comps…