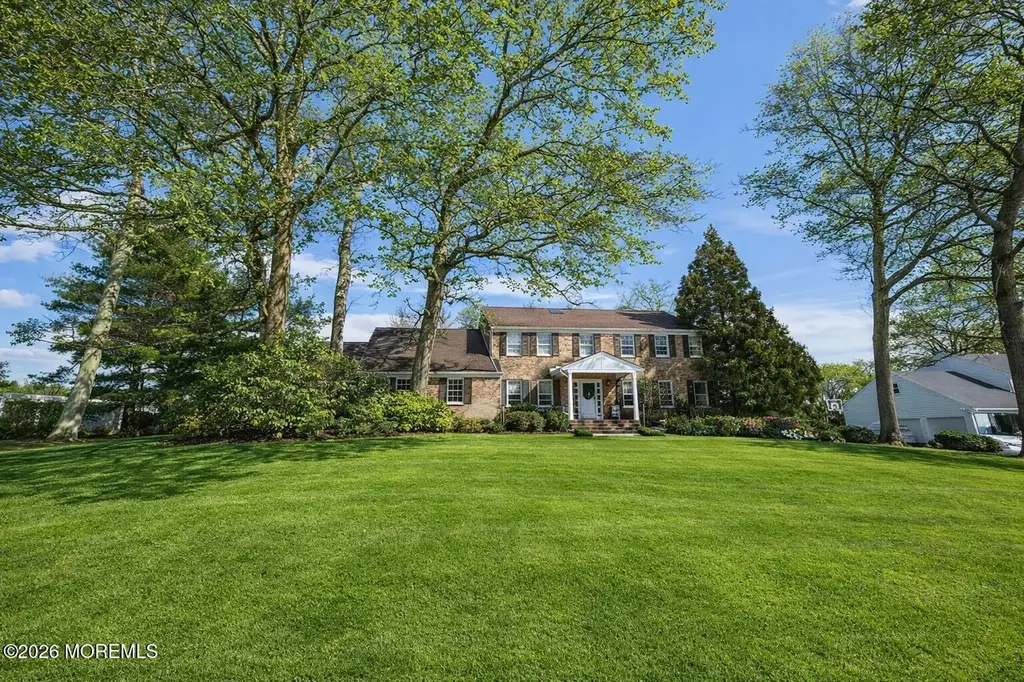
4 Marc Rd · West Long Branch, NJ
Flood risk 1/10 · Minimal
- FEMA flood zone
- X (unshaded)
- Chance of flooding over 30 yrs
- 0.0%
- Est. flood insurance / yr
- $473 – $860
Fire risk 1/10 · Minimal
- Est. fire insurance / yr
- $526 – $976
Heat risk 7/10 · Major
- Hot days now (above 94°F)
- 7 days/yr
- Hot days in 30 yrs
- 16 days/yr
Wind risk 8/10 · Major
- Chance of severe wind over 30 yrs
- 80.0%
Air-quality risk 3/10 · Minor
- Unhealthy air days now
- 3 days/yr
- Unhealthy air days in 30 yrs
- 4 days/yr
Risk factors via First Street. Map © Google.
Why this score? — see what drove the D grade
The composite is a weighted blend of 9 inputs, each scored 0–100. Each bar is that input's sub-score; the figure is the points it added to the 100-point composite (weight × sub-score).
- Cash flow +15.0/30.0
- ARV discount +6.0/15.0
- 1% rule +5.0/10.0
- DSCR +5.0/10.0
- Schools +4.3/10.0
- Livability +3.5/5.0
- Rent growth +2.5/5.0
- Condition / age +2.5/5.0
- Appreciation +0.0/10.0
$1,600,000
🖨 Deal sheet 📄 Offer letter ✓ Due diligence
Listing remarks
This charming single-family home located at 4 Marc Rd in West Long Branch, NJ was built in 1973. With a spacious finished area of 2,706 sq. ft. , this home offers 5 bedrooms, 2 full bathrooms and 1 half bathroom. Situated on a large lot size of 27,056 sq. ft. , there is plenty of room for outdoor activities and entertaining. Don't miss the opportunity to make this well-maintained property your new home!. Location advantages (close to beach, Monmouth University, Monmouth Park, Netflix, shopping and restaurants).
Key facts
- 2 garage spots
- Pool
- Listed 41 days
Property features AI
Exterior
- Parking: Attached 2-car garage
- Utilities: Public sewer
- Home design: Fee simple ownership
- Construction: Full unfinished basement
- Exterior features: Sloping shingle roof
Interior
- Kitchen: Stove; Refrigerator; Freezer; Dishwasher; Garbage disposal
- Bedrooms: 5 bedrooms
- Flooring: Porcelain floors; Wood floors
- Bathrooms: 2 full bathrooms; 1 half bathroom; Total 3 bathrooms (2.5)
- Heating & cooling: 2-zone heating; 2-zone air conditioning
- Interior features: Hot tub; Fireplace (1)
- Laundry & utility: Washer; Dryer; Garage door opener
Neighborhood map
What this means for you Summary
Snapshot
- This is a 5-bed/2.5-bath single-family listed at $1.60M.
Deal economics
- At list price, monthly cash flow is $50k ($602k/yr) — positive.
- The deal already cash-flows at list — no discount required.
- Meets the 1% rule at list price ($77k rent vs $1.60M).
- Recommended offer: $1.55M (3.0% below list) — sets the bar for market timing.
- Cap rate 43.9% vs local median 2.0% in West Long Branch — top-decile yield for the area; either an underpriced asset or a hidden risk that comps aren't pricing in. Stress-test before assuming the spread holds.
Location & tenants
- Location reads 70/100 on livability (#268 in NJ) — a middle-class / working-renter tenant base. Strengths: crime A+, employment A+, housing A+; Watch: amenities F, commute F, cost of living F.
- West Long Branch School District (suburban): math 37% / reading 55% proficiency, ranked #154 of 472 in NJ (top 33%) — families likely to look elsewhere, expect single-tenant / working-renter base with shorter leases; only 8% free/reduced lunch — higher-income household profile.
- Market conditions: 47 active listings in the ZIP; 5 comparable units currently listed for rent nearby; rentals at typical pace (median 22d on market — plan ~3-4 weeks tenant-placement turnaround); 2,840 units permitted in Monmouth County in 2024 (484 in 5+ unit buildings).
Forward outlook
- Local home prices are declining (-3.0%/yr); year-one equity from $11k of loan paydown is wiped out by about $48k of value loss. Plan a longer hold.
- Monmouth County population projected at -11% by 2050 — secular population decline; favor cash flow + early exit over multi-decade hold.
- At projected returns (-3.0% appreciation + 3.0% rent growth), your $448k cash investment doubles in ~1 year — after that, you're playing with house money.
Negotiation context
- It's been on market 41 days — a 3% lower offer ($1.55M) is reasonable based on typical stale-listing flexibility.
Risks & watch-outs
- Climate carrying-cost: severe wind risk, 80% chance of damaging wind over 30y; extreme-heat days projected 7→16/yr by 2055 (HVAC capex compounding) — expect insurance premiums to compound above CPI over the hold.
Questions for the listing agent
- It's been on market 41 days. Have you received any prior offers? Is the seller open to a 3% concession, seller financing, or rate buy-down credit?
- Built in 1973 — when were the roof, HVAC, electrical panel, plumbing, and water heater last replaced?
- Is there a deadline driving the sale (1031 exchange, divorce, estate, relocation)? That informs how much negotiation room exists.
- Schools are A-rated — typically a magnet for longer-tenancy family renters. What's the average tenant stay here, and is there a school-zone premium baked into asking?
- The area grade is low — what's the realistic commute time and amenity access for the typical tenant pool here? Any planned neighborhood developments (good or bad) we should know about?
- What's the average days-on-market for RENTAL listings here right now (not sales)? A rising rental-DOM trend means longer vacancies and softer asking-rent achievability than the comps imply.
- What's the recent tenant-quality profile in this submarket — average credit score on applications, eviction rate, late-payment / NSF rate, and stable-employment percentage? A property-management company in the area should have these aggregated.
- How much new for-sale + rental construction is in the pipeline within 1–3 miles? Heavy new supply typically softens prices + rents 12–24 months out; constrained supply supports both.
Investment metrics
- 1% rule
- 4.82% ✓
- Cap rate
- 43.94%
- Cash-on-cash
- 134.46%
- DSCR
- 6.98
- GRM
- 1.7
CMA / ARV
- ARV (on-the-fly)
- $1,548,638
- Comps found
- 10
Show comp detail 10 sales within ~0.75 mi
| Address | Dist | Beds/Ba | Sqft | Sold | Price | $/sf | Match |
|---|---|---|---|---|---|---|---|
| 499 Wall St | 0.20mi | 5/3.0 | 3,269 (-1%) | 7mo | $1,725,000 | $528 | 81 |
| 5 Woods Rd | 0.14mi | 5/2.5 | 3,178 (-4%) | 9mo | $1,410,000 | $444 | 80 |
| 36 Muncy Dr | 0.25mi | 5/3.5 | 3,542 (+7%) | 3mo | $1,610,000 | $455 | 69 |
| 469 Wall St | 0.20mi | 6/3.0 (+1) | 3,520 (+7%) | 7mo | $1,836,000 | $522 | 67 |
| 22 Muncy Dr | 0.41mi | 5/3.5 | 3,105 (-6%) | 7mo | $1,700,000 | $548 | 61 |
| 34 S Arlene Dr | 0.09mi | 6/3.5 (+1) | 3,473 (+5%) | 21mo | $1,462,500 | $421 | 61 |
| 32 Musket Ln | 0.39mi | 5/4.5 | 3,127 (-5%) | 9mo | $2,300,000 | $736 | 57 |
| 53 Arlene Dr | 0.53mi | 4/3.5 (-1) | 3,038 (-8%) | 0mo | $1,425,000 | $469 | 52 |
| 6 Sarah Ln | 0.43mi | 6/3.5 (+1) | 3,100 (-6%) | 19mo | $999,000 | $322 | 45 |
| 9 Abis Pl | 0.35mi | 4/4.0 (-1) | 2,897 (-12%) | 16mo | $1,100,000 | $380 | 39 |
Match score weights: distance 35% · size 25% · config 20% · recency 20%. Top-matched comps best support the ARV.
Projected returns pro-forma
-3.0% appreciation · 3.0% rent growth · sell at horizon
- IRR
- —
- Equity multiple
- 7.56×
- Total profit
- $2,938,955
- Equity at exit
- $238,565
- IRR
- —
- Equity multiple
- 15.91×
- Total profit
- $6,680,117
- Equity at exit
- $138,339
Cash invested: $448,000 (down + closing). Projections, not guarantees.
Landlord ↔ Tenant lean methodology
- Overall (STATE)
- 21 Tenant-Leaning
- State New Jersey
- 21 Tenant-Leaning · D+6
- County
- — inherits STATE
- City
- — inherits STATE
ZIP-level market 07764
- Home prices YoY
- -28.1%
- Active inventory
- 47
- Price-to-rent
- 1.7×
Monthly cashflow live
- Estimated rent
- $77,149 medium interval (Pro) →
- Mortgage (P&I)
- −$8,391
- Tax from tax record
- −$1,691 /mo · $20,293/yr
- Insurance
- −$667
- HOA
- −$0
- Vacancy / Maint / Mgmt
- −$16,201
- Net cashflow
- $50,200
Break-even live
UW: 25.0% down · 7.5% · 30yr · 1.5% tax · 5.0% vac · 8.0% maint · 8.0% mgmt
Financing live
Cash to close
- Down payment
- $400,000
- Closing costs
- $48,000
- Reserves months
- —
- Total cash needed
- —
Loan-product check · same deal, 3 products live
Conventional
25% down · 7.5% · 30yr
- Down + closing
- —
- Monthly P&I
- —
- Monthly cashflow
- —
- DSCR
- —
- Eligible?
- —
Personal DTI + credit; lowest rate.
DSCR
20% down · 8.5% · 30yr
- Down + closing
- —
- Monthly P&I
- —
- Monthly cashflow
- —
- DSCR
- —
- Eligible?
- —
No personal income docs; deal must DSCR.
Hard money
10% down · 12.0% · 12mo
- Down + closing
- —
- Monthly P&I
- —
- Monthly cashflow
- —
- DSCR
- —
- Eligible?
- —
Short-term bridge; refi at stabilization.
Rent comps 5 comps
| Address | Beds | Baths | Sqft | Rent | $/sqft | DOM | Units | Dist |
|---|---|---|---|---|---|---|---|---|
| 25 Muncy Dr West Long Branch, NJ | 5.0 | 4.0 | 4347 | $99,000 | $22.77 | 22d | 1 | 0.35mi |
| 63 Jamestown Rd Eatontown, NJ | 6.0 | 3.5 | 2755 | $70,000 | $25.41 | 22d | 1 | 0.41mi |
| 24 Valley Forge Rd Eatontown, NJ | 6.0 | 4.5 | 3934 | $4,500 | $1.14 | 1d | 1 | 0.46mi |
| 58 Georgetown Rd Eatontown, NJ | 5.0 | 4.0 | 3665 | $57,000 | $15.55 | 22d | 1 | 0.54mi |
| 24 Barbara Ln Oakhurst, NJ | 4.0 | 2.5 | 2331 | $2,500 | $1.07 | 24d | 1 | 1.34mi |
Listing history 14 events
-
2026-06-17status $1,600,000 Pending 41 DOM
-
2026-06-16days on market $1,600,000 Active 41 DOM
-
2026-06-15days on market $1,600,000 Active 40 DOM
-
2026-06-13days on market $1,600,000 Active 38 DOM
-
2026-06-13days on market $1,600,000 Active 37 DOM
-
2026-06-09days on market $1,600,000 Active 34 DOM
-
2026-06-08days on market $1,600,000 Active 33 DOM
-
2026-06-07days on market $1,600,000 Active 32 DOM
-
2026-06-04days on market $1,600,000 Active 29 DOM
-
2026-06-03days on market $1,600,000 Active 28 DOM
-
2026-06-02days on market $1,600,000 Active 27 DOM
-
2026-06-01days on market $1,600,000 Active 26 DOM
-
2026-05-31days on market $1,600,000 Active 25 DOM
-
2026-05-06$1,600,000 Active
ⓘ Source: listings_history table (triggers on properties + properties_extension) + one-shot
backfill from property_details.listing_events for pre-trigger history.
Tax reassessment forecast NJ · Partial reset (capped growth)
- Current annual tax
- $20,293 · $1,691/mo
- Projected year-2 tax
- $30,066 · $2,506/mo
- Expected delta
- +$9,774/yr (+$814/mo · 48.2%)
ⓘ Screening estimate from a state-policy table — verify with the county assessor before closing.
Climate risk First Street
- Flood 1/10 Low FEMA zone X (unshaded) · 0% chance over 30 yrs
- Wildfire 1/10 Low
- Heat 7/10 Severe 7 d/yr ≥94°F today · 16 d/yr by 30 yrs out
- Wind 8/10 Severe 80% chance of damaging wind over 30 yrs
- Air quality 3/10 Moderate 3 unhealthy d/yr today · 4 by 30 yrs out
Nearby sold comps map
Loading sold comps map…
Walkable amenities ~0.75 mi
Loading nearby amenities…
Taxation est. · year 1
- Rental income
- $925,793
- − Mortgage interest
- −$89,625
- − Property taxes
- −$20,293
- − Insurance
- −$8,000
- − Repairs & maintenance
- −$74,063
- − Management
- −$74,063
- − Depreciation
- −$46,545
- Taxable income
- $613,203
- Est. tax owed @ 24.0%
- −$147,169
- After-tax cash flow
- $455,228/yr
For passive investors: Depreciation is non-cash, so a rental often shows a tax loss while cash-flowing — sheltering income. Rental losses are passive: they offset passive income freely, and up to $25,000/yr can offset ordinary (W-2) income if you actively participate and your MAGI is under $100k (phasing out to $0 by $150k); unused losses carry forward. On sale, claimed depreciation is recaptured at up to 25%, and gains may owe capital-gains tax (a 1031 exchange can defer both). Figures are a year-1 estimate at your 24.0% rate — not tax advice; consult a CPA.
Schools (NCES district)
- District
- West Long Branch School District
- NCES district ID
- 3417490
- Math proficiency
- 37% ▼ -26.00%
- Reading proficiency
- 55% ▼ -9.00%
- Median HH income
- $87,522
- Composite
- 42.99/100
- National rank
- #3108
- State rank
- #154 of 472 in NJ
Livability — West Long Branch
- Score
- 70/100
- State rank
- #268
- US rank
- #7916
Category grades
Schools grade is shown separately in the Schools card above.
Census & demographics
- Census place
- West Long Branch, NJ
- City population
- 8,576
- Population (ZIP)
- 8,576
Population outlook (Monmouth County) Hauer SSP2
- Today (2025)
- 620,308 people
- By 2030
- 612,309 · -1.3%
- By 2040
- 587,297 · -5.3%
- By 2050
- 551,342 · -11.1%
- By 2075
- 472,934 · -23.8%
- By 2100
- 381,534 · -38.5%
Race, ethnicity, and origin ACS 2023
- Neighborhood character
- Predominantly White (80%)
- Race & ethnicity
- White 80% Hispanic / Latino 7% Two or more races 6% Black 5% Asian 1%
- Hispanic origin (detail)
- Puerto Rican 3%
- Common ancestry
- Romanian 5% Estonian 2% Portuguese 2%
- Foreign-born
- 8% · Canada
- Languages at home
- 89% English-only · Other Indo-European 6% Spanish 3% Russian/Polish/Slavic 1%
Political lean MEDSL · Monmouth
- 2024 margin
- R (+11.4) · D 43.4% · R 54.8% · Other 1.8%
- 2008→2024 swing
- -7.7pp toward R · 2008: -3.7pp · 2024: -11.4pp
- All cycles
- 2024: R+11.4 2020: R+2.8 2016: R+9.5 2012: R+5.5 2008: R+3.7
Not yet ingested
- Civics
- —
Market trends
- HPI YoY
- ▼ -169.51%
- Current HPI
- 432.648
- Rent YoY
- —
- Metro
- —
- State GDP YoY
- ▲ 2.05%
- F500 in state
- 34
Industry mix (Fortune 500 HQ in NJ)
| Industry | F500 HQs | Revenue |
|---|---|---|
| Consumer Goods | 3 | $31B |
|
||
| Pharmaceuticals | 2 | $153B |
|
||
| Technology | 2 | $21B |
|
||
| Insurance | 2 | $20B |
|
||
| Healthcare | 2 | $19B |
|
||
| Financial Services | 1 | $70B |
|
||
Price history
1 event — show timeline
- 2026-05-06 Listed $1,600,000 MOMLS
Property tax history
+2.3%/yrLatest (2025): $20,293 · +8.7% YoY. Source: county tax records.
Cash-flow waterfall
monthlySold comps — $/sqft
last 12 mo · ≤1 miLoading sold comps…