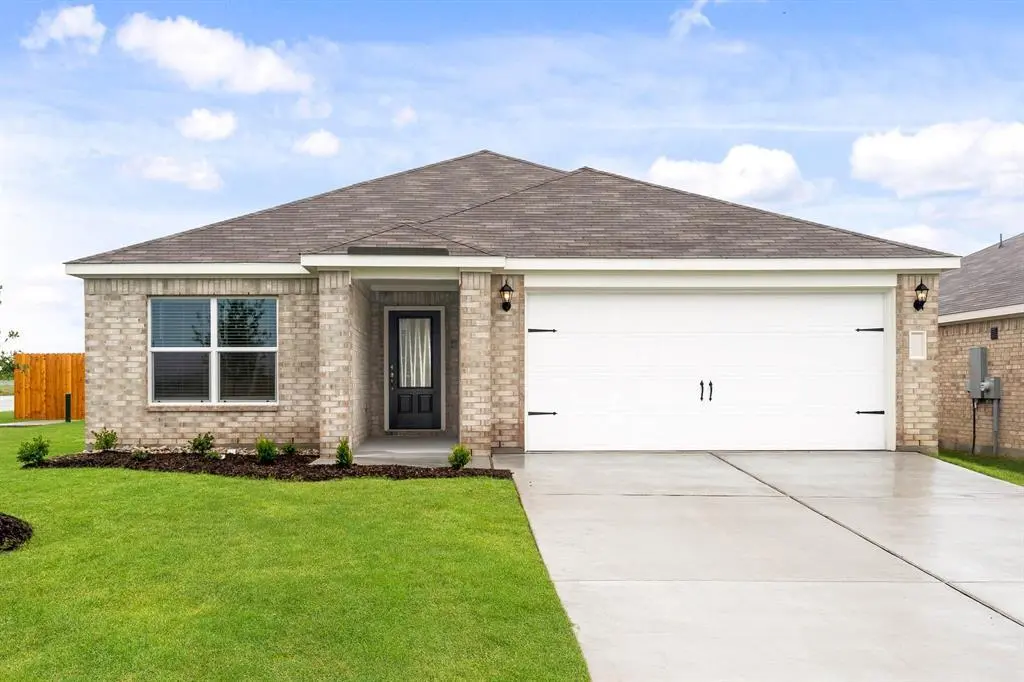
13429 Hang Fire Ln · Cresson, TX
Flood risk 1/10 · Minimal
- FEMA flood zone
- X (unshaded)
- Chance of flooding over 30 yrs
- 0.0%
- Est. flood insurance / yr
- $507 – $1,088
Fire risk 6/10 · Moderate
- Est. fire insurance / yr
- $1,222 – $2,270
Heat risk 7/10 · Major
- Hot days now (above 108°F)
- 7 days/yr
- Hot days in 30 yrs
- 23 days/yr
Wind risk 6/10 · Moderate
- Chance of severe wind over 30 yrs
- 27.0%
Air-quality risk 2/10 · Minimal
- Unhealthy air days now
- 1 days/yr
- Unhealthy air days in 30 yrs
- 2 days/yr
Risk factors via First Street. Map © Google.
Why this score? — see what drove the D grade
The composite is a weighted blend of 9 inputs, each scored 0–100. Each bar is that input's sub-score; the figure is the points it added to the 100-point composite (weight × sub-score).
- ARV discount +9.4/15.0
- Cash flow +9.1/30.0
- Appreciation +4.1/10.0
- Schools +4.0/10.0
- Condition / age +4.0/5.0
- 1% rule +3.2/10.0
- Livability +3.2/5.0
- DSCR +2.5/10.0
- Rent growth +2.5/5.0
$276,900
🖨 Deal sheet (PDF) 📄 Offer letter ✓ Due diligence
Listing remarks
The Blanco plan is a spacious three-bedroom, two-bathroom home with an open-concept layout perfect for comfortable living. The kitchen features wood cabinets, a kitchen island, granite countertops and stainless-steel Whirlpool appliances. Adjacent to the kitchen, the dining room is filled with natural light from large windows, creating an inviting atmosphere for gatherings and memorable family dinners. The family room was designed for relaxing and mingling with family and friends. The private master suite includes a spacious bedroom, private bathroom and a large walk-in closet. The covered back patio and fully fenced backyard on an oversized lot offer a secure area for children and pets, an
Key facts
- Large windows
- Natural light
- Kitchen island
Tags
Property features AI
Finance
- Financial info: Financing accepted: Cash, Conventional, FHA, USDA Loan, VA Loan; No second mortgage recorded
- HOA & community: Mandatory association; Quarterly association fee; Association fee covers full use of facilities, grounds maintenance, and management fees; HOA managed by Carter HOA Management
Exterior
- Parking: Attached 2-car garage with inside entrance; Garage faces front with 2-car single door; Covered parking for 2 vehicles; Concrete driveway
- Security: Smoke detector(s); Carbon monoxide detector(s)
- Utilities: MUD water and sewer; Electricity available; Natural gas available; Cable available; Co-op electric; Community mailbox
- Home design: Single family residence; One story; Residential property; Year built 2024; Not attached to another property; Subdivision: Cresson Estates
- Construction: Brick and siding exterior; Fiberglass shingle roof; Slab foundation
- Exterior features: Covered porch(es); Private yard; Landscaped; Back yard fenced with wood fencing
Interior
- Kitchen: Dishwasher; Disposal; Gas cooktop; Gas oven; Gas range; Microwave; Refrigerator; Water line to refrigerator; Built-in cabinets
- Bedrooms: 3 bedrooms (all on the main level); Primary bedroom with ensuite bath and walk-in closet
- Flooring: Carpet; Wood
- Bathrooms: 2 full bathrooms (both on the main level); Primary bath with built-in cabinets and linen closet
- Heating & cooling: Central heating (natural gas); Central air (electric); Ceiling fan(s)
- Interior features: Open floorplan; Kitchen island; Pantry; Granite counters; Cable TV available; High speed internet available; Walk-in closet(s)
- Laundry & utility: Utility room on main level; Gas water heater; Tankless water heater
Neighborhood map
What this means for you Summary
Snapshot
- This is a 3-bed/2.0-bath single-family listed at $277k. Condition is rated good.
Deal economics
- At list price, monthly cash flow is $-214 ($-3k/yr) — negative.
- To cash-flow at today's rent, offer at most $239k (13.6% below list).
- To meet the 1% rule (rent ≥ 1% of price), the offer needs to be $227k (18.2% below list).
- Recommended offer: $227k (18.2% below list) — sets the bar for 1% rule.
- Cap rate 5.4% vs local median 3.3% in Cresson — top-decile yield for the area; either an underpriced asset or a hidden risk that comps aren't pricing in. Stress-test before assuming the spread holds.
Location & tenants
- Location reads 63/100 on livability (#843 in TX) — a middle-class / working-renter tenant base. Strengths: cost of living A+, housing A+, employment B+; Watch: health & safety D+, crime D, amenities F.
- Granbury ISD (town): math 46% / reading 46% proficiency, ranked #237 of 826 in TX (top 29%) — families likely to look elsewhere, expect single-tenant / working-renter base with shorter leases.
- Zoned schools: Acton El (math 52% / reading 46%, grade D, #926 of 4,322 statewide, top 22%, 814 students, 48% FRL); Acton Middle (math 52% / reading 48%, grade C, #347 of 1,662 statewide, top 21%, 981 students, 43% FRL); Granbury H S (math 38% / reading 51%, grade F, #652 of 1,632 statewide, top 43%, 2,202 students, 46% FRL) — zoned schools at 46% FRL track the district average.
- Market conditions: 97 active listings in the ZIP; 9 comparable units currently listed for rent nearby; rentals leasing fast (median 0d on market — plan ~1-2 weeks tenant-placement turnaround); 2,152 units permitted in Johnson County in 2024 (76 in 5+ unit buildings).
Forward outlook
- Local home prices are declining (-1.9%/yr); year-one equity from $2k of loan paydown is wiped out by about $5k of value loss. Plan a longer hold.
- Johnson County population projected at +24% by 2050 — long-run rental-demand tailwind backs the buy-and-hold thesis.
Negotiation context
- It's been on market 31 days — a 3% lower offer ($269k) is reasonable based on typical stale-listing flexibility.
- 21 sale attempts since 2y ago; this cycle's ask is 12207% above the opening price — seller raised mid-cycle; expect resistance to lowballs.
Risks & watch-outs
- Climate carrying-cost: major wind risk, 27% chance of damaging wind over 30y; major wildfire risk; extreme-heat days projected 7→23/yr by 2055 (HVAC capex compounding) — expect insurance premiums to compound above CPI over the hold.
Questions for the listing agent
- What do current leases actually rent for vs. the listed asking? Can we see a recent rent roll and the last 12 months of T-12 income?
- It's been on market 31 days. Have you received any prior offers? Is the seller open to a 18% concession, seller financing, or rate buy-down credit?
- What does the HOA fee cover, when was the last increase, and are there any pending special assessments or reserve-fund shortfalls?
- Is there a deadline driving the sale (1031 exchange, divorce, estate, relocation)? That informs how much negotiation room exists.
- Schools are F-rated, which usually means shorter tenancies and higher turnover. Who's the typical renter profile here, and what's been the actual vacancy rate?
- Crime grade is D in this area — have there been break-ins, vandalism, or insurance claims at this property in the last 3 years? What carrier currently insures it and at what premium?
- The area grade is low — what's the realistic commute time and amenity access for the typical tenant pool here? Any planned neighborhood developments (good or bad) we should know about?
- What's the average days-on-market for RENTAL listings here right now (not sales)? A rising rental-DOM trend means longer vacancies and softer asking-rent achievability than the comps imply.
- What's the recent tenant-quality profile in this submarket — average credit score on applications, eviction rate, late-payment / NSF rate, and stable-employment percentage? A property-management company in the area should have these aggregated.
- How much new for-sale + rental construction is in the pipeline within 1–3 miles? Heavy new supply typically softens prices + rents 12–24 months out; constrained supply supports both.
Investment metrics
- 1% rule
- 0.82% ✗
- Cap rate
- 5.37%
- Cash-on-cash
- -3.31%
- DSCR
- 0.85
- GRM
- 10.2
CMA / ARV
- ARV (median comp)
- $289,033
- List price
- $276,900
- Delta
- -3.16%
- Verdict
- FAIR
- Comps
- 20 within 1.0 mi
Show comp detail 12 sales within ~0.75 mi
| Address | Dist | Beds/Ba | Sqft | Sold | Price | $/sf | Match |
|---|---|---|---|---|---|---|---|
| 13417 Gitty Up Cir | 0.06mi | 3/2.0 | 1,658 (+5%) | 3mo | $299,900 | $181 | 86 |
| 13404 Gitty Up Cir | 0.11mi | 3/2.0 | 1,658 (+5%) | 3mo | $304,900 | $184 | 84 |
| 13421 Hang Fire Ln | 0.02mi | 3/2.0 | 1,658 (+5%) | 12mo | $286,900 | $173 | 81 |
| 13524 Gunsmoke Ln | 0.18mi | 3/2.0 | 1,532 (-3%) | 10mo | $289,240 | $189 | 78 |
| 13413 Hang Fire Ln | 0.04mi | 4/2.0 (+1) | 1,784 (+13%) | 0mo | $304,900 | $171 | 71 |
| 13400 Stage Coach Ln | 0.08mi | 3/2.0 | 1,379 (-13%) | 12mo | $307,900 | $223 | 66 |
| 13484 Stage Coach Ln | 0.11mi | 4/2.0 (+1) | 1,729 (+10%) | 11mo | $294,990 | $171 | 65 |
| 13477 Stage Coach Ln | 0.10mi | 4/2.0 (+1) | 1,729 (+10%) | 12mo | $284,990 | $165 | 64 |
| 13441 Gitty UP Cir | 0.09mi | 4/2.0 (+1) | 1,790 (+14%) | 9mo | $299,990 | $168 | 60 |
| 13596 Gunsmoke Ln | 0.38mi | 3/2.0 | 1,440 (-9%) | 9mo | $268,770 | $187 | 60 |
| 13577 Stage Coach Ln | 0.39mi | 3/2.0 | 1,440 (-9%) | 10mo | $279,990 | $194 | 59 |
| 13408 Gitty Up Cir | 0.10mi | 4/2.0 (+1) | 1,784 (+13%) | 12mo | $297,900 | $167 | 59 |
Match score weights: distance 35% · size 25% · config 20% · recency 20%. Top-matched comps best support the ARV.
Projected returns pro-forma
-1.87% appreciation · 3.0% rent growth · sell at horizon
- IRR
- -14.7%
- Equity multiple
- 0.42×
- Total profit
- $-45,052
- Equity at exit
- $55,481
- IRR
- -7.3%
- Equity multiple
- 0.43×
- Total profit
- $-44,417
- Equity at exit
- $49,048
Cash invested: $77,532 (down + closing). Projections, not guarantees.
Landlord ↔ Tenant lean methodology
- Overall (STATE)
- 87 Strongly Landlord-Friendly
- State Texas
- 87 Strongly Landlord-Friendly · R+5
- County
- — inherits STATE
- City
- — inherits STATE
ZIP-level market 76035
- Home prices YoY
- -1.0%
- Active inventory
- 97
- Price-to-rent
- 10.2×
Monthly cashflow live
- Estimated rent
- $2,265 high interval (Pro) →
- Mortgage (P&I)
- −$1,452
- Tax from tax record
- −$311 /mo · $3,730/yr
- Insurance
- −$115
- HOA
- −$125
- Vacancy / Maint / Mgmt
- −$476
- Net cashflow
- $-214
Break-even live
Sensitivity live
| Price | -10% $-57 | -5% $-135 | +0% $-214 | +5% $-292 | +10% $-371 |
|---|---|---|---|---|---|
| Rent | -10% $-393 | -5% $-303 | +0% $-214 | +5% $-124 | +10% $-35 |
| Rate | -1.0pp $-74 | -0.5pp $-143 | base $-214 | +0.5pp $-286 | +1.0pp $-359 |
UW: 25.0% down · 7.5% · 30yr · 1.5% tax · 5.0% vac · 8.0% maint · 8.0% mgmt
Financing live
Cash to close
- Down payment
- $69,225
- Closing costs
- $8,307
- Reserves months
- —
- Total cash needed
- —
Loan-product check · same deal, 3 products live
Conventional
25% down · 7.5% · 30yr
- Down + closing
- —
- Monthly P&I
- —
- Monthly cashflow
- —
- DSCR
- —
- Eligible?
- —
Personal DTI + credit; lowest rate.
DSCR
20% down · 8.5% · 30yr
- Down + closing
- —
- Monthly P&I
- —
- Monthly cashflow
- —
- DSCR
- —
- Eligible?
- —
No personal income docs; deal must DSCR.
Hard money
10% down · 12.0% · 12mo
- Down + closing
- —
- Monthly P&I
- —
- Monthly cashflow
- —
- DSCR
- —
- Eligible?
- —
Short-term bridge; refi at stabilization.
Rent comps 9 comps
| Address | Beds | Baths | Sqft | Rent | $/sqft | DOM | Units | Dist |
|---|---|---|---|---|---|---|---|---|
| 13404 Gitty Up Cir Cresson, TX | 3.0 | 2.0 | 1653 | $2,150 | $1.30 | 0d | 1 | 0.12mi |
| 13404 Balderdash Ct Cresson, TX | 3.0–5.0 | 2.0–2.5 | 2025 | $2,270 | $1.12 | 0d | 1 | 0.13mi |
| 13557 Gunsmoke Ln Cresson, TX | 4.0 | 2.0 | 1790 | $2,000 | $1.12 | 0d | 1 | 0.30mi |
| 13545 Bonanza Cir Cresson, TX | 3.0 | 2.0 | 1825 | $2,490 | $1.36 | 0d | 1 | 0.33mi |
| 13553 Bonanza Cir Cresson, TX | 2.0–3.0 | 2.0–2.5 | 1644 | $2,641 | $1.61 | 0d | 90 | 0.35mi |
| 13557 Bonanza Cir Cresson, TX | 3.0 | 2.0 | 1665 | $2,325 | $1.40 | 26d | 1 | 0.36mi |
| 13561 Bonanza Cir Cresson, TX | 2.0 | 2.0 | 1463 | $2,150 | $1.47 | 0d | 1 | 0.37mi |
| 13565 Bonanza Cir Cresson, TX | 3.0 | 2.0 | 1550 | $2,250 | $1.45 | 26d | 1 | 0.38mi |
| 13589 Gunsmoke Ln Cresson, TX | 3.0 | 2.5 | 1650 | $2,350 | $1.42 | 0d | 1 | 0.39mi |
HOA detail
- Monthly dues
- $125 · $1,500/yr
- Likely covers
- pool
Listing history 50 events
-
2026-06-21days on market $276,900 Active 31 DOM
-
2026-06-18days on market $276,900 Active 28 DOM
-
2026-06-17days on market $276,900 Active 27 DOM
-
2026-06-16days on market $276,900 Active 26 DOM
-
2026-06-15days on market $276,900 Active 25 DOM
-
2026-06-13days on market $276,900 Active 23 DOM
-
2026-06-09days on market $276,900 Active 19 DOM
-
2026-06-08days on market $276,900 Active 18 DOM
-
2026-06-07pricedays on market $276,900 Active 17 DOM
-
2026-06-04days on market $273,900 Active 14 DOM
-
2026-06-03days on market $273,900 Active 13 DOM
-
2026-06-02days on market $273,900 Active 12 DOM
-
2026-06-02days on market $273,900 Active 11 DOM
-
2026-05-31days on market $273,900 Active 10 DOM
-
2026-05-18historical
-
2026-05-07status Active
-
2026-03-24historical $2,190
-
2026-03-24status Pending
-
2026-03-08$2,190
-
2026-03-06$279,900 Active
-
2026-02-27historical $2,190
-
2026-02-26price $279,900
-
2026-02-26historical
-
2026-01-17$2,190
-
2026-01-14status Active
-
2026-01-07historical $2,190
-
2026-01-07status Pending
-
2026-01-04$2,190
-
2026-01-02$293,900 Active
-
2026-01-01historical $2,190
-
2025-12-31historical
-
2025-11-14$2,190
-
2025-11-13$293,900 Active
-
2025-01-23historical $2,085
-
2025-01-22historical
-
2025-01-18price $2,085
-
2025-01-15$1,955
-
2025-01-14historical $1,955
-
2025-01-02price $292,900
-
2024-12-23$289,900 Active
-
2024-12-20historical
-
2024-12-13$1,955
-
2024-12-13historical $1,955
-
2024-11-19$289,900 Active
-
2024-11-18historical
-
2024-11-07$1,955
-
2024-11-01price $289,900
-
2024-10-08$321,900 Active
-
2024-10-07historical
-
2024-10-03price $321,900
ⓘ Source: listings_history table (triggers on properties + properties_extension) + one-shot
backfill from property_details.listing_events for pre-trigger history.
Tax reassessment forecast TX · Resets to sale price
- Current annual tax
- $3,730 · $311/mo
- Projected year-2 tax
- $5,067 · $422/mo
- Expected delta
- +$1,337/yr (+$111/mo · 35.8%)
ⓘ Screening estimate from a state-policy table — verify with the county assessor before closing.
Climate risk First Street
- Flood 1/10 Low FEMA zone X (unshaded) · 0% chance over 30 yrs
- Wildfire 6/10 Major
- Heat 7/10 Severe 7 d/yr ≥108°F today · 23 d/yr by 30 yrs out
- Wind 6/10 Major 27% chance of damaging wind over 30 yrs
- Air quality 2/10 Low 1 unhealthy d/yr today · 2 by 30 yrs out
Nearby sold comps map
Loading sold comps map…
Walkable amenities ~0.75 mi
Loading nearby amenities…
Taxation est. · year 1
- Rental income
- $27,183
- − Mortgage interest
- −$15,511
- − Property taxes
- −$3,730
- − Insurance
- −$1,384
- − Repairs & maintenance
- −$2,175
- − Management
- −$2,175
- − HOA
- −$1,500
- − Depreciation
- −$8,055
- Taxable loss
- −$7,347
- Est. tax savings @ 24.0%
- +$1,763
- After-tax cash flow
- $-802/yr
For passive investors: Depreciation is non-cash, so a rental often shows a tax loss while cash-flowing — sheltering income. Rental losses are passive: they offset passive income freely, and up to $25,000/yr can offset ordinary (W-2) income if you actively participate and your MAGI is under $100k (phasing out to $0 by $150k); unused losses carry forward. On sale, claimed depreciation is recaptured at up to 25%, and gains may owe capital-gains tax (a 1031 exchange can defer both). Figures are a year-1 estimate at your 24.0% rate — not tax advice; consult a CPA.
Condition & rehab AI · 10 photos
This single-family home is in good condition with a good condition score of 80. It has a modern kitchen and bathrooms, a well-maintained exterior, and fresh paint. The home is move-in ready with minor cosmetic updates needed for increased resale and rental value.
Value-add opportunities
- Resale Paint exterior trim — Enhances curb appeal and value
- Rental Replace ceiling fan — Improves comfort and energy efficiency
Renovation cost estimate screening
Value-add ROI direction
- Resale Paint exterior trim — Enhances curb appeal and value ↑
- Rental Replace ceiling fan — Improves comfort and energy efficiency ↑
ⓘ Cost ranges are severity-bucket heuristics (US national rule-of-thumb). Get contractor quotes + a written scope before underwriting a rehab budget.
Schools (NCES district)
- District
- Granbury ISD
- NCES district ID
- 4821390
- Math proficiency
- 46% ▬ 0.00%
- Reading proficiency
- 46% ▲ 4.00%
- Median HH income
- $55,856
- Composite
- 40.04/100
- National rank
- #3820
- State rank
- #237 of 826 in TX
Livability — Cresson
- Score
- 63/100
- State rank
- #843
- US rank
- #15205
Category grades
Schools grade is shown separately in the Schools card above.
Census & demographics
- Population (ZIP)
- 3,247
Population outlook (Johnson County) Hauer SSP2
- Today (2025)
- 179,678 people
- By 2030
- 189,208 · +5.3%
- By 2040
- 207,261 · +15.4%
- By 2050
- 223,064 · +24.1%
- By 2075
- 259,979 · +44.7%
- By 2100
- 275,395 · +53.3%
Race, ethnicity, and origin ACS 2023
- Neighborhood character
- Predominantly White (72%)
- Race & ethnicity
- White 72% Hispanic / Latino 12% Two or more races 12% Black 11%
- Hispanic origin (detail)
- Mexican 11%
- Common ancestry
- Slovak 6% Lithuanian 6% Iranian 2%
- Foreign-born
- 3% · Canada
- Languages at home
- 93% English-only · Spanish 6%
Political lean MEDSL · Johnson
- 2024 margin
- Solid R (+51.4) · D 23.9% · R 75.3%
- 2008→2024 swing
- -3.9pp toward R · 2008: -47.5pp · 2024: -51.4pp
- All cycles
- 2024: R+51.4 2020: R+53.0 2016: R+58.3 2012: R+55.6 2008: R+47.5
Not yet ingested
- Civics
- —
Market trends
- HPI YoY
- ▼ -1.87%
- Current HPI
- 187.0174
- Rent YoY
- —
- Metro
- —
- State GDP YoY
- ▲ 3.95%
- F500 in state
- 110
Industry mix (Fortune 500 HQ in TX)
| Industry | F500 HQs | Revenue |
|---|---|---|
| Energy | 16 | $1,198B |
|
||
| Technology | 5 | $198B |
|
||
| Engineering / Construction | 4 | $72B |
|
||
| Energy Services | 3 | $60B |
|
||
| Utilities | 3 | $41B |
|
||
| Healthcare | 2 | $330B |
|
||
Price history
-99.3% since first listed48 events — show timeline
- 2026-06-05 Price Changed $2,300 NTREIS
- 2026-06-04 Price Changed $276,900 NTREIS
- 2026-05-22 Listed for Rent $2,250 NTREIS
- 2026-05-21 Listed $273,900 NTREIS
- 2026-05-18 Listing Removed — NTREIS
- 2026-05-07 Relisted — NTREIS
- 2026-03-24 Rental Removed $2,190 NTREIS
- 2026-03-24 Pending — NTREIS
- 2026-03-08 Listed for Rent $2,190 NTREIS
- 2026-03-06 Listed $279,900 NTREIS
- 2026-02-27 Rental Removed $2,190 NTREIS
- 2026-02-26 Price Changed $279,900 NTREIS
- 2026-02-26 Listing Removed — NTREIS
- 2026-01-17 Listed for Rent $2,190 NTREIS
- 2026-01-14 Relisted — NTREIS
- 2026-01-07 Rental Removed $2,190 NTREIS
- 2026-01-07 Pending — NTREIS
- 2026-01-04 Listed for Rent $2,190 NTREIS
- 2026-01-02 Listed $293,900 NTREIS
- 2026-01-01 Rental Removed $2,190 NTREIS
- 2025-12-31 Listing Removed — NTREIS
- 2025-11-14 Listed for Rent $2,190 NTREIS
- 2025-11-13 Listed $293,900 NTREIS
- 2025-01-23 Rental Removed $2,085 NTREIS
- 2025-01-22 Listing Removed — NTREIS
- 2025-01-18 Price Changed $2,085 NTREIS
- 2025-01-15 Listed for Rent $1,955 NTREIS
- 2025-01-14 Rental Removed $1,955 NTREIS
- 2025-01-02 Price Changed $292,900 NTREIS
- 2024-12-23 Listed $289,900 NTREIS
- 2024-12-20 Listing Removed — NTREIS
- 2024-12-13 Listed for Rent $1,955 NTREIS
- 2024-12-13 Rental Removed $1,955 NTREIS
- 2024-11-19 Listed $289,900 NTREIS
- 2024-11-18 Listing Removed — NTREIS
- 2024-11-07 Listed for Rent $1,955 NTREIS
- 2024-11-01 Price Changed $289,900 NTREIS
- 2024-10-08 Listed $321,900 NTREIS
- 2024-10-07 Listing Removed — NTREIS
- 2024-10-03 Price Changed $321,900 NTREIS
- 2024-09-05 Listed $317,900 NTREIS
- 2024-09-01 Listing Removed — NTREIS
- 2024-08-01 Listed $317,900 NTREIS
- 2024-07-31 Listing Removed — NTREIS
- 2024-06-28 Listed $317,900 NTREIS
- 2024-06-26 Listing Removed — NTREIS
- 2024-06-07 Price Changed $317,900 NTREIS
- 2024-05-17 Listed $314,900 NTREIS
Property tax history
+200.9%/yrLatest (2025): $3,730 · +1034.9% YoY. Source: county tax records.
Cash-flow waterfall
monthlySold comps — $/sqft
last 12 mo · ≤1 miLoading sold comps…