516 E Dragoon Trl · Mishawaka, IN
Flood risk 1/10 · Minimal
- FEMA flood zone
- X (unshaded)
- Chance of flooding over 30 yrs
- 0.0%
- Est. flood insurance / yr
- $507 – $1,088
Fire risk 1/10 · Minimal
- Est. fire insurance / yr
- $717 – $1,331
Heat risk 2/10 · Minimal
- Hot days now (above 99°F)
- 7 days/yr
- Hot days in 30 yrs
- 16 days/yr
Wind risk 2/10 · Minimal
- Chance of severe wind over 30 yrs
- —
Air-quality risk 2/10 · Minimal
- Unhealthy air days now
- 1 days/yr
- Unhealthy air days in 30 yrs
- 2 days/yr
Risk factors via First Street. Map © Google.
Why this score? — see what drove the B+ grade
The composite is a weighted blend of 9 inputs, each scored 0–100. Each bar is that input's sub-score; the figure is the points it added to the 100-point composite (weight × sub-score).
- Cash flow +30.0/30.0
- ARV discount +15.0/15.0
- DSCR +10.0/10.0
- 1% rule +8.8/10.0
- Schools +5.1/10.0
- Rent growth +4.8/5.0
- Livability +3.8/5.0
- Condition / age +2.5/5.0
- Appreciation +0.0/10.0
$135,000
🖨 Deal sheet 📄 Offer letter ✓ Due diligence
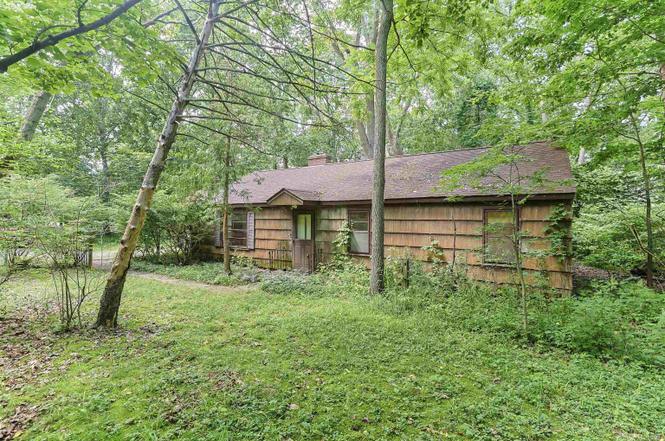
Listing remarks
Investor opportunity in Penn Schools! This 3-bedroom, 2-bath home is situated on a valuable 1+ acre lot on Dragoon Trail, just south of Mishawaka. Features include a living room with a fireplace, large family room, main floor laundry, a detached 1-car garage. and a convenient circular driveway. The property is in need of significant repairs and has extensive termite damage. Great potential for renovation, or land investment. Buyer should be aware that the City of Mishawaka will require connection to city water and sewer upon transfer. Property is being sold as-is. Square footage and measurements are approximate. Buyer to verify school assignments.
Key facts
- Large family room
- Main floor laundry
- Valuable acre lot
Tags
Property features AI
Finance
- Other: Zoned R1 Single Family Residential
Exterior
- Parking: Detached garage; Circular driveway; Off-street parking; 1 garage space
- Utilities: Private well water; Septic tank
- Home design: Single-family, site-built home; One story
- Construction: Cedar construction
- Exterior features: Shingle roof; Sloped, wooded lot
Interior
- Kitchen: Eat-in kitchen
- Bedrooms: 7 total rooms (includes bedrooms and living spaces)
- Bathrooms: 2 full bathrooms (both on the main level)
- Heating & cooling: Forced air heating (natural gas); Central air conditioning
- Interior features: Eat-in kitchen; Living room fireplace
- Laundry & utility: Main-level laundry
Neighborhood map
What this means for you Summary
Snapshot
- This is a 3-bed/2.0-bath single-family listed at $135k.
Deal economics
- At list price, monthly cash flow is $576 ($7k/yr) — positive.
- The deal already cash-flows at list — no discount required.
- Meets the 1% rule at list price ($2k rent vs $135k).
- Cap rate 11.4% vs local median 5.3% in Mishawaka — top-decile yield for the area; either an underpriced asset or a hidden risk that comps aren't pricing in. Stress-test before assuming the spread holds.
Location & tenants
- Location reads 76/100 on livability (#53 in IN, #3,586 nationally) — a middle-class / working-renter tenant base. Strengths: cost of living A+, housing A+, health & safety B; Watch: amenities F, employment F.
- Penn-Harris-Madison School Corporation (suburban): math 54% / reading 64% proficiency, ranked #19 of 301 in IN (top 6%) — acceptable for families but not a draw, mixed tenant base, ~2y average lease.
- Zoned schools: Virgil I Grissom Middle School (math 25% / reading 45%, grade F, #164 of 330 statewide, top 50%, 678 students, 46% FRL); Penn High School (math 53% / reading 83%, grade B, #22 of 369 statewide, top 6%, 3,624 students, 27% FRL) — zoned schools average 37% FRL vs 21% district-wide (16 pts higher); higher-poverty schools than district average — tighter screening recommended.
- Market conditions: Rents rising fast (+9.1%/yr); 140 active listings in the ZIP; 6 comparable units currently listed for rent nearby; rentals leasing fast (median 14d on market — plan ~1-2 weeks tenant-placement turnaround); 754 units permitted in St. Joseph County in 2024 (460 in 5+ unit buildings).
- This rent runs 38% of the median local income ($59k/yr) — at the standard rent-burdened threshold; future hikes will face affordability resistance.
Forward outlook
- Local home prices are declining (-3.0%/yr); year-one equity from $933 of loan paydown is wiped out by about $4k of value loss. Plan a longer hold.
- At projected returns (-3.0% appreciation + 8.0% rent growth), your $38k cash investment doubles in ~6 years — after that, you're playing with house money.
Negotiation context
- Only 3 days on market — expect competitive offers; lowballing is unlikely to land.
Risks & watch-outs
- Watch-outs: built in 1950 — expect roof / HVAC / electrical / plumbing capex.
Questions for the listing agent
- Built in 1950 — when were the roof, HVAC, electrical panel, plumbing, and water heater last replaced?
- Is there a deadline driving the sale (1031 exchange, divorce, estate, relocation)? That informs how much negotiation room exists.
- What's the average days-on-market for RENTAL listings here right now (not sales)? A rising rental-DOM trend means longer vacancies and softer asking-rent achievability than the comps imply.
- What's the recent tenant-quality profile in this submarket — average credit score on applications, eviction rate, late-payment / NSF rate, and stable-employment percentage? A property-management company in the area should have these aggregated.
- How much new for-sale + rental construction is in the pipeline within 1–3 miles? Heavy new supply typically softens prices + rents 12–24 months out; constrained supply supports both.
Investment metrics
- 1% rule
- 1.38% ✓
- Cap rate
- 11.41%
- Cash-on-cash
- 18.28%
- DSCR
- 1.81
- GRM
- 6.0
CMA / ARV
- ARV (on-the-fly)
- $236,128
- Comps found
- 12
Show comp detail 12 sales within ~0.75 mi
| Address | Dist | Beds/Ba | Sqft | Sold | Price | $/sf | Match |
|---|---|---|---|---|---|---|---|
| 615 E 15th St | 0.31mi | 3/1.0 | 1,506 (+0%) | 5mo | $175,000 | $116 | 77 |
| 820 Lovechio Dr | 0.36mi | 4/2.5 (+1) | 1,520 (+1%) | 5mo | $249,900 | $164 | 71 |
| 813 Lovechio Dr | 0.32mi | 3/2.0 | 1,620 (+8%) | 4mo | $255,000 | $157 | 68 |
| 731 Steeplechase Dr | 0.19mi | 4/2.0 (+1) | 1,624 (+8%) | 6mo | $270,000 | $166 | 68 |
| 821 Greenmount Ct | 0.30mi | 3/1.5 | 1,338 (-11%) | 2mo | $252,500 | $189 | 64 |
| 1417 Union St | 0.37mi | 4/1.0 (+1) | 1,412 (-6%) | 1mo | $90,200 | $64 | 63 |
| 16382 Petro Dr | 0.71mi | 3/1.5 | 1,474 (-2%) | 4mo | $302,000 | $205 | 58 |
| 911 S Laurel St | 0.66mi | 3/1.0 | 1,488 (-1%) | 7mo | $135,000 | $91 | 58 |
| 1204 Michigan Ave | 0.45mi | 3/2.0 | 1,372 (-9%) | 8mo | $196,000 | $143 | 58 |
| 1535 S Spring St | 0.55mi | 3/2.0 | 1,596 (+6%) | 9mo | $264,900 | $166 | 57 |
| 130 E 16th St | 0.42mi | 3/1.0 | 1,665 (+11%) | 8mo | $174,000 | $105 | 52 |
| 1014 S Main St | 0.66mi | 3/1.0 | 1,599 (+6%) | 6mo | $180,000 | $113 | 49 |
Match score weights: distance 35% · size 25% · config 20% · recency 20%. Top-matched comps best support the ARV.
Projected returns pro-forma
-3.0% appreciation · 8.0% rent growth · sell at horizon
- IRR
- 15.3%
- Equity multiple
- 1.65×
- Total profit
- $24,640
- Equity at exit
- $20,129
- IRR
- 27.4%
- Equity multiple
- 4.00×
- Total profit
- $113,498
- Equity at exit
- $11,672
Cash invested: $37,800 (down + closing). Projections, not guarantees.
Landlord ↔ Tenant lean methodology
- Overall (STATE)
- 90 Strongly Landlord-Friendly
- State Indiana
- 90 Strongly Landlord-Friendly · R+11
- County
- — inherits STATE
- City
- — inherits STATE
ZIP-level market 46544
- Rents YoY
- 9.1%
- Active inventory
- 140
- Price-to-rent
- 6.0×
Monthly cashflow live
- Estimated rent
- $1,863 medium interval (Pro) →
- Mortgage (P&I)
- −$708
- Tax from tax record
- −$132 /mo · $1,581/yr
- Insurance
- −$56
- HOA
- −$0
- Vacancy / Maint / Mgmt
- −$391
- Net cashflow
- $576
Break-even live
UW: 25.0% down · 7.5% · 30yr · 1.5% tax · 5.0% vac · 8.0% maint · 8.0% mgmt
Financing live
Cash to close
- Down payment
- $33,750
- Closing costs
- $4,050
- Reserves months
- —
- Total cash needed
- —
Loan-product check · same deal, 3 products live
Conventional
25% down · 7.5% · 30yr
- Down + closing
- —
- Monthly P&I
- —
- Monthly cashflow
- —
- DSCR
- —
- Eligible?
- —
Personal DTI + credit; lowest rate.
DSCR
20% down · 8.5% · 30yr
- Down + closing
- —
- Monthly P&I
- —
- Monthly cashflow
- —
- DSCR
- —
- Eligible?
- —
No personal income docs; deal must DSCR.
Hard money
10% down · 12.0% · 12mo
- Down + closing
- —
- Monthly P&I
- —
- Monthly cashflow
- —
- DSCR
- —
- Eligible?
- —
Short-term bridge; refi at stabilization.
Rent comps 6 comps
| Address | Beds | Baths | Sqft | Rent | $/sqft | DOM | Units | Dist |
|---|---|---|---|---|---|---|---|---|
| 642 E 11th St Mishawaka, IN | 3.0 | 1.0 | 1248 | $1,295 | $1.04 | 21d | 1 | 0.60mi |
| 1929 Blue Stem Ct Mishawaka, IN | 4.0 | 3.5 | 2213 | $2,900 | $1.31 | 13d | 1 | 1.00mi |
| 1434 Fallcreek Dr Mishawaka, IN | 2.0–3.0 | 1.0–2.0 | 1176 | $1,529 | $1.30 | 13d | 1 | 1.12mi |
| 507 Lincolnway E Unit 507 Mishawaka, IN | 2.0 | 1.0 | 1961 | $950 | $0.48 | 21d | 1 | 1.17mi |
| 1109 Hidden Lakes Dr Mishawaka, IN | 1.0–3.0 | 1.0–2.5 | 1392 | $2,755 | $1.98 | 13d | 74 | 1.24mi |
| 365 W Front St Mishawaka, IN | 2.0 | 1.0–2.0 | 825 | $3,050 | $3.70 | 13d | 1 | 1.41mi |
Listing history 4 events
-
2026-06-18days on market $135,000 Active 3 DOM
-
2026-06-17days on market $135,000 Active 2 DOM
-
2026-06-15remarks 655-char remark
-
2026-06-15$135,000 Active 1 DOM
ⓘ Source: listings_history table (triggers on properties + properties_extension) + one-shot
backfill from property_details.listing_events for pre-trigger history.
Tax reassessment forecast IN · Partial reset (capped growth)
- Current annual tax
- $1,581 · $132/mo
- Projected year-2 tax
- $1,581 · $132/mo
- Expected delta
- $0/yr ($0/mo · 0.0%)
ⓘ Screening estimate from a state-policy table — verify with the county assessor before closing.
Climate risk First Street
- Flood 1/10 Low FEMA zone X (unshaded) · 0% chance over 30 yrs
- Wildfire 1/10 Low
- Heat 2/10 Low 7 d/yr ≥99°F today · 16 d/yr by 30 yrs out
- Wind 2/10 Low
- Air quality 2/10 Low 1 unhealthy d/yr today · 2 by 30 yrs out
Nearby sold comps map
Loading sold comps map…
Walkable amenities ~0.75 mi
Loading nearby amenities…
Taxation est. · year 1
- Rental income
- $22,354
- − Mortgage interest
- −$7,562
- − Property taxes
- −$1,581
- − Insurance
- −$675
- − Repairs & maintenance
- −$1,788
- − Management
- −$1,788
- − Depreciation
- −$3,927
- Taxable income
- $5,032
- Est. tax owed @ 24.0%
- −$1,208
- After-tax cash flow
- $5,700/yr
For passive investors: Depreciation is non-cash, so a rental often shows a tax loss while cash-flowing — sheltering income. Rental losses are passive: they offset passive income freely, and up to $25,000/yr can offset ordinary (W-2) income if you actively participate and your MAGI is under $100k (phasing out to $0 by $150k); unused losses carry forward. On sale, claimed depreciation is recaptured at up to 25%, and gains may owe capital-gains tax (a 1031 exchange can defer both). Figures are a year-1 estimate at your 24.0% rate — not tax advice; consult a CPA.
Schools (NCES district)
- District
- Penn-Harris-Madison School Corporation
- NCES district ID
- 1808760
- Math proficiency
- 54% ▼ -11.00%
- Reading proficiency
- 64% ▼ -6.00%
- Median HH income
- $59,421
- Composite
- 51.11/100
- National rank
- #1764
- State rank
- #19 of 301 in IN
Livability — Mishawaka
- Score
- 76/100
- State rank
- #53
- US rank
- #3586
Category grades
Schools grade is shown separately in the Schools card above.
Census & demographics
- Census place
- Mishawaka, IN
- County
- Saint Joseph County · 189,048 people
- City population
- 57,683
- Metro
- South Bend-Mishawaka, IN-MI
- Population (ZIP)
- 31,077
- Household income
- $58,829
- Rent vs Own
- Severe rent burden
- 685.0
Population outlook (St. Joseph County) Hauer SSP2
- Today (2025)
- 273,186 people
- By 2030
- 273,594 · +0.1%
- By 2040
- 271,641 · -0.6%
- By 2050
- 269,187 · -1.5%
- By 2075
- 263,136 · -3.7%
- By 2100
- 245,659 · -10.1%
Race, ethnicity, and origin ACS 2023
- Neighborhood character
- Predominantly White (79%)
- Race & ethnicity
- White 79% Black 9% Two or more races 7% Hispanic / Latino 6% Asian 1%
- Hispanic origin (detail)
- Mexican 5%
- Common ancestry
- Romanian 7% English 3% Lithuanian 2%
- Foreign-born
- 4% · Canada, Vietnam
- Languages at home
- 94% English-only · Spanish 3%
Political lean MEDSL · St. Joseph
- 2024 margin
- Toss-up / Even · D 50.0% · R 48.5% · Other 1.5%
- 2008→2024 swing
- -15.6pp toward R · 2008: 17.1pp · 2024: 1.5pp
- All cycles
- 2024: D+1.5 2020: D+5.8 2016: D+0.2 2012: D+3.5 2008: D+17.1
Not yet ingested
- Civics
- —
Market trends
- HPI YoY
- ▼ -116.74%
- Current HPI
- 188.9996
- Rent YoY
- ▲ 9.10%
- Metro
- South Bend-Mishawaka, IN-MI
- State GDP YoY
- ▲ 2.90%
- F500 in state
- 18
Industry mix (Fortune 500 HQ in IN)
| Industry | F500 HQs | Revenue |
|---|---|---|
| Industrial Machinery | 2 | $37B |
|
||
| Healthcare | 1 | $177B |
|
||
| Pharmaceuticals | 1 | $45B |
|
||
| Metals / Steel | 1 | $18B |
|
||
| Agriculture | 1 | $17B |
|
||
| Packaging | 1 | $12B |
|
||
Price history
1 event — show timeline
- 2026-06-15 Listed $135,000 IRMLS
Property tax history
+10.9%/yrLatest (2025): $1,581 · +0.3% YoY. Source: county tax records.
Cash-flow waterfall
monthlySold comps — $/sqft
last 12 mo · ≤1 miLoading sold comps…