TBD Wolverine · Deltaville, VA
Flood risk 1/10 · Minimal
- FEMA flood zone
- X (unshaded)
- Chance of flooding over 30 yrs
- 0.0%
- Est. flood insurance / yr
- $507 – $1,088
Fire risk 4/10 · Minor
- Est. fire insurance / yr
- $666 – $1,236
Heat risk 9/10 · Severe
- Hot days now (above 103°F)
- 7 days/yr
- Hot days in 30 yrs
- 17 days/yr
Wind risk 8/10 · Major
- Chance of severe wind over 30 yrs
- 80.0%
Air-quality risk 1/10 · Minimal
- Unhealthy air days now
- 0 days/yr
- Unhealthy air days in 30 yrs
- 0 days/yr
Risk factors via First Street. Map © Google.
Why this score? — see what drove the D- grade
The composite is a weighted blend of 9 inputs, each scored 0–100. Each bar is that input's sub-score; the figure is the points it added to the 100-point composite (weight × sub-score).
- ARV discount +14.3/15.0
- Appreciation +10.0/10.0
- Schools +4.5/10.0
- Livability +3.0/5.0
- Rent growth +2.5/5.0
- Condition / age +2.5/5.0
- Cash flow +2.2/30.0
- 1% rule +0.0/10.0
- DSCR +0.0/10.0
$295,000
🖨 Deal sheet (PDF) 📄 Offer letter ✓ Due diligence
Listing remarks MLS
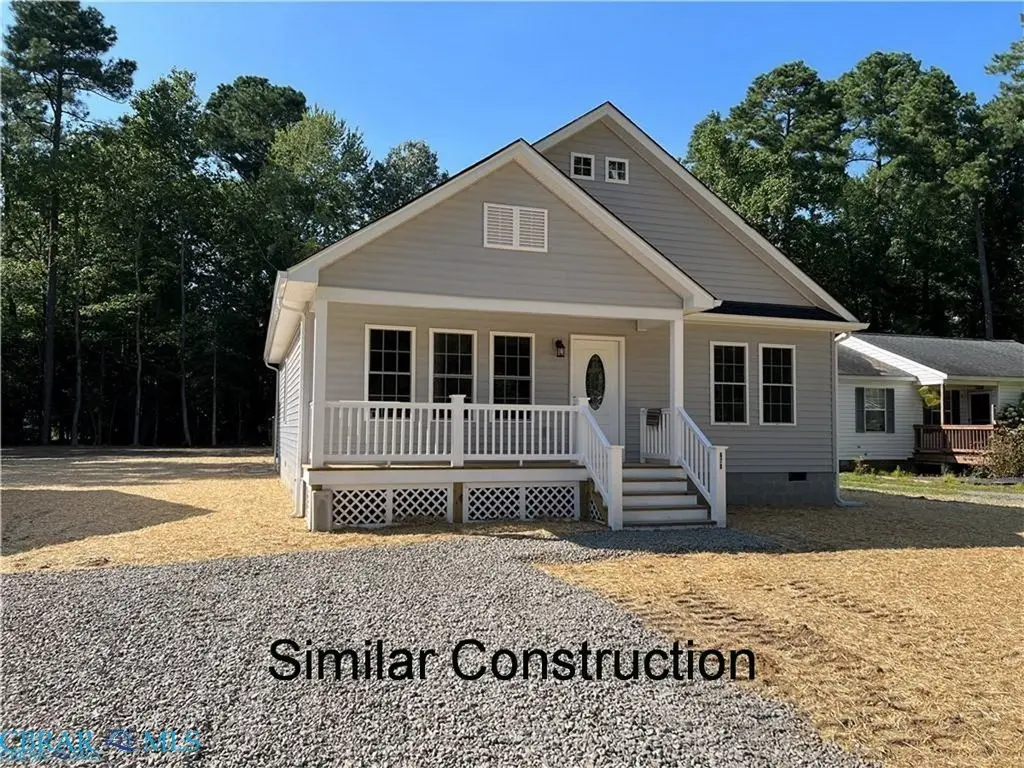
Delta Shores, To be Constructed, 3 Bedroom 2 bath Ranch style house with granite countertops, stainless appliances, vaulted ceiling in living room kitchen area, in water access community near Deltaville
Key facts
- Vaulted ceiling
- Stainless appliances
- Granite countertops
Tags
Neighborhood map
What this means for you Summary
Snapshot
- This is a 3-bed/2.0-bath single-family listed at $295k.
Deal economics
- At list price, monthly cash flow is $-1k ($-13k/yr) — negative.
- To cash-flow at today's rent, offer at most $141k (52.3% below list).
- To meet the 1% rule (rent ≥ 1% of price), the offer needs to be $124k (58.0% below list).
- Recommended offer: $124k (58.0% below list) — sets the bar for 1% rule.
- Cap rate 2.0% vs local median 0.9% in Deltaville — top-decile yield for the area; either an underpriced asset or a hidden risk that comps aren't pricing in. Stress-test before assuming the spread holds.
Location & tenants
- Location reads 60/100 on livability (#434 in VA) — a middle-class / working-renter tenant base. Strengths: health & safety B+; Watch: housing C-, schools D+, amenities F.
- Middlesex County Public School District (rural): math 45% / reading 59% proficiency, ranked #90 of 131 in VA (top 69%) — acceptable for families but not a draw, mixed tenant base, ~2y average lease.
- Market conditions: 38 active listings in the ZIP; 97 units permitted in Middlesex County in 2024 (0 in 5+ unit buildings).
Forward outlook
- In year one you build about $32k of equity ($2k loan paydown + $30k appreciation (10.0% local appreciation)).
- Middlesex County population projected at -21% by 2050 — secular population decline; favor cash flow + early exit over multi-decade hold.
- By year 2, paydown + projected appreciation supports a ~$51k cash-out refi (75% LTV) — recoverable capital for the next deal without selling this one.
Negotiation context
- It's been on market 102 days — a 9% lower offer ($268k) is reasonable based on typical stale-listing flexibility.
Risks & watch-outs
- Climate carrying-cost: severe wind risk, 80% chance of damaging wind over 30y; extreme-heat days projected 7→17/yr by 2055 (HVAC capex compounding) — expect insurance premiums to compound above CPI over the hold.
Questions for the listing agent
- What do current leases actually rent for vs. the listed asking? Can we see a recent rent roll and the last 12 months of T-12 income?
- It's been on market 102 days. Have you received any prior offers? Is the seller open to a 58% concession, seller financing, or rate buy-down credit?
- What does the HOA fee cover, when was the last increase, and are there any pending special assessments or reserve-fund shortfalls?
- Why hasn't it sold? Are there any deal-killer items the seller is aware of (foundation, flood, title, zoning, code violations)?
- Is there a deadline driving the sale (1031 exchange, divorce, estate, relocation)? That informs how much negotiation room exists.
- Schools are D-rated, which usually means shorter tenancies and higher turnover. Who's the typical renter profile here, and what's been the actual vacancy rate?
- The area grade is low — what's the realistic commute time and amenity access for the typical tenant pool here? Any planned neighborhood developments (good or bad) we should know about?
- What's the average days-on-market for RENTAL listings here right now (not sales)? A rising rental-DOM trend means longer vacancies and softer asking-rent achievability than the comps imply.
- What's the recent tenant-quality profile in this submarket — average credit score on applications, eviction rate, late-payment / NSF rate, and stable-employment percentage? A property-management company in the area should have these aggregated.
- How much new for-sale + rental construction is in the pipeline within 1–3 miles? Heavy new supply typically softens prices + rents 12–24 months out; constrained supply supports both.
Investment metrics
- 1% rule
- 0.42% ✗
- Cap rate
- 1.96%
- Cash-on-cash
- -15.48%
- DSCR
- 0.31
- GRM
- 19.8
CMA / ARV
- ARV (median comp)
- $347,287
- List price
- $295,000
- Delta
- -15.06%
- Verdict
- UNDERPRICED
- Comps
- 20 within 1.0 mi
Show comp detail 3 sales within ~0.75 mi
| Address | Dist | Beds/Ba | Sqft | Sold | Price | $/sf | Match |
|---|---|---|---|---|---|---|---|
| 134 Martin Ln | 0.60mi | 3/2.0 | 1,348 (+5%) | 15mo | $300,000 | $223 | 51 |
| 103 Robins Point Ave | 0.17mi | 2/1.5 (-1) | 1,156 (-10%) | 23mo | $205,000 | $177 | 50 |
| 24 Farmers Dell Ln | 0.39mi | 3/2.0 | 1,144 (-11%) | 19mo | $365,000 | $319 | 48 |
Match score weights: distance 35% · size 25% · config 20% · recency 20%. Top-matched comps best support the ARV.
Projected returns pro-forma
10.0% appreciation · 3.0% rent growth · sell at horizon
- IRR
- 13.5%
- Equity multiple
- 2.12×
- Total profit
- $92,804
- Equity at exit
- $265,759
- IRR
- 13.7%
- Equity multiple
- 4.96×
- Total profit
- $326,721
- Equity at exit
- $573,120
Cash invested: $82,600 (down + closing). Projections, not guarantees.
Landlord ↔ Tenant lean methodology
- Overall (STATE)
- 55 Moderately Landlord-Leaning
- State Virginia
- 55 Moderately Landlord-Leaning · D+2
- County
- — inherits STATE
- City
- — inherits STATE
ZIP-level market 23043
- Home prices YoY
- 11.6%
- Active inventory
- 38
- Price-to-rent
- 19.8×
Monthly cashflow live
- Estimated rent
- $1,239 medium interval (Pro) →
- Mortgage (P&I)
- −$1,547
- Tax est. 1.5%
- −$369 /mo · $4,425/yr
- Insurance
- −$123
- HOA
- −$6
- Vacancy / Maint / Mgmt
- −$260
- Net cashflow
- $-1,066
Break-even live
Sensitivity live
| Price | -10% $-862 | -5% $-964 | +0% $-1,066 | +5% $-1,168 | +10% $-1,270 |
|---|---|---|---|---|---|
| Rent | -10% $-1,164 | -5% $-1,115 | +0% $-1,066 | +5% $-1,017 | +10% $-968 |
| Rate | -1.0pp $-917 | -0.5pp $-991 | base $-1,066 | +0.5pp $-1,142 | +1.0pp $-1,220 |
UW: 25.0% down · 7.5% · 30yr · 1.5% tax · 5.0% vac · 8.0% maint · 8.0% mgmt
Financing live
Cash to close
- Down payment
- $73,750
- Closing costs
- $8,850
- Reserves months
- —
- Total cash needed
- —
Loan-product check · same deal, 3 products live
Conventional
25% down · 7.5% · 30yr
- Down + closing
- —
- Monthly P&I
- —
- Monthly cashflow
- —
- DSCR
- —
- Eligible?
- —
Personal DTI + credit; lowest rate.
DSCR
20% down · 8.5% · 30yr
- Down + closing
- —
- Monthly P&I
- —
- Monthly cashflow
- —
- DSCR
- —
- Eligible?
- —
No personal income docs; deal must DSCR.
Hard money
10% down · 12.0% · 12mo
- Down + closing
- —
- Monthly P&I
- —
- Monthly cashflow
- —
- DSCR
- —
- Eligible?
- —
Short-term bridge; refi at stabilization.
HOA detail
- Monthly dues
- $6 · $72/yr
- Likely covers
- water
Listing history 17 events
-
2026-06-21days on market $295,000 Active 102 DOM
-
2026-06-18days on market $295,000 Active 100 DOM
-
2026-06-17days on market $295,000 Active 99 DOM
-
2026-06-16days on market $295,000 Active 98 DOM
-
2026-06-15days on market $295,000 Active 97 DOM
-
2026-06-15days on market $295,000 Active 96 DOM
-
2026-06-13days on market $295,000 Active 95 DOM
-
2026-06-12days on market $295,000 Active 94 DOM
-
2026-06-09days on market $295,000 Active 91 DOM
-
2026-06-08days on market $295,000 Active 90 DOM
-
2026-06-08days on market $295,000 Active 89 DOM
-
2026-06-07days on market $295,000 Active 88 DOM
-
2026-06-03days on market $295,000 Active 85 DOM
-
2026-06-02days on market $295,000 Active 84 DOM
-
2026-06-01days on market $295,000 Active 83 DOM
-
2026-05-31days on market $295,000 Active 82 DOM
-
2026-03-10$295,000 Active 202-char remark
Show marketing remark (202 chars)
Delta Shores, To be Constructed, 3 Bedroom 2 bath Ranch style house with granite countertops, stainless appliances, vaulted ceiling in living room kitchen area, in water access community near Deltaville
ⓘ Source: listings_history table (triggers on properties + properties_extension) + one-shot
backfill from property_details.listing_events for pre-trigger history.
Climate risk First Street
- Flood 1/10 Low FEMA zone X (unshaded) · 0% chance over 30 yrs
- Wildfire 4/10 Moderate
- Heat 9/10 Extreme 7 d/yr ≥103°F today · 17 d/yr by 30 yrs out
- Wind 8/10 Severe 80% chance of damaging wind over 30 yrs
- Air quality 1/10 Low 0 unhealthy d/yr today · 0 by 30 yrs out
Nearby sold comps map
Loading sold comps map…
Walkable amenities ~0.75 mi
Loading nearby amenities…
Taxation est. · year 1
- Rental income
- $14,869
- − Mortgage interest
- −$16,525
- − Property taxes
- −$4,425
- − Insurance
- −$1,475
- − Repairs & maintenance
- −$1,189
- − Management
- −$1,189
- − HOA
- −$72
- − Depreciation
- −$8,582
- Taxable loss
- −$18,589
- Est. tax savings @ 24.0%
- +$4,461
- After-tax cash flow
- $-8,329/yr
For passive investors: Depreciation is non-cash, so a rental often shows a tax loss while cash-flowing — sheltering income. Rental losses are passive: they offset passive income freely, and up to $25,000/yr can offset ordinary (W-2) income if you actively participate and your MAGI is under $100k (phasing out to $0 by $150k); unused losses carry forward. On sale, claimed depreciation is recaptured at up to 25%, and gains may owe capital-gains tax (a 1031 exchange can defer both). Figures are a year-1 estimate at your 24.0% rate — not tax advice; consult a CPA.
Schools (NCES district)
- District
- Middlesex County Public School District
- NCES district ID
- 5102490
- Math proficiency
- 45% ▼ -35.00%
- Reading proficiency
- 59% ▼ -11.00%
- Median HH income
- $51,986
- Composite
- 44.58/100
- National rank
- #2783
- State rank
- #90 of 131 in VA
Livability — Deltaville
- Score
- 60/100
- State rank
- #434
- US rank
- #18625
Category grades
Schools grade is shown separately in the Schools card above.
Census & demographics
- City population
- 1,528
- Population (ZIP)
- 1,528
Population outlook (Middlesex County) Hauer SSP2
- Today (2025)
- 9,829 people
- By 2030
- 9,340 · -5.0%
- By 2040
- 8,411 · -14.4%
- By 2050
- 7,795 · -20.7%
- By 2075
- 7,471 · -24.0%
- By 2100
- 7,049 · -28.3%
Race, ethnicity, and origin ACS 2023
- Neighborhood character
- Predominantly White (89%)
- Race & ethnicity
- White 89% Asian 6% Two or more races 5% Hispanic / Latino 2%
- Common ancestry
- Romanian 5% Serbian 3% Slovak 2%
- Foreign-born
- 6% · Canada
- Languages at home
- 94% English-only · Other Indo-European 6% Russian/Polish/Slavic 1%
Political lean MEDSL · Middlesex
- 2024 margin
- Strong R (+27.4) · D 35.9% · R 63.3%
- 2008→2024 swing
- -8.2pp toward R · 2008: -19.2pp · 2024: -27.4pp
- All cycles
- 2024: R+27.4 2020: R+25.1 2016: R+26.0 2012: R+20.6 2008: R+19.2
Not yet ingested
- Civics
- —
Market trends
- HPI YoY
- ▲ 29.04%
- Current HPI
- 279.5259
- Rent YoY
- —
- Metro
- —
- State GDP YoY
- ▲ 2.40%
- F500 in state
- 50
Industry mix (Fortune 500 HQ in VA)
| Industry | F500 HQs | Revenue |
|---|---|---|
| Aerospace / Defense | 4 | $236B |
|
||
| Technology / Defense | 3 | $32B |
|
||
| Financial Services | 2 | $176B |
|
||
| Utilities | 2 | $27B |
|
||
| Insurance | 2 | $25B |
|
||
| Technology | 2 | $15B |
|
||
Price history
1 event — show timeline
- 2026-03-10 Listed $295,000 CBRAR
Cash-flow waterfall
monthlySold comps — $/sqft
last 12 mo · ≤1 miLoading sold comps…