 🏷️ Likely Rental
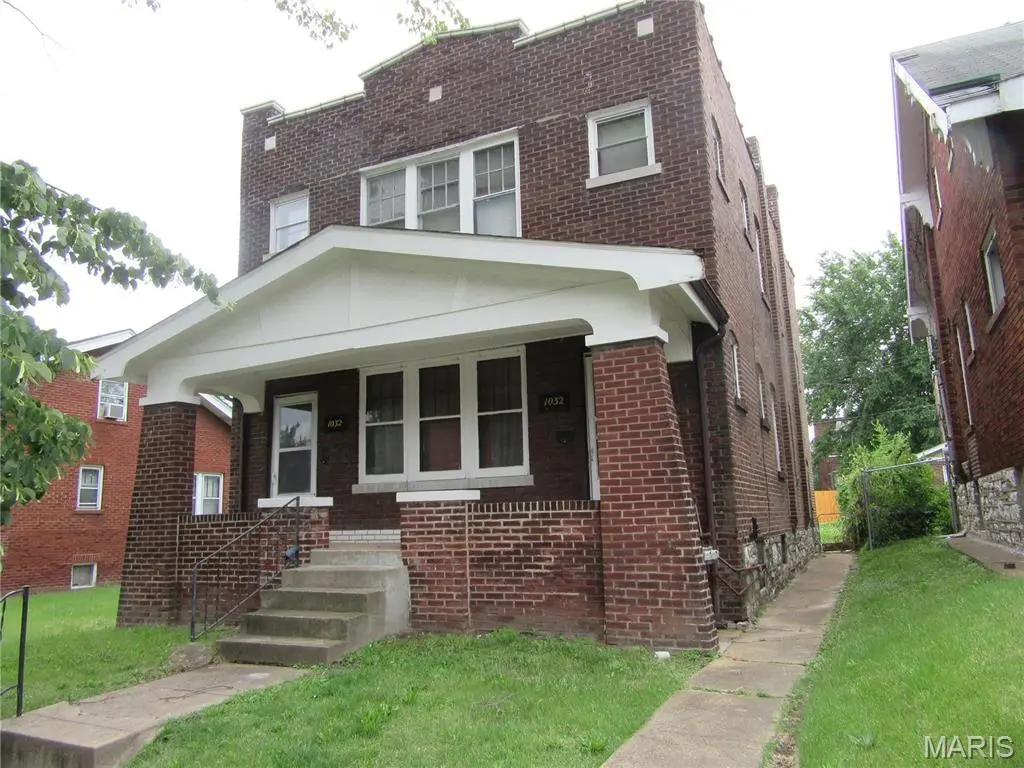
1032 Veronica Ave · St. Louis, MO
Flood risk 1/10 · Minimal
- FEMA flood zone
- X (unshaded)
- Chance of flooding over 30 yrs
- 0.0%
- Est. flood insurance / yr
- $473 – $860
Fire risk 1/10 · Minimal
- Est. fire insurance / yr
- $1,054 – $1,958
Heat risk 5/10 · Moderate
- Hot days now (above 107°F)
- 7 days/yr
- Hot days in 30 yrs
- 21 days/yr
Wind risk 2/10 · Minimal
- Chance of severe wind over 30 yrs
- 1.0%
Air-quality risk 4/10 · Minor
- Unhealthy air days now
- 5 days/yr
- Unhealthy air days in 30 yrs
- 6 days/yr
Risk factors via First Street. Map © Google.
Why this score? — see what drove the B grade
The composite is a weighted blend of 9 inputs, each scored 0–100. Each bar is that input's sub-score; the figure is the points it added to the 100-point composite (weight × sub-score).
- Cash flow +30.0/30.0
- ARV discount +15.0/15.0
- 1% rule +10.0/10.0
- DSCR +10.0/10.0
- Rent growth +2.5/5.0
- Livability +2.5/5.0
- Condition / age +2.5/5.0
- Schools +1.2/10.0
- Appreciation +0.0/10.0
$61,900
🖨 Deal sheet (PDF) 📄 Offer letter ✓ Due diligence
Multi-family units
County records classify this as Multi-Family (2-4 Unit). Listing-text estimate: 2 units. confirmed
Listing remarks
2 Family flat with 4-2-1 each unit. Do not disturb 2nd floor Tenant. Must have accepted contract to view 2nd floor. Property sold AS IS, Seller will not make any repairs. Newer A/C unit and Water heater 1st floor unit. Long term sect 8 tenant on secord floor. All inspections are for buyer's info. DO NOT SEND AGENT INSPECTION REPORT. 1st floor unit vacant SUPRA on handrail front porch.
Key facts
- Newer a/c unit
- 4,051 sq ft lot
- Built 1925
Tags
Property features AI
Finance
- Other: Living area reported as 2000 (assessor)
Exterior
- Parking: No carport spaces
- Utilities: Public water
- Home design: Residential income property (2–4 units); Two total units
- Construction: Brick construction; Stone foundation
- Exterior features: Public water
Interior
- Bedrooms: Bedrooms located on main and upper levels
- Flooring: Hardwood
- Bathrooms: Bathrooms located on main and upper levels
- Heating & cooling: Forced air heating; Central air conditioning
- Interior features: Hardwood flooring; Full basement
Neighborhood map
What this means for you Summary
Snapshot
- This is a 2 × 2-bed/1-bath units multifamily listed at $62k.
Deal economics
- At list price, monthly cash flow is $1k ($17k/yr) — positive. Per door: $692/mo.
- The deal already cash-flows at list — no discount required.
- Meets the 1% rule at list price ($2k rent vs $62k).
- Recommended offer: $61k (1.5% below list) — sets the bar for market timing.
- Cap rate 33.1% vs local median 5.0% in St. Louis — top-decile yield for the area; either an underpriced asset or a hidden risk that comps aren't pricing in. Stress-test before assuming the spread holds.
Location & tenants
- Location reads: area grade B — affects rentability + tenant quality, not the cash-flow math above.
- St. Louis City (urban): math 10% / reading 18% proficiency, ranked #312 of 324 in MO (top 96%) — low school quality limits family demand, transient renter base, plan for 1-2y turnover; 80% free/reduced lunch — lower-income household profile, screen leases tightly.
- Zoned schools: Earl Nance Sr. Elem. (math 2% / reading 2%, grade F, #1,099 of 1,115 statewide, top 100%, 321 students, 99% FRL); Gateway Middle (math 0% / reading 8%, grade F, #389 of 391 statewide, top 100%, 506 students, 99% FRL); Sumner High (math 2% / reading 2%, grade F, #520 of 521 statewide, top 100%, 264 students, 99% FRL) — zoned schools average 99% FRL vs 80% district-wide (19 pts higher); higher-poverty schools than district average — tighter screening recommended.
- Market conditions: 57 active listings in the ZIP; 2 comparable units currently listed for rent nearby; lower-income renter base — watch delinquency; 294 units permitted in St. Louis city in 2024 (227 in 5+ unit buildings).
- At $2,242/mo this rent would consume 65% of the median local household income ($41k/yr) (locally 418% of renters already pay >50% of income on rent) — very limited rent-growth headroom before tenants either downsize or default.
Forward outlook
- Local home prices are declining (-3.0%/yr); year-one equity from $428 of loan paydown is wiped out by about $2k of value loss. Plan a longer hold.
- St. Louis County population projected to shrink 6% by 2050 — rents likely to lag national; underwrite the cash flow, not the appreciation.
- At projected returns (-3.0% appreciation + 3.0% rent growth), your $17k cash investment doubles in ~2 years — after that, you're playing with house money.
Negotiation context
- It's been on market 26 days — a 2% lower offer ($61k) is reasonable based on typical stale-listing flexibility.
Risks & watch-outs
- Watch-outs: built in 1925 — expect roof / HVAC / electrical / plumbing capex.
- Climate carrying-cost: extreme-heat days projected 7→21/yr by 2055 (HVAC capex compounding) — expect insurance premiums to compound above CPI over the hold.
Questions for the listing agent
- Can we see the unit-by-unit rent roll, current vacancy, and any below-market leases? What's the average tenancy length?
- What capital expenditures (roof, boiler, parking lot, exteriors) have been made in the last 5 years, and what's planned in the next 2?
- Built in 1925 — when were the roof, HVAC, electrical panel, plumbing, and water heater last replaced?
- Is there a deadline driving the sale (1031 exchange, divorce, estate, relocation)? That informs how much negotiation room exists.
- What's the average days-on-market for RENTAL listings here right now (not sales)? A rising rental-DOM trend means longer vacancies and softer asking-rent achievability than the comps imply.
- What's the recent tenant-quality profile in this submarket — average credit score on applications, eviction rate, late-payment / NSF rate, and stable-employment percentage? A property-management company in the area should have these aggregated.
- How much new apartment / multifamily construction is in the pipeline within 1–3 miles? Heavy new supply (>2% of stock underway) typically softens rents 12–24 months out; light construction supports rent growth.
Investment metrics
- 1% rule
- 3.62% ✓
- Cap rate
- 33.13%
- Cash-on-cash
- 95.83%
- DSCR
- 5.26
- GRM
- 2.3
CMA / ARV
- ARV (on-the-fly)
- $122,000
- Comps found
- 1
Show comp detail 1 sale within ~0.75 mi
| Address | Dist | Beds/Ba | Sqft | Sold | Price | $/sf | Match |
|---|---|---|---|---|---|---|---|
| 8647 N Broadway | 0.33mi | 6/4.0 | 2,184 (+9%) | 10mo | $133,000 | $61 | 52 |
Match score weights: distance 35% · size 25% · config 20% · recency 20%. Top-matched comps best support the ARV.
Projected returns pro-forma
-3.0% appreciation · 3.0% rent growth · sell at horizon
- IRR
- 96.7%
- Equity multiple
- 5.51×
- Total profit
- $78,135
- Equity at exit
- $9,229
- IRR
- 99.4%
- Equity multiple
- 11.48×
- Total profit
- $181,590
- Equity at exit
- $5,352
Cash invested: $17,332 (down + closing). Projections, not guarantees.
Landlord ↔ Tenant lean methodology
- Overall (STATE)
- 81 Strongly Landlord-Friendly
- State Missouri
- 81 Strongly Landlord-Friendly · R+10
- County
- — inherits STATE
- City
- — inherits STATE
ZIP-level market 63147
- Home prices YoY
- -31.4%
- Active inventory
- 57
- Price-to-rent
- 4.6×
Monthly cashflow live
- Estimated rent
- $2,242 high interval (Pro) →
- Mortgage (P&I)
- −$325
- Tax from tax record
- −$37 /mo · $440/yr
- Insurance
- −$26
- HOA
- −$0
- Vacancy / Maint / Mgmt
- −$471
- Net cashflow
- $1,384
Break-even live
Sensitivity live
| Price | -10% $1,419 | -5% $1,402 | +0% $1,384 | +5% $1,367 | +10% $1,349 |
|---|---|---|---|---|---|
| Rent | -10% $1,207 | -5% $1,296 | +0% $1,384 | +5% $1,473 | +10% $1,561 |
| Rate | -1.0pp $1,415 | -0.5pp $1,400 | base $1,384 | +0.5pp $1,368 | +1.0pp $1,352 |
2-unit breakdown (identical units grouped — click to expand)
| Units | Beds | Baths | Est. rent |
|---|---|---|---|
| 2× units | 2 | 1 | $2,242 |
| #1 | 2 | 1 | $1,121 |
| #2 | 2 | 1 | $1,121 |
| Total (2 units) | $2,242 | ||
UW: 25.0% down · 7.5% · 30yr · 1.5% tax · 5.0% vac · 8.0% maint · 8.0% mgmt
Financing live
Cash to close
- Down payment
- $15,475
- Closing costs
- $1,857
- Reserves months
- —
- Total cash needed
- —
Loan-product check · same deal, 3 products live
Conventional
25% down · 7.5% · 30yr
- Down + closing
- —
- Monthly P&I
- —
- Monthly cashflow
- —
- DSCR
- —
- Eligible?
- —
Personal DTI + credit; lowest rate.
DSCR
20% down · 8.5% · 30yr
- Down + closing
- —
- Monthly P&I
- —
- Monthly cashflow
- —
- DSCR
- —
- Eligible?
- —
No personal income docs; deal must DSCR.
Hard money
10% down · 12.0% · 12mo
- Down + closing
- —
- Monthly P&I
- —
- Monthly cashflow
- —
- DSCR
- —
- Eligible?
- —
Short-term bridge; refi at stabilization.
Rent comps 2 comps
| Address | Beds | Baths | Sqft | Rent | $/sqft | DOM | Units | Dist |
|---|---|---|---|---|---|---|---|---|
| 5664 Hamilton Ave Saint Louis, MO | 2.0 | 2.0 | 1700 | $1,600 | $0.94 | 45d | 1 | 1.40mi |
| 44 Jendale Ct Saint Louis, MO | 2.0 | 2.0 | 1820 | $1,350 | $0.74 | 25d | 1 | 1.46mi |
Listing history 15 events
-
2026-06-21days on market $61,900 Active 26 DOM
-
2026-06-18days on market $61,900 Active 23 DOM
-
2026-06-17days on market $61,900 Active 22 DOM
-
2026-06-16days on market $61,900 Active 21 DOM
-
2026-06-15days on market $61,900 Active 20 DOM
-
2026-06-13pricedays on market $61,900 Active 18 DOM
-
2026-06-09days on market $64,900 Active 14 DOM
-
2026-06-08days on market $64,900 Active 13 DOM
-
2026-06-07days on market $64,900 Active 12 DOM
-
2026-06-05days on market $64,900 Active 9 DOM
-
2026-06-03days on market $64,900 Active 8 DOM
-
2026-06-02days on market $64,900 Active 7 DOM
-
2026-06-01days on market $64,900 Active 6 DOM
-
2026-05-31days on market $64,900 Active 5 DOM
-
2026-05-26$64,900 Active
ⓘ Source: listings_history table (triggers on properties + properties_extension) + one-shot
backfill from property_details.listing_events for pre-trigger history.
Tax reassessment forecast MO · Resets to sale price
- Current annual tax
- $440 · $37/mo
- Projected year-2 tax
- $600 · $50/mo
- Expected delta
- +$161/yr (+$13/mo · 36.6%)
ⓘ Screening estimate from a state-policy table — verify with the county assessor before closing.
Climate risk First Street
- Flood 1/10 Low FEMA zone X (unshaded) · 0% chance over 30 yrs
- Wildfire 1/10 Low
- Heat 5/10 Major 7 d/yr ≥107°F today · 21 d/yr by 30 yrs out
- Wind 2/10 Low 100% chance of damaging wind over 30 yrs
- Air quality 4/10 Moderate 5 unhealthy d/yr today · 6 by 30 yrs out
Nearby sold comps map
Loading sold comps map…
Walkable amenities ~0.75 mi
Loading nearby amenities…
Taxation est. · year 1
- Rental income
- $26,904
- − Mortgage interest
- −$3,467
- − Property taxes
- −$440
- − Insurance
- −$310
- − Repairs & maintenance
- −$2,152
- − Management
- −$2,152
- − Depreciation
- −$1,801
- Taxable income
- $16,582
- Est. tax owed @ 24.0%
- −$3,980
- After-tax cash flow
- $12,630/yr
For passive investors: Depreciation is non-cash, so a rental often shows a tax loss while cash-flowing — sheltering income. Rental losses are passive: they offset passive income freely, and up to $25,000/yr can offset ordinary (W-2) income if you actively participate and your MAGI is under $100k (phasing out to $0 by $150k); unused losses carry forward. On sale, claimed depreciation is recaptured at up to 25%, and gains may owe capital-gains tax (a 1031 exchange can defer both). Figures are a year-1 estimate at your 24.0% rate — not tax advice; consult a CPA.
Schools (NCES district)
- District
- St. Louis City
- NCES district ID
- 2929280
- Math proficiency
- 10% ▼ -6.00%
- Reading proficiency
- 18% ▼ -3.00%
- Median HH income
- $35,685
- Composite
- 11.54/100
- National rank
- #9699
- State rank
- #312 of 324 in MO
Livability — St. Louis
No livability data for this city. (Only ~50 U.S. cities are tracked.)
Census & demographics
- Census place
- St. Louis, MO
- County
- Saint Louis City · 254,015 people
- City population
- 283,259
- Metro
- St. Louis, MO-IL
- Population (ZIP)
- 8,173
- Household income
- $41,182
- Rent vs Own
- Severe rent burden
- 418.0
Population outlook (St. Louis County) Hauer SSP2
- Today (2025)
- 315,737 people
- By 2030
- 313,865 · -0.6%
- By 2040
- 305,439 · -3.3%
- By 2050
- 296,529 · -6.1%
- By 2075
- 271,028 · -14.2%
- By 2100
- 255,359 · -19.1%
Race, ethnicity, and origin ACS 2023
- Neighborhood character
- Predominantly Black (92%)
- Race & ethnicity
- Black 92% White 5% Two or more races 2%
- Foreign-born
- 0%
- Languages at home
- 99% English-only · Spanish 1%
Political lean MEDSL · St. Louis
- 2024 margin
- Solid D (+64.7) · D 81.4% · R 16.7% · Other 2.0%
- 2008→2024 swing
- -3.5pp toward R · 2008: 68.2pp · 2024: 64.7pp
- All cycles
- 2024: D+64.7 2020: D+66.2 2016: D+63.7 2012: D+66.6 2008: D+68.2
Not yet ingested
- Civics
- —
Market trends
- HPI YoY
- ▼ -38.51%
- Current HPI
- 84.224
- Rent YoY
- —
- Metro
- St. Louis, MO-IL
- State GDP YoY
- ▲ 1.84%
- F500 in state
- 20
Industry mix (Fortune 500 HQ in MO)
| Industry | F500 HQs | Revenue |
|---|---|---|
| Healthcare | 1 | $163B |
|
||
| Insurance | 1 | $21B |
|
||
| Industrial Technology | 1 | $17B |
|
||
| Retail | 1 | $16B |
|
||
| Industrial Distribution | 1 | $10B |
|
||
| Utilities | 1 | $9B |
|
||
Price history
1 event — show timeline
- 2026-05-26 Listed $64,900 MARIS as Distributed by MLS Grid
Property tax history
-1.8%/yrLatest (2022): $440 · +0.1% YoY. Source: county tax records.
Cash-flow waterfall
monthlySold comps — $/sqft
last 12 mo · ≤1 miLoading sold comps…