2721 Ky-26 · Corbin, KY
Flood risk 1/10 · Minimal
- FEMA flood zone
- X (unshaded)
- Chance of flooding over 30 yrs
- 0.0%
- Est. flood insurance / yr
- $473 – $860
Fire risk 5/10 · Moderate
- Est. fire insurance / yr
- $839 – $1,559
Heat risk 4/10 · Minor
- Hot days now (above 99°F)
- 7 days/yr
- Hot days in 30 yrs
- 20 days/yr
Wind risk 2/10 · Minimal
- Chance of severe wind over 30 yrs
- 4.0%
Air-quality risk 2/10 · Minimal
- Unhealthy air days now
- 0 days/yr
- Unhealthy air days in 30 yrs
- 1 days/yr
Risk factors via First Street. Map © Google.
Why this score? — see what drove the C- grade
The composite is a weighted blend of 9 inputs, each scored 0–100. Each bar is that input's sub-score; the figure is the points it added to the 100-point composite (weight × sub-score).
- Cash flow +17.5/30.0
- ARV discount +7.5/15.0
- Appreciation +5.9/10.0
- DSCR +5.5/10.0
- 1% rule +3.7/10.0
- Livability +3.5/5.0
- Schools +2.8/10.0
- Rent growth +2.5/5.0
- Condition / age +2.5/5.0
$159,900
🖨 Deal sheet (PDF) 📄 Offer letter ✓ Due diligence
Listing remarks
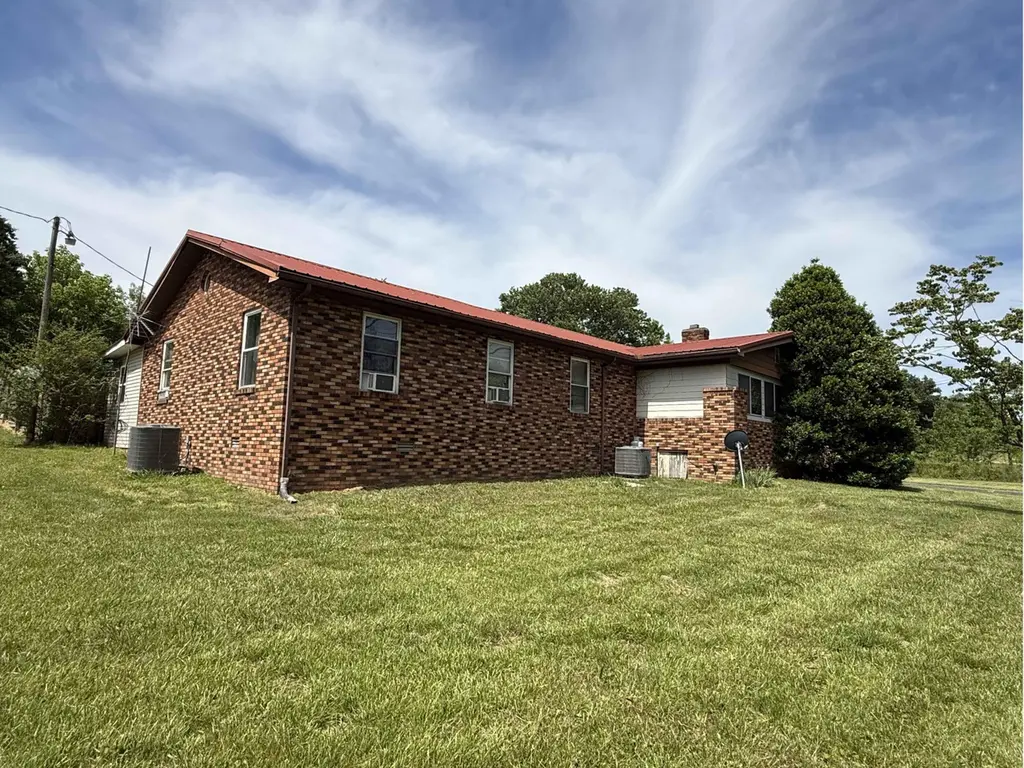
Located just minutes from downtown Corbin, this 2.68 acre property offers space, flexibility, and strong potential for the right buyer. The main home features approximately 2,856 square feet with 4 bedrooms and 2.5 bathrooms, including a large living room, dining area, and multiple additional spaces that can be used as an office, den, or flex rooms. The pool room offers direct access to the outdoor pool area. The home is livable but has deferred maintenance and will not qualify for government financing. It is priced accordingly and presents a great opportunity for someone looking to add value over time. There are no active leaks, though there is visible damage from previous ones in the pool
Key facts
- Massive workshop
- Updated hvac system
- Flat and usable yard
Tags
Property features AI
Exterior
- Parking: Driveway
- Utilities: Public water; Septic tank; Electricity connected; Water connected
- Home design: House; One story
- Construction: Brick veneer and vinyl siding exterior; Metal roof; Block foundation; Built as single-family house
- Exterior features: Barn(s); Shed(s); Workshop; Chain link fencing; In-ground pool
Interior
- Kitchen: Dishwasher; Refrigerator; Range
- Bedrooms: Primary on first floor
- Flooring: Laminate flooring; Vinyl flooring
- Bathrooms: 2 full bathrooms; 1 half bathroom
- Heating & cooling: Electric heating; Electric cooling; Heat pump
- Interior features: Entrance foyer; Eat-in kitchen; Primary bedroom on the first floor; Ceiling fans
- Laundry & utility: Washer hookup; Electric dryer hookup
Neighborhood map
What this means for you Summary
Snapshot
- This is a 4-bed/2.5-bath single-family listed at $160k.
Deal economics
- At list price, monthly cash flow is $124 ($1k/yr) — positive.
- The deal already cash-flows at list — no discount required.
- To meet the 1% rule (rent ≥ 1% of price), the offer needs to be $140k (12.6% below list).
- Recommended offer: $140k (12.6% below list) — sets the bar for 1% rule.
- Cap rate 7.2% vs local median 3.3% in Corbin — top-decile yield for the area; either an underpriced asset or a hidden risk that comps aren't pricing in. Stress-test before assuming the spread holds.
Location & tenants
- Location reads 69/100 on livability (#179 in KY) — a middle-class / working-renter tenant base. Strengths: cost of living A+, housing A+, crime A-; Watch: amenities F, commute F, employment F.
- Whitley County (rural): math 26% / reading 43% proficiency, ranked #80 of 165 in KY (top 48%) — families likely to look elsewhere, expect single-tenant / working-renter base with shorter leases; 70% free/reduced lunch — lower-income household profile, screen leases tightly.
- Zoned schools: Whitley County North Elementary School (math 8% / reading 32%, grade F, #568 of 676 statewide, top 84%, 321 students, 85% FRL); Whitley County Middle School (math 31% / reading 50%, grade F, #57 of 217 statewide, top 26%, 563 students, 80% FRL); Whitley County High School (math 22% / reading 37%, grade F, #127 of 254 statewide, top 58%, 980 students, 73% FRL).
- Market conditions: 331 active listings in the ZIP; 65 units permitted in Whitley County in 2024 (0 in 5+ unit buildings).
Forward outlook
- In year one you build about $4k of equity ($1k loan paydown + $3k appreciation (1.8% local appreciation)).
- Whitley County population projected to shrink 8% by 2050 — rents likely to lag national; underwrite the cash flow, not the appreciation.
- At projected returns (1.8% appreciation + 3.0% rent growth), your $45k cash investment doubles in ~7 years — after that, you're playing with house money.
- By year 8, paydown + projected appreciation supports a ~$30k cash-out refi (75% LTV) — recoverable capital for the next deal without selling this one.
Negotiation context
- It's been on market 36 days — a 3% lower offer ($155k) is reasonable based on typical stale-listing flexibility.
- 2 sale attempts since 17y ago with the ask held roughly flat each time — persistent listings suggest the price (not the market) is what's stuck; bring a comps-based counter.
Risks & watch-outs
- Climate carrying-cost: moderate wildfire risk — expect insurance premiums to compound above CPI over the hold.
Questions for the listing agent
- It's been on market 36 days. Have you received any prior offers? Is the seller open to a 13% concession, seller financing, or rate buy-down credit?
- Is there a deadline driving the sale (1031 exchange, divorce, estate, relocation)? That informs how much negotiation room exists.
- Schools are B-rated — typically a magnet for longer-tenancy family renters. What's the average tenant stay here, and is there a school-zone premium baked into asking?
- What's the average days-on-market for RENTAL listings here right now (not sales)? A rising rental-DOM trend means longer vacancies and softer asking-rent achievability than the comps imply.
- What's the recent tenant-quality profile in this submarket — average credit score on applications, eviction rate, late-payment / NSF rate, and stable-employment percentage? A property-management company in the area should have these aggregated.
- How much new for-sale + rental construction is in the pipeline within 1–3 miles? Heavy new supply typically softens prices + rents 12–24 months out; constrained supply supports both.
Investment metrics
- 1% rule
- 0.87% ✗
- Cap rate
- 7.22%
- Cash-on-cash
- 3.31%
- DSCR
- 1.15
- GRM
- 9.5
CMA / ARV
No comps found within radius.
Projected returns pro-forma
1.82% appreciation · 3.0% rent growth · sell at horizon
- IRR
- 7.3%
- Equity multiple
- 1.39×
- Total profit
- $17,362
- Equity at exit
- $61,556
- IRR
- 10.7%
- Equity multiple
- 2.42×
- Total profit
- $63,413
- Equity at exit
- $87,493
Cash invested: $44,772 (down + closing). Projections, not guarantees.
Landlord ↔ Tenant lean methodology
- Overall (STATE)
- 83 Strongly Landlord-Friendly
- State Kentucky
- 83 Strongly Landlord-Friendly · R+16
- County
- — inherits STATE
- City
- — inherits STATE
ZIP-level market 40701
- Home prices YoY
- 0.6%
- Active inventory
- 331
- Price-to-rent
- 9.5×
Monthly cashflow live
- Estimated rent
- $1,397 medium interval (Pro) →
- Mortgage (P&I)
- −$839
- Tax from tax record
- −$75 /mo · $900/yr
- Insurance
- −$67
- HOA
- −$0
- Vacancy / Maint / Mgmt
- −$293
- Net cashflow
- $124
Break-even live
Sensitivity live
| Price | -10% $214 | -5% $169 | +0% $124 | +5% $78 | +10% $33 |
|---|---|---|---|---|---|
| Rent | -10% $13 | -5% $68 | +0% $124 | +5% $179 | +10% $234 |
| Rate | -1.0pp $204 | -0.5pp $164 | base $124 | +0.5pp $82 | +1.0pp $40 |
UW: 25.0% down · 7.5% · 30yr · 1.5% tax · 5.0% vac · 8.0% maint · 8.0% mgmt
Financing live
Cash to close
- Down payment
- $39,975
- Closing costs
- $4,797
- Reserves months
- —
- Total cash needed
- —
Loan-product check · same deal, 3 products live
Conventional
25% down · 7.5% · 30yr
- Down + closing
- —
- Monthly P&I
- —
- Monthly cashflow
- —
- DSCR
- —
- Eligible?
- —
Personal DTI + credit; lowest rate.
DSCR
20% down · 8.5% · 30yr
- Down + closing
- —
- Monthly P&I
- —
- Monthly cashflow
- —
- DSCR
- —
- Eligible?
- —
No personal income docs; deal must DSCR.
Hard money
10% down · 12.0% · 12mo
- Down + closing
- —
- Monthly P&I
- —
- Monthly cashflow
- —
- DSCR
- —
- Eligible?
- —
Short-term bridge; refi at stabilization.
Listing history 21 events
-
2026-06-21days on market $159,900 Active 36 DOM
-
2026-06-21days on market $159,900 Active 35 DOM
-
2026-06-18days on market $159,900 Active 33 DOM
-
2026-06-17days on market $159,900 Active 32 DOM
-
2026-06-16days on market $159,900 Active 31 DOM
-
2026-06-15days on market $159,900 Active 30 DOM
-
2026-06-13days on market $159,900 Active 28 DOM
-
2026-06-12pricedays on market $159,900 Active 27 DOM
-
2026-06-09days on market $168,000 Active 24 DOM
-
2026-06-08days on market $168,000 Active 23 DOM
-
2026-06-07days on market $168,000 Active 22 DOM
-
2026-06-07days on market $168,000 Active 21 DOM
-
2026-06-04days on market $168,000 Active 18 DOM
-
2026-06-02days on market $168,000 Active 17 DOM
-
2026-06-01days on market $168,000 Active 16 DOM
-
2026-05-31days on market $168,000 Active 15 DOM
-
2026-05-31days on market $168,000 Active 14 DOM
-
2026-05-15$168,000 Active
-
2017-09-01soldstatus $170,000
-
2009-09-30historical
-
2009-04-19$168,000
ⓘ Source: listings_history table (triggers on properties + properties_extension) + one-shot
backfill from property_details.listing_events for pre-trigger history.
Tax reassessment forecast KY · Resets to sale price
- Current annual tax
- $900 · $75/mo
- Projected year-2 tax
- $1,375 · $115/mo
- Expected delta
- +$475/yr (+$40/mo · 52.8%)
ⓘ Screening estimate from a state-policy table — verify with the county assessor before closing.
Climate risk First Street
- Flood 1/10 Low FEMA zone X (unshaded) · 0% chance over 30 yrs
- Wildfire 5/10 Major
- Heat 4/10 Moderate 7 d/yr ≥99°F today · 20 d/yr by 30 yrs out
- Wind 2/10 Low 4% chance of damaging wind over 30 yrs
- Air quality 2/10 Low 0 unhealthy d/yr today · 1 by 30 yrs out
Nearby sold comps map
Loading sold comps map…
Walkable amenities ~0.75 mi
Loading nearby amenities…
Taxation est. · year 1
- Rental income
- $16,767
- − Mortgage interest
- −$8,957
- − Property taxes
- −$900
- − Insurance
- −$800
- − Repairs & maintenance
- −$1,341
- − Management
- −$1,341
- − Depreciation
- −$4,652
- Taxable loss
- −$1,224
- Est. tax savings @ 24.0%
- +$294
- After-tax cash flow
- $1,778/yr
For passive investors: Depreciation is non-cash, so a rental often shows a tax loss while cash-flowing — sheltering income. Rental losses are passive: they offset passive income freely, and up to $25,000/yr can offset ordinary (W-2) income if you actively participate and your MAGI is under $100k (phasing out to $0 by $150k); unused losses carry forward. On sale, claimed depreciation is recaptured at up to 25%, and gains may owe capital-gains tax (a 1031 exchange can defer both). Figures are a year-1 estimate at your 24.0% rate — not tax advice; consult a CPA.
Schools (NCES district)
- District
- Whitley County
- NCES district ID
- 2105880
- Math proficiency
- 26% ▼ -32.00%
- Reading proficiency
- 43% ▼ -25.00%
- Median HH income
- $29,079
- Composite
- 27.87/100
- National rank
- #6874
- State rank
- #80 of 165 in KY
Livability — Corbin
- Score
- 69/100
- State rank
- #179
- US rank
- #8891
Category grades
Schools grade is shown separately in the Schools card above.
Census & demographics
- Population (ZIP)
- 29,767
Population outlook (Whitley County) Hauer SSP2
- Today (2025)
- 35,362 people
- By 2030
- 34,807 · -1.6%
- By 2040
- 33,525 · -5.2%
- By 2050
- 32,550 · -8.0%
- By 2075
- 29,555 · -16.4%
- By 2100
- 24,308 · -31.3%
Race, ethnicity, and origin ACS 2023
- Neighborhood character
- Predominantly White (95%)
- Race & ethnicity
- White 95% Two or more races 3% Hispanic / Latino 1%
- Common ancestry
- Serbian 2% Slovak 2% Italian 1%
- Foreign-born
- 1% · Canada
- Languages at home
- 99% English-only · Spanish 1%
Political lean MEDSL · Whitley
- 2024 margin
- Solid R (+69.3) · D 14.8% · R 84.2% · Other 1.0%
- 2008→2024 swing
- -21.7pp toward R · 2008: -47.7pp · 2024: -69.3pp
- All cycles
- 2024: R+69.3 2020: R+65.2 2016: R+67.2 2012: R+57.8 2008: R+47.7
Not yet ingested
- Civics
- —
Market trends
- HPI YoY
- ▲ 1.82%
- Current HPI
- 294.7961
- Rent YoY
- —
- Metro
- —
- State GDP YoY
- ▲ 1.81%
- F500 in state
- 4
Industry mix (Fortune 500 HQ in KY)
| Industry | F500 HQs | Revenue |
|---|---|---|
| Healthcare | 1 | $118B |
|
||
| Food / Beverage | 1 | $7B |
|
||
Price history
+0.0% since first listed4 events — show timeline
- 2026-05-15 Listed $168,000 ImagineMLS
- 2017-09-01 Sold (Public Records) $170,000 Public Records
- 2009-09-30 Listing Removed — ImagineMLS
- 2009-04-19 Listed $168,000 ImagineMLS
Property tax history
-1.0%/yrLatest (2024): $900 · -7.8% YoY. Source: county tax records.
Cash-flow waterfall
monthlySold comps — $/sqft
last 12 mo · ≤1 miLoading sold comps…