 🏗️ New Construction
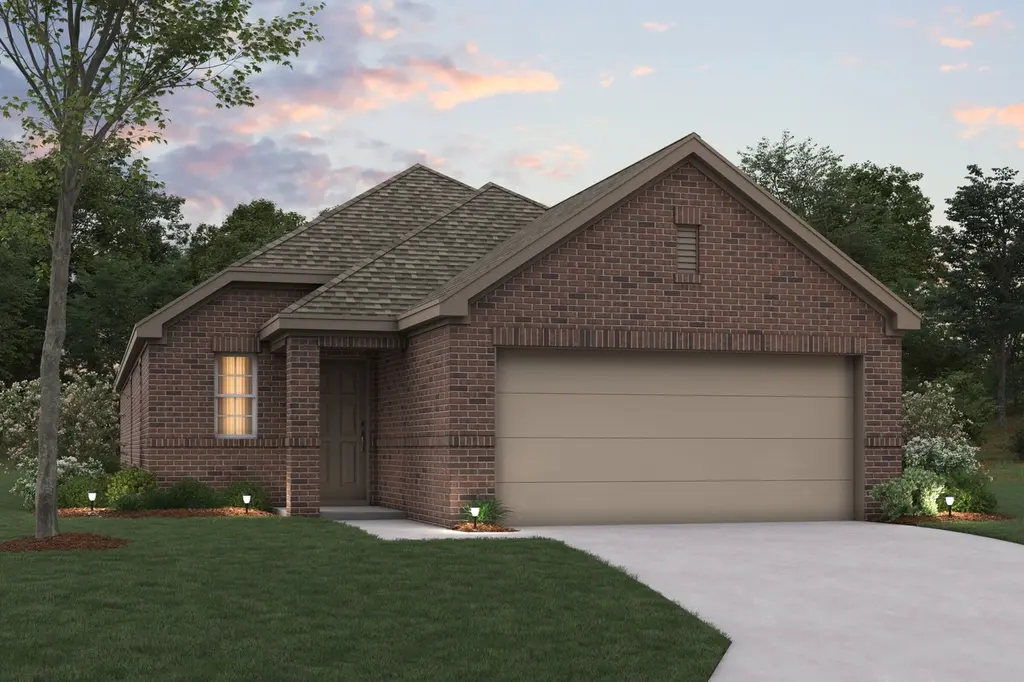
Boxwood Plan · Lavon, TX
Flood risk No data
- FEMA flood zone
- —
- Chance of flooding over 30 yrs
- —
- Est. flood insurance / yr
- —
Fire risk No data
- Est. fire insurance / yr
- —
Heat risk No data
- Hot days now (above threshold)
- —
- Hot days in 30 yrs
- —
Wind risk No data
- Chance of severe wind over 30 yrs
- —
Air-quality risk No data
- Unhealthy air days now
- —
- Unhealthy air days in 30 yrs
- —
Risk factors via First Street. Map © Google.
Why this score? — see what drove the F grade
The composite is a weighted blend of 9 inputs, each scored 0–100. Each bar is that input's sub-score; the figure is the points it added to the 100-point composite (weight × sub-score).
- ARV discount +7.5/15.0
- Cash flow +6.4/30.0
- Livability +3.3/5.0
- Schools +3.2/10.0
- Rent growth +2.5/5.0
- Condition / age +2.5/5.0
- 1% rule +1.5/10.0
- DSCR +0.7/10.0
- Appreciation +0.0/10.0
$287,990
🖨 Deal sheet (PDF) 📄 Offer letter ✓ Due diligence
Listing remarks MLS
This gorgeous 3-bedroom, 2-bathroom, and 1,699-1,748 square foot home offers exceptional design with plenty of space for entertaining family and friends. The expansive 16'x22' family room is the real star of the show, and with plenty of structural options to choose from, you'll easily be able to personalize this layout to fit your specific wants and needs.
Key facts
- Exceptional design
- 2 garage spots
- Listed 743 days
Tags
Neighborhood map
What this means for you Summary
Snapshot
- This is a 3-bed/2.0-bath single-family listed at $288k.
Deal economics
- At list price, monthly cash flow is $-610 ($-7k/yr) — negative.
- To cash-flow at today's rent, offer at most $261k (9.4% below list).
- To meet the 1% rule (rent ≥ 1% of price), the offer needs to be $228k (20.7% below list).
- Recommended offer: $228k (20.7% below list) — sets the bar for 1% rule.
Location & tenants
- Location reads 66/100 on livability (#588 in TX) — a middle-class / working-renter tenant base. Strengths: employment A+, housing A+, cost of living B; Watch: amenities F, commute F, health & safety F.
- Community ISD (rural): math 30% / reading 38% proficiency, ranked #479 of 826 in TX (top 58%) — families likely to look elsewhere, expect single-tenant / working-renter base with shorter leases.
- Zoned schools: Leland E Edge Middle (math 25% / reading 35%, grade F, #1,056 of 1,662 statewide, top 65%, 931 students, 53% FRL) — zoned schools average 53% FRL vs 36% district-wide (18 pts higher); higher-poverty schools than district average — tighter screening recommended.
- Market conditions: 640 active listings in the ZIP; 22 comparable units currently listed for rent nearby; rentals at typical pace (median 27d on market — plan ~3-4 weeks tenant-placement turnaround); 41% of comp listings sitting > 30 days — soft ceiling on asking rent; high-income renter base; 19,194 units permitted in Collin County in 2024 (3,988 in 5+ unit buildings).
Forward outlook
- Local home prices are declining (-3.0%/yr); year-one equity from $2k of loan paydown is wiped out by about $10k of value loss. Plan a longer hold.
- Collin County population projected at +60% by 2050 — long-run rental-demand tailwind backs the buy-and-hold thesis.
Negotiation context
- It's been on market 743 days — a 12% lower offer ($253k) is reasonable based on typical stale-listing flexibility.
Questions for the listing agent
- What do current leases actually rent for vs. the listed asking? Can we see a recent rent roll and the last 12 months of T-12 income?
- It's been on market 743 days. Have you received any prior offers? Is the seller open to a 21% concession, seller financing, or rate buy-down credit?
- Why hasn't it sold? Are there any deal-killer items the seller is aware of (foundation, flood, title, zoning, code violations)?
- Is there a deadline driving the sale (1031 exchange, divorce, estate, relocation)? That informs how much negotiation room exists.
- The area grade is low — what's the realistic commute time and amenity access for the typical tenant pool here? Any planned neighborhood developments (good or bad) we should know about?
- What's the average days-on-market for RENTAL listings here right now (not sales)? A rising rental-DOM trend means longer vacancies and softer asking-rent achievability than the comps imply.
- What's the recent tenant-quality profile in this submarket — average credit score on applications, eviction rate, late-payment / NSF rate, and stable-employment percentage? A property-management company in the area should have these aggregated.
- How much new for-sale + rental construction is in the pipeline within 1–3 miles? Heavy new supply typically softens prices + rents 12–24 months out; constrained supply supports both.
Investment metrics
- 1% rule
- 0.65% ✗
- Cap rate
- 4.20%
- Cash-on-cash
- -7.49%
- DSCR
- 0.67
- GRM
- 12.7
CMA / ARV
- ARV (median comp)
- $349,259
- List price
- $287,990
- Delta
- -17.54%
- Verdict
- UNDERPRICED
- Comps
- 20 within 1.0 mi
Show comp detail 12 sales within ~0.75 mi
| Address | Dist | Beds/Ba | Sqft | Sold | Price | $/sf | Match |
|---|---|---|---|---|---|---|---|
| 418 Silent Pond Park | 0.34mi | 3/2.5 | 1,699 (0%) | 0mo | $284,990 | $168 | 82 |
| 436 Silent Pond Park | 0.36mi | 3/2.0 | 1,649 (-3%) | 0mo | $299,990 | $182 | 78 |
| 755 Hidden Feather Dr | 0.46mi | 3/2.5 | 1,699 (0%) | 1mo | $288,990 | $170 | 76 |
| 489 Pleasant Field Dr | 0.47mi | 3/2.0 | 1,649 (-3%) | 1mo | $294,990 | $179 | 72 |
| 755 Grand Dale Dr | 0.19mi | 4/2.0 (+1) | 1,837 (+8%) | 1mo | $349,990 | $191 | 72 |
| 291 Bright Alcove Ct | 0.39mi | 3/2.0 | 1,889 (+11%) | 0mo | $346,990 | $184 | 63 |
| 519 Chase Creek Dr | 0.71mi | 4/2.0 (+1) | 1,800 (+6%) | 1mo | $329,999 | $183 | 51 |
| 471 Sweet Spring Dr | 0.72mi | 3/2.5 | 1,525 (-10%) | 1mo | $259,970 | $170 | 46 |
| 635 Dove Haven Way | 0.65mi | 3/2.0 | 1,448 (-15%) | 0mo | $295,990 | $204 | 45 |
| 615 Dove Haven Way | 0.60mi | 4/2.0 (+1) | 1,935 (+14%) | 2mo | $319,990 | $165 | 43 |
| 769 Sunglow Way | 0.70mi | 3/2.0 | 1,451 (-15%) | 1mo | $294,995 | $203 | 42 |
| 753 Sunglow Way | 0.69mi | 3/2.0 | 1,451 (-15%) | 2mo | $295,990 | $204 | 42 |
Match score weights: distance 35% · size 25% · config 20% · recency 20%. Top-matched comps best support the ARV.
Projected returns pro-forma
-3.0% appreciation · 3.0% rent growth · sell at horizon
- IRR
- -29.4%
- Equity multiple
- 0.02×
- Total profit
- $-95,423
- Equity at exit
- $52,076
- IRR
- -29.8%
- Equity multiple
- -0.36×
- Total profit
- $-132,995
- Equity at exit
- $30,198
Cash invested: $97,793 (down + closing). Projections, not guarantees.
Landlord ↔ Tenant lean methodology
- Overall (STATE)
- 87 Strongly Landlord-Friendly
- State Texas
- 87 Strongly Landlord-Friendly · R+5
- County
- — inherits STATE
- City
- — inherits STATE
ZIP-level market 75166
- Home prices YoY
- -9.9%
- Active inventory
- 640
- Price-to-rent
- 10.5×
Monthly cashflow live
- Estimated rent
- $2,283 high interval (Pro) →
- Mortgage (P&I)
- −$1,832
- Tax est. 1.5%
- −$437 /mo · $5,239/yr
- Insurance
- −$146
- HOA
- −$0
- Vacancy / Maint / Mgmt
- −$479
- Net cashflow
- $-610
Break-even live
Sensitivity live
| Price | -10% $-369 | -5% $-490 | +0% $-610 | +5% $-731 | +10% $-852 |
|---|---|---|---|---|---|
| Rent | -10% $-791 | -5% $-700 | +0% $-610 | +5% $-520 | +10% $-430 |
| Rate | -1.0pp $-434 | -0.5pp $-521 | base $-610 | +0.5pp $-701 | +1.0pp $-793 |
UW: 25.0% down · 7.5% · 30yr · 1.5% tax · 5.0% vac · 8.0% maint · 8.0% mgmt
Financing live
Cash to close
- Down payment
- $87,315
- Closing costs
- $10,478
- Reserves months
- —
- Total cash needed
- —
Loan-product check · same deal, 3 products live
Conventional
25% down · 7.5% · 30yr
- Down + closing
- —
- Monthly P&I
- —
- Monthly cashflow
- —
- DSCR
- —
- Eligible?
- —
Personal DTI + credit; lowest rate.
DSCR
20% down · 8.5% · 30yr
- Down + closing
- —
- Monthly P&I
- —
- Monthly cashflow
- —
- DSCR
- —
- Eligible?
- —
No personal income docs; deal must DSCR.
Hard money
10% down · 12.0% · 12mo
- Down + closing
- —
- Monthly P&I
- —
- Monthly cashflow
- —
- DSCR
- —
- Eligible?
- —
Short-term bridge; refi at stabilization.
Rent comps 22 comps
| Address | Beds | Baths | Sqft | Rent | $/sqft | DOM | Units | Dist |
|---|---|---|---|---|---|---|---|---|
| 445 Elevon Pkwy Unit 819 Nevada, TX | 2.0 | 2.0 | 1205 | $1,372 | $1.14 | 45d | 1 | 0.07mi |
| 312 Silent Pond Park Unit 312 Lavon, TX | 3.0 | 2.5 | 2016 | $2,900 | $1.44 | 45d | 1 | 0.22mi |
| 445 Elevon Pkwy Lavon, TX | 1.0–3.0 | 1.0–2.0 | 1143 | $2,029 | $1.77 | 1d | 25 | 0.44mi |
| 209 Little Bridge Dr Lavon, TX | 3.0 | 2.0 | 1913 | $2,400 | $1.25 | 1d | 1 | 0.55mi |
| 360 Elevon Pkwy Unit 2102 Lavon, TX | 2.0 | 2.0 | 1205 | $1,399 | $1.16 | 1d | 1 | 0.70mi |
| 544 Oak Creek Dr Lavon, TX | 4.0 | 2.0 | 1800 | $2,150 | $1.19 | 20d | 1 | 0.71mi |
| 455 Elevon Pkwy Lavon, TX | 1.0–3.0 | 1.0–2.0 | 1011 | $1,988 | $1.97 | 1d | 79 | 0.76mi |
| 613 Daybreak Ln Lavon, TX | 3.0 | 2.5 | 1905 | $2,300 | $1.21 | 45d | 1 | 0.81mi |
| 358 Rockstream Dr Lavon, TX | 4.0 | 3.0 | 2201 | $2,395 | $1.09 | 26d | 1 | 0.85mi |
| 600 Blooming Glade Lavon, TX | 3.0 | 2.0 | 1405 | $1,900 | $1.35 | 8d | 1 | 0.89mi |
| 849 Good Cheer Ln Lavon, TX | 3.0 | 2.0 | 1458 | $2,200 | $1.51 | 14d | 1 | 0.90mi |
| 906 Ramble Rd Lavon, TX | 3.0 | 2.0 | 1458 | $2,675 | $1.83 | 4d | 1 | 0.91mi |
| 918 Ramble Rd Lavon, TX | 3.0 | 2.0 | 1604 | $1,900 | $1.18 | 45d | 1 | 0.93mi |
| 860 Moonwake Dr Lavon, TX | 4.0 | 2.5 | 2011 | $2,800 | $1.39 | 45d | 1 | 0.93mi |
| 269 Sunshine Ln Lavon, TX | 4.0 | 3.0 | 2072 | $2,700 | $1.30 | 45d | 1 | 0.98mi |
| 579 White Water Dr Lavon, TX | 3.0 | 2.0 | 1838 | $2,000 | $1.09 | 26d | 1 | 1.11mi |
| 151 Villas Dr Lavon, TX | 3.0 | 1.0–3.0 | 871 | $2,345 | $2.69 | 0d | 104 | 1.24mi |
| 436 Grant Ln Lavon, TX | 3.0 | 2.0 | 1755 | $2,299 | $1.31 | 6d | 1 | 1.41mi |
| 590 Arthur Dr Lavon, TX | 3.0 | 2.0 | 1556 | $1,850 | $1.19 | 45d | 1 | 1.41mi |
| 476 Eisenhower Ln Lavon, TX | 3.0 | 2.0 | 1544 | $1,875 | $1.21 | 22d | 1 | 1.43mi |
| 453 Harding Ln Lavon, TX | 4.0 | 2.5 | 2155 | $2,200 | $1.02 | 45d | 1 | 1.45mi |
| 471 Harding Ln Lavon, TX | 4.0 | 2.0 | 1645 | $1,950 | $1.19 | 45d | 1 | 1.48mi |
Listing history 21 events
-
2026-06-21days on market $287,990 Active 743 DOM
-
2026-06-18days on market $287,990 Active 740 DOM
-
2026-06-17days on market $287,990 Active 739 DOM
-
2026-06-16days on market $287,990 Active 738 DOM
-
2026-06-15days on market $287,990 Active 737 DOM
-
2026-06-13days on market $287,990 Active 735 DOM
-
2026-06-13days on market $287,990 Active 734 DOM
-
2026-06-09days on market $287,990 Active 731 DOM
-
2026-06-08days on market $287,990 Active 730 DOM
-
2026-06-07days on market $287,990 Active 729 DOM
-
2026-06-04days on market $287,990 Active 726 DOM
-
2026-06-03days on market $287,990 Active 725 DOM
-
2026-06-02days on market $287,990 Active 724 DOM
-
2026-06-01days on market $287,990 Active 723 DOM
-
2026-05-31days on market $287,990 Active 722 DOM
-
2026-01-08price $287,990 358-char remark
Show marketing remark (358 chars)
This gorgeous 3-bedroom, 2-bathroom, and 1,699-1,748 square foot home offers exceptional design with plenty of space for entertaining family and friends. The expansive 16'x22' family room is the real star of the show, and with plenty of structural options to choose from, you'll easily be able to personalize this layout to fit your specific wants and needs.
-
2025-10-23price $286,990 358-char remark
Show marketing remark (358 chars)
This gorgeous 3-bedroom, 2-bathroom, and 1,699-1,748 square foot home offers exceptional design with plenty of space for entertaining family and friends. The expansive 16'x22' family room is the real star of the show, and with plenty of structural options to choose from, you'll easily be able to personalize this layout to fit your specific wants and needs.
-
2025-09-05price $285,990 358-char remark
Show marketing remark (358 chars)
This gorgeous 3-bedroom, 2-bathroom, and 1,699-1,748 square foot home offers exceptional design with plenty of space for entertaining family and friends. The expansive 16'x22' family room is the real star of the show, and with plenty of structural options to choose from, you'll easily be able to personalize this layout to fit your specific wants and needs.
-
2025-03-21price $300,990 358-char remark
Show marketing remark (358 chars)
This gorgeous 3-bedroom, 2-bathroom, and 1,699-1,748 square foot home offers exceptional design with plenty of space for entertaining family and friends. The expansive 16'x22' family room is the real star of the show, and with plenty of structural options to choose from, you'll easily be able to personalize this layout to fit your specific wants and needs.
-
2024-08-14price $319,990 358-char remark
Show marketing remark (358 chars)
This gorgeous 3-bedroom, 2-bathroom, and 1,699-1,748 square foot home offers exceptional design with plenty of space for entertaining family and friends. The expansive 16'x22' family room is the real star of the show, and with plenty of structural options to choose from, you'll easily be able to personalize this layout to fit your specific wants and needs.
-
2024-06-08$329,990 Active 358-char remark
Show marketing remark (358 chars)
This gorgeous 3-bedroom, 2-bathroom, and 1,699-1,748 square foot home offers exceptional design with plenty of space for entertaining family and friends. The expansive 16'x22' family room is the real star of the show, and with plenty of structural options to choose from, you'll easily be able to personalize this layout to fit your specific wants and needs.
ⓘ Source: listings_history table (triggers on properties + properties_extension) + one-shot
backfill from property_details.listing_events for pre-trigger history.
Nearby sold comps map
Loading sold comps map…
Walkable amenities ~0.75 mi
Loading nearby amenities…
Taxation est. · year 1
- Rental income
- $27,394
- − Mortgage interest
- −$19,564
- − Property taxes
- −$5,239
- − Insurance
- −$1,746
- − Repairs & maintenance
- −$2,192
- − Management
- −$2,192
- − Depreciation
- −$10,160
- Taxable loss
- −$13,698
- Est. tax savings @ 24.0%
- +$3,288
- After-tax cash flow
- $-4,035/yr
For passive investors: Depreciation is non-cash, so a rental often shows a tax loss while cash-flowing — sheltering income. Rental losses are passive: they offset passive income freely, and up to $25,000/yr can offset ordinary (W-2) income if you actively participate and your MAGI is under $100k (phasing out to $0 by $150k); unused losses carry forward. On sale, claimed depreciation is recaptured at up to 25%, and gains may owe capital-gains tax (a 1031 exchange can defer both). Figures are a year-1 estimate at your 24.0% rate — not tax advice; consult a CPA.
Schools (NCES district)
- District
- Community ISD
- NCES district ID
- 4814850
- Math proficiency
- 30% ▼ -23.00%
- Reading proficiency
- 38% ▼ -11.00%
- Median HH income
- $71,841
- Composite
- 31.58/100
- National rank
- #5951
- State rank
- #479 of 826 in TX
Livability — Lavon
- Score
- 66/100
- State rank
- #588
- US rank
- #11230
Category grades
Schools grade is shown separately in the Schools card above.
Census & demographics
- County
- Collin County · 1,159,394 people
- City population
- 6,989
- Metro
- Dallas-Fort Worth-Arlington, TX
- Population (ZIP)
- 6,989
- Household income
- $132,101
- Rent vs Own
- Severe rent burden
- 41.0
Population outlook (Collin County) Hauer SSP2
- Today (2025)
- 1,210,074 people
- By 2030
- 1,358,201 · +12.2%
- By 2040
- 1,654,061 · +36.7%
- By 2050
- 1,937,359 · +60.1%
- By 2075
- 2,567,039 · +112.1%
- By 2100
- 2,952,048 · +144.0%
Race, ethnicity, and origin ACS 2023
- Neighborhood character
- Diverse neighborhood (Simpson 0.63)
- Race & ethnicity
- White 55% Hispanic / Latino 24% Two or more races 15% Black 7% Asian 4% Native American 2% Pacific Islander 1%
- Hispanic origin (detail)
- Mexican 15% Puerto Rican 3%
- Common ancestry
- Slovak 2% Serbian 2% Lithuanian 2%
- Foreign-born
- 8% · Canada
- Languages at home
- 84% English-only · Spanish 11% Other Indo-European 3% Arabic 1%
Political lean MEDSL · Collin
- 2024 margin
- R (+11.1) · D 43.1% · R 54.3% · Other 2.6%
- 2008→2024 swing
- +14.4pp toward D · 2008: -25.6pp · 2024: -11.1pp
- All cycles
- 2024: R+11.1 2020: R+4.3 2016: R+17.0 2012: R+31.6 2008: R+25.6
Not yet ingested
- Civics
- —
Market trends
- HPI YoY
- ▼ -24.22%
- Current HPI
- 221.0
- Rent YoY
- —
- Metro
- Dallas-Fort Worth-Arlington, TX
- State GDP YoY
- ▲ 3.95%
- F500 in state
- 110
Industry mix (Fortune 500 HQ in TX)
| Industry | F500 HQs | Revenue |
|---|---|---|
| Energy | 16 | $1,198B |
|
||
| Technology | 5 | $198B |
|
||
| Engineering / Construction | 4 | $72B |
|
||
| Energy Services | 3 | $60B |
|
||
| Utilities | 3 | $41B |
|
||
| Healthcare | 2 | $330B |
|
||
Price history
-12.7% since first listed6 events — show timeline
- 2026-01-08 Price Changed $287,990 Zillow
- 2025-10-23 Price Changed $286,990 Zillow
- 2025-09-05 Price Changed $285,990 Zillow
- 2025-03-21 Price Changed $300,990 Zillow
- 2024-08-14 Price Changed $319,990 Zillow
- 2024-06-08 Listed $329,990 Zillow
Cash-flow waterfall
monthlySold comps — $/sqft
last 12 mo · ≤1 miLoading sold comps…