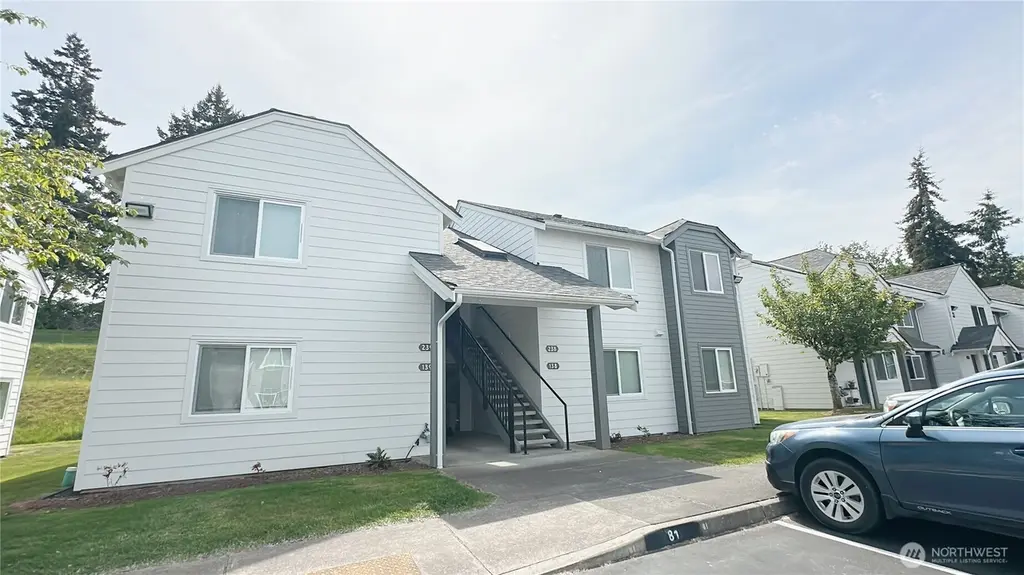
4239 Wintergreen Cir #138 · Bellingham, WA
Flood risk 1/10 · Minimal
- FEMA flood zone
- X (unshaded)
- Chance of flooding over 30 yrs
- 0.0%
- Est. flood insurance / yr
- $507 – $1,088
Fire risk 1/10 · Minimal
- Est. fire insurance / yr
- $604 – $1,122
Heat risk 2/10 · Minimal
- Hot days now (above 85°F)
- 7 days/yr
- Hot days in 30 yrs
- 17 days/yr
Wind risk 1/10 · Minimal
- Chance of severe wind over 30 yrs
- —
Air-quality risk 6/10 · Moderate
- Unhealthy air days now
- 9 days/yr
- Unhealthy air days in 30 yrs
- 9 days/yr
Risk factors via First Street. Map © Google.
Why this score? — see what drove the C grade
The composite is a weighted blend of 9 inputs, each scored 0–100. Each bar is that input's sub-score; the figure is the points it added to the 100-point composite (weight × sub-score).
- Cash flow +20.8/30.0
- 1% rule +8.1/10.0
- ARV discount +7.5/15.0
- DSCR +6.6/10.0
- Schools +4.8/10.0
- Livability +4.0/5.0
- Rent growth +2.6/5.0
- Condition / age +2.5/5.0
- Appreciation +0.0/10.0
$175,000
🖨 Deal sheet 📄 Offer letter ✓ Due diligence
Listing remarks
* Low Income Buyers * This is your chance to own a 3bdrm/2 bath lovely, accessible condo at Fir Ridge II, in the Cordata area. Due to high demand, buyers must first verify eligibility to purchase with Kulshan Community Land Trust BEFORE unit will be shown. Must be owner-occupied and has resale restrictions with a limited equity formula. Credit to replace carpet included.
Key facts
- $503 HOA
- Parking
- Built 1998
Property features AI
Finance
- Other: Bus line nearby; Buyer brokerage compensation listed as 0; Unit is one of 4 units in the building
- Financial info: Listing terms: See Remarks, State Bond
- HOA & community: Monthly HOA fee of $503; HOA covers water, sewer, trash, common-area maintenance, lawn service, road maintenance and snow removal; Association managed by Chelsea - Windermere Property Management; Community has high-speed internet available; 109 units in the community
Exterior
- Parking: Uncovered parking
- Utilities: Electric service (PSE); HOA pays water (City of Bellingham); HOA pays sewer (City of Bellingham); Electric water heater
- Home design: Attached condominium; One-level condo unit; End unit on the ground floor; Building named Fir Ridge II; Faces north; Multi-family structure (2-story building)
- Construction: Cement plank siding; Composition roof
- Exterior features: Cement-planked exterior; Cul-de-sac lot setting; Curbs and paved streets; End unit; Ground floor access; Closet storage off patio; Views (see remarks)
Interior
- Kitchen: Dishwasher; Microwave; Refrigerator; Stove/Range; Electric cooking
- Bedrooms: 3 bedrooms (all on the main level)
- Flooring: Laminate; Vinyl; Carpet
- Bathrooms: 1 full bath; 1 three-quarter bath; 2 main level bathrooms; 1 bathtub; 1 shower
- Heating & cooling: Wall furnace heating; No cooling
- Interior features: Electric cooking; Electric dryer hookup; Washer hookup; Water heater; Blinds; Dishwasher; Microwave; Refrigerator; Stove/Range
- Laundry & utility: Washer hookup; Electric dryer hookup; Washer included (hookup listed); Water heater located in bedroom closet (electric)
Neighborhood map
What this means for you Summary
Snapshot
- This is a 3-bed/1.5-bath condo listed at $175k.
Deal economics
- At list price, monthly cash flow is $242 ($3k/yr) — positive.
- The deal already cash-flows at list — no discount required.
- Meets the 1% rule at list price ($2k rent vs $175k).
- Recommended offer: $170k (3.0% below list) — sets the bar for market timing.
- Cap rate 8.0% vs local median 2.0% in Bellingham — top-decile yield for the area; either an underpriced asset or a hidden risk that comps aren't pricing in. Stress-test before assuming the spread holds.
Location & tenants
- Location reads 80/100 on livability (#102 in WA, #1,947 nationally) — a professional / high-income tenant draw. Strengths: amenities A+, commute A+, health & safety A+; Watch: crime F, cost of living F.
- Bellingham School District (urban): math 47% / reading 63% proficiency, ranked #106 of 291 in WA (top 36%) — acceptable for families but not a draw, mixed tenant base, ~2y average lease.
- Market conditions: Rents flat; 378 active listings in the ZIP; 16 comparable units currently listed for rent nearby; rentals leasing fast (median 13d on market — plan ~1-2 weeks tenant-placement turnaround); solid renter incomes; 1,190 units permitted in Whatcom County in 2024 (327 in 5+ unit buildings).
- This rent runs 35% of the median local income ($79k/yr) — at the standard rent-burdened threshold; future hikes will face affordability resistance.
Forward outlook
- Local home prices are declining (-3.0%/yr); year-one equity from $1k of loan paydown is wiped out by about $5k of value loss. Plan a longer hold.
- Whatcom County population projected at +28% by 2050 — long-run rental-demand tailwind backs the buy-and-hold thesis.
Negotiation context
- It's been on market 37 days — a 3% lower offer ($170k) is reasonable based on typical stale-listing flexibility.
- 3 sale attempts since 20y ago; this cycle's ask has dropped $40k (19%) from the opening price — seller is motivated, your offer sets the floor, not the list.
- Current owner paid $138k; 26% above their basis — modest negotiation headroom, anchor on the comps not their cost.
Risks & watch-outs
- Watch-outs: HOA is 22% of rent.
Questions for the listing agent
- It's been on market 37 days. Have you received any prior offers? Is the seller open to a 3% concession, seller financing, or rate buy-down credit?
- What does the HOA fee cover, when was the last increase, and are there any pending special assessments or reserve-fund shortfalls?
- Any open or pending special assessments — roof, HVAC, plumbing, elevator, façade? What's the per-unit balance and payoff schedule, and is the seller paying it off at close or rolling it to the buyer?
- Is there a deadline driving the sale (1031 exchange, divorce, estate, relocation)? That informs how much negotiation room exists.
- Schools are B-rated — typically a magnet for longer-tenancy family renters. What's the average tenant stay here, and is there a school-zone premium baked into asking?
- Crime grade is F in this area — have there been break-ins, vandalism, or insurance claims at this property in the last 3 years? What carrier currently insures it and at what premium?
- What's the average days-on-market for RENTAL listings here right now (not sales)? A rising rental-DOM trend means longer vacancies and softer asking-rent achievability than the comps imply.
- What's the recent tenant-quality profile in this submarket — average credit score on applications, eviction rate, late-payment / NSF rate, and stable-employment percentage? A property-management company in the area should have these aggregated.
- How much new apartment / multifamily construction is in the pipeline within 1–3 miles? Heavy new supply (>2% of stock underway) typically softens rents 12–24 months out; light construction supports rent growth.
Investment metrics
- 1% rule
- 1.31% ✓
- Cap rate
- 7.95%
- Cash-on-cash
- 5.92%
- DSCR
- 1.26
- GRM
- 6.4
CMA / ARV
No comps found within radius.
Projected returns pro-forma
-3.0% appreciation · 0.42% rent growth · sell at horizon
- IRR
- -10.7%
- Equity multiple
- 0.62×
- Total profit
- $-18,493
- Equity at exit
- $26,093
- IRR
- -6.6%
- Equity multiple
- 0.64×
- Total profit
- $-17,801
- Equity at exit
- $15,131
Cash invested: $49,000 (down + closing). Projections, not guarantees.
Landlord ↔ Tenant lean methodology
- Overall (STATE)
- 28 Tenant-Leaning
- State Washington
- 28 Tenant-Leaning · D+8
- County
- — inherits STATE
- City
- — inherits STATE
ZIP-level market 98226
- Rents YoY
- 0.4%
- Active inventory
- 378
- Price-to-rent
- 6.4×
Monthly cashflow live
- Estimated rent
- $2,287 high interval (Pro) →
- Mortgage (P&I)
- −$918
- Tax from tax record
- −$71 /mo · $857/yr
- Insurance
- −$73
- HOA
- −$503
- Vacancy / Maint / Mgmt
- −$480
- Net cashflow
- $242
Break-even live
UW: 25.0% down · 7.5% · 30yr · 1.5% tax · 5.0% vac · 8.0% maint · 8.0% mgmt
Financing live
Cash to close
- Down payment
- $43,750
- Closing costs
- $5,250
- Reserves months
- —
- Total cash needed
- —
Loan-product check · same deal, 3 products live
Conventional
25% down · 7.5% · 30yr
- Down + closing
- —
- Monthly P&I
- —
- Monthly cashflow
- —
- DSCR
- —
- Eligible?
- —
Personal DTI + credit; lowest rate.
DSCR
20% down · 8.5% · 30yr
- Down + closing
- —
- Monthly P&I
- —
- Monthly cashflow
- —
- DSCR
- —
- Eligible?
- —
No personal income docs; deal must DSCR.
Hard money
10% down · 12.0% · 12mo
- Down + closing
- —
- Monthly P&I
- —
- Monthly cashflow
- —
- DSCR
- —
- Eligible?
- —
Short-term bridge; refi at stabilization.
Rent comps 16 comps
| Address | Beds | Baths | Sqft | Rent | $/sqft | DOM | Units | Dist |
|---|---|---|---|---|---|---|---|---|
| 4355 Fuchsia Dr Bellingham, WA | 2.0 | 1.0–2.5 | 809 | $2,200 | $2.72 | 13d | 16 | 0.21mi |
| 430 W Stuart Rd Bellingham, WA | 2.0 | 1.0–2.0 | 651 | $2,214 | $3.40 | 13d | 14 | 0.38mi |
| 420 W Stuart Rd Bellingham, WA | 2.0 | 1.0–2.0 | 668 | $1,974 | $2.96 | 13d | 14 | 0.40mi |
| 4621 Celia Way #101 Bellingham, WA | 2.0 | 2.0 | 1000 | $2,100 | $2.10 | 43d | 1 | 0.66mi |
| 525 Darby Dr Bellingham, WA | 1.0–2.0 | 1.0 | 891 | $2,680 | $3.01 | 13d | 5 | 0.77mi |
| 4233 Traverse Dr Bellingham, WA | 2.0 | 2.5 | 1007 | $2,500 | $2.48 | 13d | 5 | 0.85mi |
| 4380 Tull Rd Bellingham, WA | 1.0–2.0 | 1.0–1.5 | 697 | $1,675 | $2.40 | 20d | 3 | 0.86mi |
| 1300 Mahogany Ave Bellingham, WA | 2.0 | 1.0–2.5 | 913 | $2,855 | $3.13 | 13d | 11 | 0.88mi |
| 273 Tull Ct Bellingham, WA | 2.0–3.0 | 1.5–2.0 | 1102 | $2,395 | $2.17 | 13d | 5 | 0.93mi |
| 4018 Northwest Ave Bellingham, WA | 2.0 | 1.5 | 820 | $1,600 | $1.95 | 13d | 1 | 0.99mi |
| 3928 Northwest Ave Bellingham, WA | 2.0 | 1.0–2.0 | 736 | $2,370 | $3.22 | 13d | 4 | 1.09mi |
| 545 E Kellogg Rd Bellingham, WA | 3.0 | 1.0–2.0 | 747 | $2,300 | $3.08 | 13d | 14 | 1.29mi |
| 256 Prince Ave Unit 2bd/1ba Market Unit Bellingham, WA | 2.0 | 1.0 | 657 | $1,880 | $2.86 | 13d | 1 | 1.29mi |
| 256 Prince Ave Unit 417 Bellingham, WA | 2.0 | 2.0 | 948 | $2,100 | $2.22 | 20d | 1 | 1.29mi |
| 256 Prince Ave Unit 402 Bellingham, WA | 2.0 | 2.0 | 846 | $2,200 | $2.60 | 13d | 1 | 1.29mi |
| 3206 W Maplewood Ave Unit 101 Bellingham, WA | 2.0 | 1.0 | 800 | $1,595 | $1.99 | 20d | 1 | 1.32mi |
HOA detail condo
- Monthly dues
- $503 · $6,036/yr
- Assessments
- None detected in remarks — confirm with the listing agent.
Listing history 27 events
-
2026-06-18days on market $175,000 Active 37 DOM
-
2026-06-17days on market $175,000 Active 36 DOM
-
2026-06-16days on market $175,000 Active 35 DOM
-
2026-06-15days on market $175,000 Active 34 DOM
-
2026-06-14days on market $175,000 Active 32 DOM
-
2026-06-13days on market $175,000 Active 31 DOM
-
2026-06-10days on market $175,000 Active 29 DOM
-
2026-06-09days on market $175,000 Active 28 DOM
-
2026-06-08days on market $175,000 Active 27 DOM
-
2026-06-07days on market $175,000 Active 26 DOM
-
2026-06-05days on market $175,000 Active 23 DOM
-
2026-06-03days on market $175,000 Active 22 DOM
-
2026-06-02days on market $175,000 Active 21 DOM
-
2026-06-01days on market $175,000 Active 20 DOM
-
2026-05-31days on market $175,000 Active 19 DOM
-
2026-05-30days on market $175,000 Active 18 DOM
-
2026-05-12$215,000 Active
-
2009-03-23soldstatus $138,500 Sold
-
2009-01-30historical
-
2008-12-23price $149,900
-
2008-11-14$159,900
-
2006-10-18soldstatus $180,000
-
2006-10-18soldstatus $180,000
-
2006-10-18soldstatus $180,000
-
2006-09-15$179,900
-
2000-05-26soldstatus $88,000
-
1998-01-08soldstatus $83,500
ⓘ Source: listings_history table (triggers on properties + properties_extension) + one-shot
backfill from property_details.listing_events for pre-trigger history.
Tax reassessment forecast WA · Resets to sale price
- Current annual tax
- $857 · $71/mo
- Projected year-2 tax
- $1,715 · $143/mo
- Expected delta
- +$858/yr (+$72/mo · 100.1%)
ⓘ Screening estimate from a state-policy table — verify with the county assessor before closing.
Climate risk First Street
- Flood 1/10 Low FEMA zone X (unshaded) · 0% chance over 30 yrs
- Wildfire 1/10 Low
- Heat 2/10 Low 7 d/yr ≥85°F today · 17 d/yr by 30 yrs out
- Wind 1/10 Low
- Air quality 6/10 Major 9 unhealthy d/yr today · 9 by 30 yrs out
Nearby sold comps map
Loading sold comps map…
Walkable amenities ~0.75 mi
Loading nearby amenities…
Taxation est. · year 1
- Rental income
- $27,446
- − Mortgage interest
- −$9,803
- − Property taxes
- −$857
- − Insurance
- −$875
- − Repairs & maintenance
- −$2,196
- − Management
- −$2,196
- − HOA
- −$6,036
- − Depreciation
- −$5,091
- Taxable income
- $393
- Est. tax owed @ 24.0%
- −$94
- After-tax cash flow
- $2,807/yr
For passive investors: Depreciation is non-cash, so a rental often shows a tax loss while cash-flowing — sheltering income. Rental losses are passive: they offset passive income freely, and up to $25,000/yr can offset ordinary (W-2) income if you actively participate and your MAGI is under $100k (phasing out to $0 by $150k); unused losses carry forward. On sale, claimed depreciation is recaptured at up to 25%, and gains may owe capital-gains tax (a 1031 exchange can defer both). Figures are a year-1 estimate at your 24.0% rate — not tax advice; consult a CPA.
Schools (NCES district)
- District
- Bellingham School District
- NCES district ID
- 5300420
- Math proficiency
- 47% ▼ -6.00%
- Reading proficiency
- 63% ▼ -1.00%
- Median HH income
- $47,678
- Composite
- 48.49/100
- National rank
- #4632
- State rank
- #106 of 291 in WA
Livability — Bellingham
- Score
- 80/100
- State rank
- #102
- US rank
- #1947
Category grades
Schools grade is shown separately in the Schools card above.
Census & demographics
- Census place
- Bellingham, WA
- County
- Whatcom County · 209,776 people
- City population
- 130,296
- Metro
- Bellingham, WA
- Population (ZIP)
- 46,782
- Household income
- $79,375
- Rent vs Own
- Severe rent burden
- 2061.0
Population outlook (Whatcom County) Hauer SSP2
- Today (2025)
- 240,408 people
- By 2030
- 254,667 · +5.9%
- By 2040
- 281,365 · +17.0%
- By 2050
- 307,592 · +27.9%
- By 2075
- 375,576 · +56.2%
- By 2100
- 421,637 · +75.4%
Race, ethnicity, and origin ACS 2023
- Neighborhood character
- Predominantly White (72%)
- Race & ethnicity
- White 72% Two or more races 10% Hispanic / Latino 9% Asian 6% Native American 5% Black 1%
- Hispanic origin (detail)
- Mexican 6%
- Common ancestry
- Portuguese 6% Iranian 4% Slovak 4%
- Foreign-born
- 11% · Canada, China, Vietnam
- Languages at home
- 88% English-only · Spanish 5% Chinese 2% Other Indo-European 1%
Political lean MEDSL · Whatcom
- 2024 margin
- Strong D (+24.9) · D 60.8% · R 35.9% · Other 3.3%
- 2008→2024 swing
- +6.9pp toward D · 2008: 18.0pp · 2024: 24.9pp
- All cycles
- 2024: D+24.9 2020: D+23.9 2016: D+17.7 2012: D+12.1 2008: D+18.0
Not yet ingested
- Civics
- —
Market trends
- HPI YoY
- ▼ -573.37%
- Current HPI
- 406.1085
- Rent YoY
- ▲ 0.42%
- Metro
- Bellingham, WA
- State GDP YoY
- ▲ 4.65%
- F500 in state
- 22
Industry mix (Fortune 500 HQ in WA)
| Industry | F500 HQs | Revenue |
|---|---|---|
| Retail | 2 | $269B |
|
||
| Technology / Retail | 1 | $638B |
|
||
| Technology | 1 | $245B |
|
||
| Telecommunications | 1 | $38B |
|
||
| Food / Beverage | 1 | $36B |
|
||
| Automotive / Trucks | 1 | $34B |
|
||
Price history
+157.5% since first listed11 events — show timeline
- 2026-05-12 Listed $215,000 NWMLS as Distributed by MLS Grid
- 2009-03-23 Sold (MLS) $138,500 NWMLS as Distributed by MLS Grid
- 2009-01-30 Delisted — NWMLS as Distributed by MLS Grid
- 2008-12-23 Price Changed $149,900 NWMLS as Distributed by MLS Grid
- 2008-11-14 Listed $159,900 NWMLS as Distributed by MLS Grid
- 2006-10-18 Sold (Public Records) $180,000 Public Records
- 2006-10-18 Sold (Public Records) $180,000 Public Records
- 2006-10-18 Sold (MLS) $180,000 NWMLS as Distributed by MLS Grid
- 2006-09-15 Listed $179,900 NWMLS as Distributed by MLS Grid
- 2000-05-26 Sold (Public Records) $88,000 Public Records
- 1998-01-08 Sold (Public Records) $83,500 Public Records
Property tax history
-0.2%/yrLatest (2026): $857 · +6.0% YoY. Source: county tax records.
Cash-flow waterfall
monthlySold comps — $/sqft
last 12 mo · ≤1 miLoading sold comps…