 Multi-family
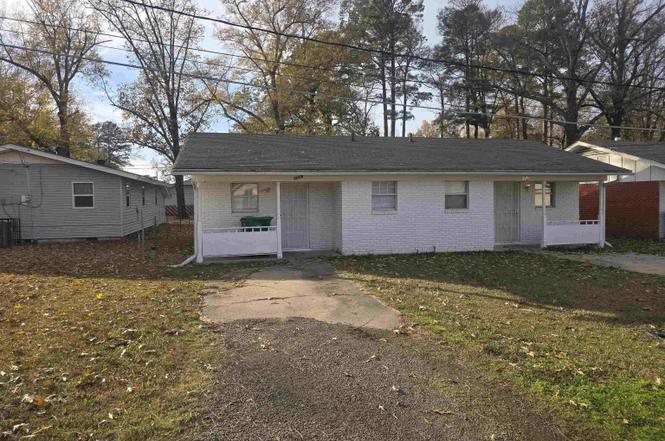
3016 S Gum St · Pine Bluff, AR
Flood risk 1/10 · Minimal
- FEMA flood zone
- X (unshaded)
- Chance of flooding over 30 yrs
- 0.0%
- Est. flood insurance / yr
- $507 – $1,088
Fire risk 1/10 · Minimal
- Est. fire insurance / yr
- $1,499 – $2,785
Heat risk 6/10 · Moderate
- Hot days now (above 110°F)
- 7 days/yr
- Hot days in 30 yrs
- 19 days/yr
Wind risk 4/10 · Minor
- Chance of severe wind over 30 yrs
- 22.0%
Air-quality risk 1/10 · Minimal
- Unhealthy air days now
- 0 days/yr
- Unhealthy air days in 30 yrs
- 0 days/yr
Risk factors via First Street. Map © Google.
Why this score? — see what drove the C grade
The composite is a weighted blend of 9 inputs, each scored 0–100. Each bar is that input's sub-score; the figure is the points it added to the 100-point composite (weight × sub-score).
- Cash flow +30.0/30.0
- 1% rule +10.0/10.0
- DSCR +10.0/10.0
- Rent growth +2.5/5.0
- Livability +2.5/5.0
- Condition / age +2.5/5.0
- Schools +0.6/10.0
- ARV discount +0.0/15.0
- Appreciation +0.0/10.0
$77,000
🖨 Deal sheet (PDF) 📄 Offer letter ✓ Due diligence
Multi-family units
County records classify this as Multi-Family (2-4 Unit). Listing-text estimate: 1 unit. estimate disagrees with records
Listing remarks
Great investment opportunity! This duplex features two units, each offering 2 bedrooms and 1 bathroom with central heat and air. Currently vacant, making it easy to lease immediately or customize for maximum rental income. Professional property management is available, perfect for investors or owner-occupants.
Key facts
- Built 1968
- Listed 116 days
Property features AI
Exterior
- Parking: Parking pads
- Utilities: Public sewer; Public water; Municipal electric (Entergy); Natural gas
- Home design: Single-family property
- Construction: 3-tab shingle roof; Slab foundation
- Exterior features: Brick and frame combination exterior; Level lot; Gravel road access
Interior
- Kitchen: Free-standing stove; Refrigerator stays
- Flooring: Vinyl; Tile
- Bathrooms: 2 full bathrooms
- Heating & cooling: Central heating (natural gas); Central electric cooling
- Interior features: Vinyl and tile flooring; Formal living room
Neighborhood map
What this means for you Summary
Snapshot
- This is a 4-bed/2.0-bath multifamily listed at $77k.
Deal economics
- At list price, monthly cash flow is $633 ($8k/yr) — positive.
- The deal already cash-flows at list — no discount required.
- Meets the 1% rule at list price ($1k rent vs $77k).
- Recommended offer: $70k (9.0% below list) — sets the bar for market timing.
- Cap rate 16.2% vs local median 8.9% in Pine Bluff — top-decile yield for the area; either an underpriced asset or a hidden risk that comps aren't pricing in. Stress-test before assuming the spread holds.
Location & tenants
- Location reads 50/100 on livability (#483 in AR) — a working-class tenant base; expect higher turnover. Strengths: cost of living A+, housing A; Watch: schools F, crime F, amenities F.
- Pine Bluff School District (urban): math 6% / reading 9% proficiency, ranked #236 of 238 in AR (top 99%) — low school quality limits family demand, transient renter base, plan for 1-2y turnover; 85% free/reduced lunch — lower-income household profile, screen leases tightly.
- Market conditions: 211 active listings in the ZIP; 2 comparable units currently listed for rent nearby; 62 units permitted in Jefferson County in 2024 (0 in 5+ unit buildings).
- This rent runs 32% of the median local income ($53k/yr) — at the standard rent-burdened threshold; future hikes will face affordability resistance.
Forward outlook
- Local home prices are declining (-3.0%/yr); year-one equity from $532 of loan paydown is wiped out by about $2k of value loss. Plan a longer hold.
- Jefferson County population projected at -33% by 2050 — secular population decline; favor cash flow + early exit over multi-decade hold.
- At projected returns (-3.0% appreciation + 3.0% rent growth), your $22k cash investment doubles in ~4 years — after that, you're playing with house money.
Negotiation context
- It's been on market 116 days — a 9% lower offer ($70k) is reasonable based on typical stale-listing flexibility.
- Current owner paid $50k; list at $77k implies a 54% gain — meaningful room to come down on a strong offer.
Risks & watch-outs
- Climate carrying-cost: extreme-heat days projected 7→19/yr by 2055 (HVAC capex compounding) — expect insurance premiums to compound above CPI over the hold.
Questions for the listing agent
- It's been on market 116 days. Have you received any prior offers? Is the seller open to a 9% concession, seller financing, or rate buy-down credit?
- Built in 1968 — when were the roof, HVAC, electrical panel, plumbing, and water heater last replaced?
- Why hasn't it sold? Are there any deal-killer items the seller is aware of (foundation, flood, title, zoning, code violations)?
- Is there a deadline driving the sale (1031 exchange, divorce, estate, relocation)? That informs how much negotiation room exists.
- Schools are F-rated, which usually means shorter tenancies and higher turnover. Who's the typical renter profile here, and what's been the actual vacancy rate?
- Crime grade is F in this area — have there been break-ins, vandalism, or insurance claims at this property in the last 3 years? What carrier currently insures it and at what premium?
- What's the average days-on-market for RENTAL listings here right now (not sales)? A rising rental-DOM trend means longer vacancies and softer asking-rent achievability than the comps imply.
- What's the recent tenant-quality profile in this submarket — average credit score on applications, eviction rate, late-payment / NSF rate, and stable-employment percentage? A property-management company in the area should have these aggregated.
- How much new apartment / multifamily construction is in the pipeline within 1–3 miles? Heavy new supply (>2% of stock underway) typically softens rents 12–24 months out; light construction supports rent growth.
Investment metrics
- 1% rule
- 1.82% ✓
- Cap rate
- 16.16%
- Cash-on-cash
- 35.24%
- DSCR
- 2.57
- GRM
- 4.6
CMA / ARV
- ARV (on-the-fly)
- $62,384
- Comps found
- 1
Show comp detail 1 sale within ~0.75 mi
| Address | Dist | Beds/Ba | Sqft | Sold | Price | $/sf | Match |
|---|---|---|---|---|---|---|---|
| 3012 And 3014 S Gum St | 0.01mi | 4/2.0 | 1,169 (+5%) | 1mo | $65,000 | $56 | 91 |
Match score weights: distance 35% · size 25% · config 20% · recency 20%. Top-matched comps best support the ARV.
Projected returns pro-forma
-3.0% appreciation · 3.0% rent growth · sell at horizon
- IRR
- 30.8%
- Equity multiple
- 2.29×
- Total profit
- $27,833
- Equity at exit
- $11,481
- IRR
- 38.0%
- Equity multiple
- 4.53×
- Total profit
- $76,098
- Equity at exit
- $6,658
Cash invested: $21,560 (down + closing). Projections, not guarantees.
Landlord ↔ Tenant lean methodology
- Overall (STATE)
- 92 Strongly Landlord-Friendly
- State Arkansas
- 92 Strongly Landlord-Friendly · R+14
- County
- — inherits STATE
- City
- — inherits STATE
ZIP-level market 71603
- Home prices YoY
- -26.0%
- Active inventory
- 211
- Price-to-rent
- 9.2×
Monthly cashflow live
- Estimated rent
- $1,398 high interval (Pro) →
- Mortgage (P&I)
- −$404
- Tax from tax record
- −$35 /mo · $424/yr
- Insurance
- −$32
- HOA
- −$0
- Vacancy / Maint / Mgmt
- −$294
- Net cashflow
- $633
Break-even live
Sensitivity live
| Price | -10% $677 | -5% $655 | +0% $633 | +5% $611 | +10% $590 |
|---|---|---|---|---|---|
| Rent | -10% $523 | -5% $578 | +0% $633 | +5% $688 | +10% $744 |
| Rate | -1.0pp $672 | -0.5pp $653 | base $633 | +0.5pp $613 | +1.0pp $593 |
2-unit breakdown (identical units grouped — click to expand)
| Units | Beds | Baths | Est. rent |
|---|---|---|---|
| 2× units | 2 | 1 | $1,398 |
| #1 | 2 | 1 | $699 |
| #2 | 2 | 1 | $699 |
| Total (2 units) | $1,398 | ||
UW: 25.0% down · 7.5% · 30yr · 1.5% tax · 5.0% vac · 8.0% maint · 8.0% mgmt
Financing live
Cash to close
- Down payment
- $19,250
- Closing costs
- $2,310
- Reserves months
- —
- Total cash needed
- —
Loan-product check · same deal, 3 products live
Conventional
25% down · 7.5% · 30yr
- Down + closing
- —
- Monthly P&I
- —
- Monthly cashflow
- —
- DSCR
- —
- Eligible?
- —
Personal DTI + credit; lowest rate.
DSCR
20% down · 8.5% · 30yr
- Down + closing
- —
- Monthly P&I
- —
- Monthly cashflow
- —
- DSCR
- —
- Eligible?
- —
No personal income docs; deal must DSCR.
Hard money
10% down · 12.0% · 12mo
- Down + closing
- —
- Monthly P&I
- —
- Monthly cashflow
- —
- DSCR
- —
- Eligible?
- —
Short-term bridge; refi at stabilization.
Rent comps 2 comps
| Address | Beds | Baths | Sqft | Rent | $/sqft | DOM | Units | Dist |
|---|---|---|---|---|---|---|---|---|
| 3109 Daffodil St Pine Bluff, AR | 3.0 | 1.0 | 980 | $825 | $0.84 | 45d | 1 | 0.52mi |
| 1907 W 28th Ave Pine Bluff, AR | 3.0 | 1.5 | 947 | $1,150 | $1.21 | 45d | 1 | 0.59mi |
Listing history 5 events
-
2026-04-14status Under Contract
-
2026-04-13price $77,000
-
2025-12-19$80,000 New Listing
-
2021-10-08soldstatus $50,000
-
2006-10-17soldstatus $46,500
ⓘ Source: listings_history table (triggers on properties + properties_extension) + one-shot
backfill from property_details.listing_events for pre-trigger history.
Tax reassessment forecast AR · Resets to sale price
- Current annual tax
- $424 · $35/mo
- Projected year-2 tax
- $493 · $41/mo
- Expected delta
- +$68/yr (+$6/mo · 16.1%)
ⓘ Screening estimate from a state-policy table — verify with the county assessor before closing.
Climate risk First Street
- Flood 1/10 Low FEMA zone X (unshaded) · 0% chance over 30 yrs
- Wildfire 1/10 Low
- Heat 6/10 Major 7 d/yr ≥110°F today · 19 d/yr by 30 yrs out
- Wind 4/10 Moderate 22% chance of damaging wind over 30 yrs
- Air quality 1/10 Low 0 unhealthy d/yr today · 0 by 30 yrs out
Nearby sold comps map
Loading sold comps map…
Walkable amenities ~0.75 mi
Loading nearby amenities…
Taxation est. · year 1
- Rental income
- $16,776
- − Mortgage interest
- −$4,313
- − Property taxes
- −$424
- − Insurance
- −$385
- − Repairs & maintenance
- −$1,342
- − Management
- −$1,342
- − Depreciation
- −$2,240
- Taxable income
- $6,729
- Est. tax owed @ 24.0%
- −$1,615
- After-tax cash flow
- $5,983/yr
For passive investors: Depreciation is non-cash, so a rental often shows a tax loss while cash-flowing — sheltering income. Rental losses are passive: they offset passive income freely, and up to $25,000/yr can offset ordinary (W-2) income if you actively participate and your MAGI is under $100k (phasing out to $0 by $150k); unused losses carry forward. On sale, claimed depreciation is recaptured at up to 25%, and gains may owe capital-gains tax (a 1031 exchange can defer both). Figures are a year-1 estimate at your 24.0% rate — not tax advice; consult a CPA.
Schools (NCES district)
- District
- Pine Bluff School District
- NCES district ID
- 0500026
- Math proficiency
- 6% ▼ -9.00%
- Reading proficiency
- 9% ▼ -7.00%
- Median HH income
- $32,374
- Composite
- 5.86/100
- National rank
- #10014
- State rank
- #236 of 238 in AR
Livability — Pine Bluff
- Score
- 50/100
- State rank
- #483
- US rank
- #25645
Category grades
Schools grade is shown separately in the Schools card above.
Census & demographics
- Census place
- Pine Bluff, AR
- County
- Jefferson County · 29,578 people
- City population
- 29,578
- Metro
- Pine Bluff, AR
- Population (ZIP)
- 29,578
- Household income
- $53,130
- Rent vs Own
- Severe rent burden
- 657.0
Population outlook (Jefferson County) Hauer SSP2
- Today (2025)
- 63,110 people
- By 2030
- 58,519 · -7.3%
- By 2040
- 49,740 · -21.2%
- By 2050
- 42,331 · -32.9%
- By 2075
- 29,591 · -53.1%
- By 2100
- 21,047 · -66.7%
Race, ethnicity, and origin ACS 2023
- Neighborhood character
- Majority Black (62%)
- Race & ethnicity
- Black 62% White 33% Two or more races 2% Hispanic / Latino 2%
- Common ancestry
- Italian 2% Slovak 1%
- Foreign-born
- 2% · Canada
- Languages at home
- 98% English-only · Spanish 1%
Political lean MEDSL · Jefferson
- 2024 margin
- Strong D (+20.1) · D 59.2% · R 39.2% · Other 1.6%
- 2008→2024 swing
- -6.2pp toward R · 2008: 26.3pp · 2024: 20.1pp
- All cycles
- 2024: D+20.1 2020: D+21.7 2016: D+25.3 2012: D+29.0 2008: D+26.3
Not yet ingested
- Civics
- —
Market trends
- HPI YoY
- ▼ -72.43%
- Current HPI
- 206.5994
- Rent YoY
- —
- Metro
- Pine Bluff, AR
- State GDP YoY
- ▲ 3.80%
- F500 in state
- 10
Industry mix (Fortune 500 HQ in AR)
| Industry | F500 HQs | Revenue |
|---|---|---|
| Retail | 1 | $681B |
|
||
| Food / Agriculture | 1 | $53B |
|
||
| Retail / Energy | 1 | $22B |
|
||
| Transportation / Logistics | 1 | $12B |
|
||
| Energy | 1 | $4B |
|
||
Price history
+65.6% since first listed5 events — show timeline
- 2026-04-14 Pending — CARMLS
- 2026-04-13 Price Changed $77,000 CARMLS
- 2025-12-19 Listed $80,000 CARMLS
- 2021-10-08 Sold (Public Records) $50,000 Public Records
- 2006-10-17 Sold (Public Records) $46,500 Public Records
Property tax history
+3.5%/yrLatest (2025): $424 · +8.5% YoY. Source: county tax records.
Cash-flow waterfall
monthlySold comps — $/sqft
last 12 mo · ≤1 miLoading sold comps…