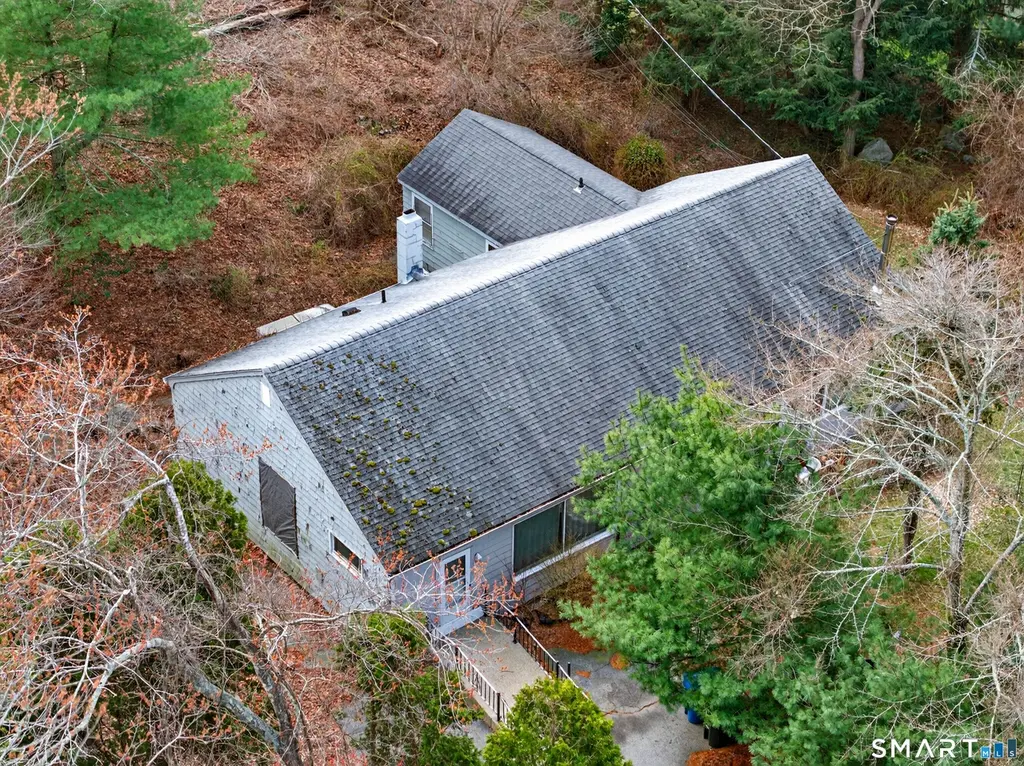
2695 Gold Star Hwy · Old Mystic, CT
Flood risk No data
- FEMA flood zone
- —
- Chance of flooding over 30 yrs
- —
- Est. flood insurance / yr
- —
Fire risk No data
- Est. fire insurance / yr
- —
Heat risk No data
- Hot days now (above threshold)
- —
- Hot days in 30 yrs
- —
Wind risk No data
- Chance of severe wind over 30 yrs
- —
Air-quality risk No data
- Unhealthy air days now
- —
- Unhealthy air days in 30 yrs
- —
Risk factors via First Street. Map © Google.
Why this score? — see what drove the B- grade
The composite is a weighted blend of 9 inputs, each scored 0–100. Each bar is that input's sub-score; the figure is the points it added to the 100-point composite (weight × sub-score).
- Cash flow +30.0/30.0
- 1% rule +10.0/10.0
- DSCR +10.0/10.0
- ARV discount +7.5/15.0
- Schools +3.6/10.0
- Livability +3.5/5.0
- Rent growth +2.5/5.0
- Condition / age +2.5/5.0
- Appreciation +0.0/10.0
$200,000
🖨 Deal sheet 📄 Offer letter ✓ Due diligence
Listing remarks
Ranch offering multi use living space with this 4-bedroom, 2 bath home on a 0.38-acre lot. It offers a versatile layout including a main living area with a kitchen, living room with fireplace, a full bath, and 3 bedrooms. It further includes a possible in law/ caregiver apartment with a separate entry that features its own kitchen with dining space, family room, full bath, and bedroom. House does need updates; government financing is not available for this property, and it is being sold "As Is, Where Is. " Situated in the RU 80 zone, this property offers potential for future improvements and personalization. The proximity to I 95, local amenities, and Downtown Mystic makes this a
Key facts
- 0.38 acre lot
- 6 parking spots
- Built 1956
Neighborhood map
What this means for you Summary
Snapshot
- This is a 4-bed/2.0-bath single-family listed at $200k.
Deal economics
- At list price, monthly cash flow is $1k ($14k/yr) — positive.
- The deal already cash-flows at list — no discount required.
- Meets the 1% rule at list price ($3k rent vs $200k).
- Cap rate 13.4% vs local median 4.5% in Old Mystic — top-decile yield for the area; either an underpriced asset or a hidden risk that comps aren't pricing in. Stress-test before assuming the spread holds.
Location & tenants
- Location reads 69/100 on livability (#106 in CT) — a middle-class / working-renter tenant base. Strengths: crime A+, employment A+, housing A+; Watch: schools C-, cost of living D+, amenities F.
- Groton School District (suburban): math 32% / reading 50% proficiency, ranked #96 of 153 in CT (top 63%) — families likely to look elsewhere, expect single-tenant / working-renter base with shorter leases.
- Market conditions: 84 active listings in the ZIP; 1 comparable units currently listed for rent nearby; high-income renter base; 487 units permitted in Southeastern Connecticut Planning Region in 2024 (244 in 5+ unit buildings).
Forward outlook
- Local home prices are declining (-3.0%/yr); year-one equity from $1k of loan paydown is wiped out by about $6k of value loss. Plan a longer hold.
- At projected returns (-3.0% appreciation + 3.0% rent growth), your $56k cash investment doubles in ~5 years — after that, you're playing with house money.
Negotiation context
- Only 7 days on market — expect competitive offers; lowballing is unlikely to land.
- 3 sale attempts since 16y ago with the ask held roughly flat each time — persistent listings suggest the price (not the market) is what's stuck; bring a comps-based counter.
Risks & watch-outs
- Watch-outs: built in 1956 — expect roof / HVAC / electrical / plumbing capex.
Questions for the listing agent
- Built in 1956 — when were the roof, HVAC, electrical panel, plumbing, and water heater last replaced?
- Is there a deadline driving the sale (1031 exchange, divorce, estate, relocation)? That informs how much negotiation room exists.
- What's the average days-on-market for RENTAL listings here right now (not sales)? A rising rental-DOM trend means longer vacancies and softer asking-rent achievability than the comps imply.
- What's the recent tenant-quality profile in this submarket — average credit score on applications, eviction rate, late-payment / NSF rate, and stable-employment percentage? A property-management company in the area should have these aggregated.
- How much new for-sale + rental construction is in the pipeline within 1–3 miles? Heavy new supply typically softens prices + rents 12–24 months out; constrained supply supports both.
Investment metrics
- 1% rule
- 1.70% ✓
- Cap rate
- 13.43%
- Cash-on-cash
- 25.51%
- DSCR
- 2.13
- GRM
- 4.9
CMA / ARV
- ARV (on-the-fly)
- $470,580
- Comps found
- 12
Show comp detail 12 sales within ~0.75 mi
| Address | Dist | Beds/Ba | Sqft | Sold | Price | $/sf | Match |
|---|---|---|---|---|---|---|---|
| 2695 Gold Star Hwy | 0.00mi | 4/2.0 | 1,860 (0%) | 1mo | $260,000 | $140 | 99 |
| 1 Marcel Rd | 0.23mi | 3/2.5 (-1) | 1,932 (+4%) | 3mo | $485,000 | $251 | 73 |
| 67 Deerfield Ridge Dr | 0.31mi | 4/2.0 | 1,995 (+7%) | 0mo | $526,000 | $264 | 73 |
| 110 Ann Ave | 0.37mi | 4/2.0 | 1,920 (+3%) | 18mo | $429,000 | $223 | 62 |
| 14 Heather Glen Ln | 0.36mi | 3/2.0 (-1) | 1,876 (+1%) | 22mo | $360,000 | $192 | 58 |
| 8 Pons Rd | 0.14mi | 3/2.0 (-1) | 1,590 (-14%) | 10mo | $402,000 | $253 | 55 |
| 17 Lamphere Rd | 0.60mi | 4/2.5 | 2,002 (+8%) | 6mo | $558,000 | $279 | 52 |
| 335 Cow Hill Rd | 0.72mi | 4/2.0 | 1,664 (-10%) | 1mo | $389,900 | $234 | 48 |
| 159 Heather Glen Ln | 0.60mi | 3/2.0 (-1) | 1,666 (-10%) | 17mo | $510,000 | $306 | 35 |
| 31 Bern Ct | 0.48mi | 3/1.5 (-1) | 1,664 (-10%) | 23mo | $200,000 | $120 | 34 |
| 42 Cindy Ln | 0.72mi | 3/2.0 (-1) | 1,638 (-12%) | 10mo | $425,000 | $259 | 33 |
| 72 Hunting Ridge Dr | 0.70mi | 3/2.5 (-1) | 1,644 (-12%) | 18mo | $500,000 | $304 | 26 |
Match score weights: distance 35% · size 25% · config 20% · recency 20%. Top-matched comps best support the ARV.
Projected returns pro-forma
-3.0% appreciation · 3.0% rent growth · sell at horizon
- IRR
- 19.1%
- Equity multiple
- 1.78×
- Total profit
- $43,528
- Equity at exit
- $29,821
- IRR
- 27.5%
- Equity multiple
- 3.43×
- Total profit
- $136,028
- Equity at exit
- $17,292
Cash invested: $56,000 (down + closing). Projections, not guarantees.
Landlord ↔ Tenant lean methodology
- Overall (STATE)
- 27 Tenant-Leaning
- State Connecticut
- 27 Tenant-Leaning · D+7
- County
- — inherits STATE
- City
- — inherits STATE
ZIP-level market 06355
- Home prices YoY
- -17.8%
- Active inventory
- 84
- Price-to-rent
- 4.9×
Monthly cashflow live
- Estimated rent
- $3,406 medium interval (Pro) →
- Mortgage (P&I)
- −$1,049
- Tax from tax record
- −$369 /mo · $4,423/yr
- Insurance
- −$83
- HOA
- −$0
- Vacancy / Maint / Mgmt
- −$715
- Net cashflow
- $1,190
Break-even live
UW: 25.0% down · 7.5% · 30yr · 1.5% tax · 5.0% vac · 8.0% maint · 8.0% mgmt
Financing live
Cash to close
- Down payment
- $50,000
- Closing costs
- $6,000
- Reserves months
- —
- Total cash needed
- —
Loan-product check · same deal, 3 products live
Conventional
25% down · 7.5% · 30yr
- Down + closing
- —
- Monthly P&I
- —
- Monthly cashflow
- —
- DSCR
- —
- Eligible?
- —
Personal DTI + credit; lowest rate.
DSCR
20% down · 8.5% · 30yr
- Down + closing
- —
- Monthly P&I
- —
- Monthly cashflow
- —
- DSCR
- —
- Eligible?
- —
No personal income docs; deal must DSCR.
Hard money
10% down · 12.0% · 12mo
- Down + closing
- —
- Monthly P&I
- —
- Monthly cashflow
- —
- DSCR
- —
- Eligible?
- —
Short-term bridge; refi at stabilization.
Rent comps 1 comps
| Address | Beds | Baths | Sqft | Rent | $/sqft | DOM | Units | Dist |
|---|---|---|---|---|---|---|---|---|
| 23 Quakertown Mdw Ledyard, CT | 4.0 | 2.5 | 2204 | $3,550 | $1.61 | 44d | 1 | 1.06mi |
Listing history 7 events
-
2026-04-20status Under Contract
-
2026-04-14$200,000 Active
-
2026-04-08historical $200,000
-
2014-03-27historical
-
2013-09-27$150,000
-
2011-02-28historical
-
2010-08-23$239,900
ⓘ Source: listings_history table (triggers on properties + properties_extension) + one-shot
backfill from property_details.listing_events for pre-trigger history.
Tax reassessment forecast CT · Partial reset (capped growth)
- Current annual tax
- $4,423 · $369/mo
- Projected year-2 tax
- $4,423 · $369/mo
- Expected delta
- $0/yr ($0/mo · 0.0%)
ⓘ Screening estimate from a state-policy table — verify with the county assessor before closing.
Nearby sold comps map
Loading sold comps map…
Walkable amenities ~0.75 mi
Loading nearby amenities…
Taxation est. · year 1
- Rental income
- $40,877
- − Mortgage interest
- −$11,203
- − Property taxes
- −$4,423
- − Insurance
- −$1,000
- − Repairs & maintenance
- −$3,270
- − Management
- −$3,270
- − Depreciation
- −$5,818
- Taxable income
- $11,892
- Est. tax owed @ 24.0%
- −$2,854
- After-tax cash flow
- $11,430/yr
For passive investors: Depreciation is non-cash, so a rental often shows a tax loss while cash-flowing — sheltering income. Rental losses are passive: they offset passive income freely, and up to $25,000/yr can offset ordinary (W-2) income if you actively participate and your MAGI is under $100k (phasing out to $0 by $150k); unused losses carry forward. On sale, claimed depreciation is recaptured at up to 25%, and gains may owe capital-gains tax (a 1031 exchange can defer both). Figures are a year-1 estimate at your 24.0% rate — not tax advice; consult a CPA.
Schools (NCES district)
- District
- Groton School District
- NCES district ID
- 0901770
- Math proficiency
- 32% ▼ -16.00%
- Reading proficiency
- 50% ▼ -10.00%
- Median HH income
- $60,709
- Composite
- 36.28/100
- National rank
- #4702
- State rank
- #96 of 153 in CT
Livability — Old Mystic
- Score
- 69/100
- State rank
- #106
- US rank
- #9037
Category grades
Schools grade is shown separately in the Schools card above.
Census & demographics
- Census place
- Old Mystic, CT
- County
- New London County · 147,197 people
- Metro
- Norwich-New London, CT
- Population (ZIP)
- 12,173
- Household income
- $137,425
- Rent vs Own
- Severe rent burden
- 197.0
Population outlook (Southeastern Connecticut County) Hauer SSP2
- By 2040
- 293,442
Race, ethnicity, and origin ACS 2023
- Neighborhood character
- Predominantly White (83%)
- Race & ethnicity
- White 83% Two or more races 9% Asian 4% Hispanic / Latino 2% Black 2%
- Common ancestry
- Lithuanian 6% Romanian 6% Slovak 5%
- Foreign-born
- 7% · Canada, China
- Languages at home
- 94% English-only · Other Indo-European 2% Spanish 1% French/Haitian/Cajun 1%
Political lean MEDSL · Southeastern Connecticut
- 2024 margin
- D (+13.0) · D 55.6% · R 42.6% · Other 1.8%
- All cycles
- 2024: D+13.0
Not yet ingested
- Civics
- —
Market trends
- HPI YoY
- ▼ -62.46%
- Current HPI
- 287.7568
- Rent YoY
- —
- Metro
- Norwich-New London, CT
- State GDP YoY
- ▲ 1.06%
- F500 in state
- 38
Industry mix (Fortune 500 HQ in CT)
| Industry | F500 HQs | Revenue |
|---|---|---|
| Industrial Machinery | 4 | $38B |
|
||
| Insurance | 3 | $71B |
|
||
| Financial Services | 2 | $25B |
|
||
| Transportation / Logistics | 2 | $18B |
|
||
| Healthcare | 1 | $247B |
|
||
| Telecommunications | 1 | $55B |
|
||
Price history
-16.6% since first listed7 events — show timeline
- 2026-04-20 Pending — Smart MLS
- 2026-04-14 Listed $200,000 Smart MLS
- 2026-04-08 Coming Soon $200,000 Smart MLS
- 2014-03-27 Listing Removed — Smart MLS
- 2013-09-27 Listed $150,000 Smart MLS
- 2011-02-28 Listing Removed — Smart MLS
- 2010-08-23 Listed $239,900 Smart MLS
Property tax history
+2.5%/yrLatest (2022): $4,423 · +6.4% YoY. Source: county tax records.
Cash-flow waterfall
monthlySold comps — $/sqft
last 12 mo · ≤1 miLoading sold comps…