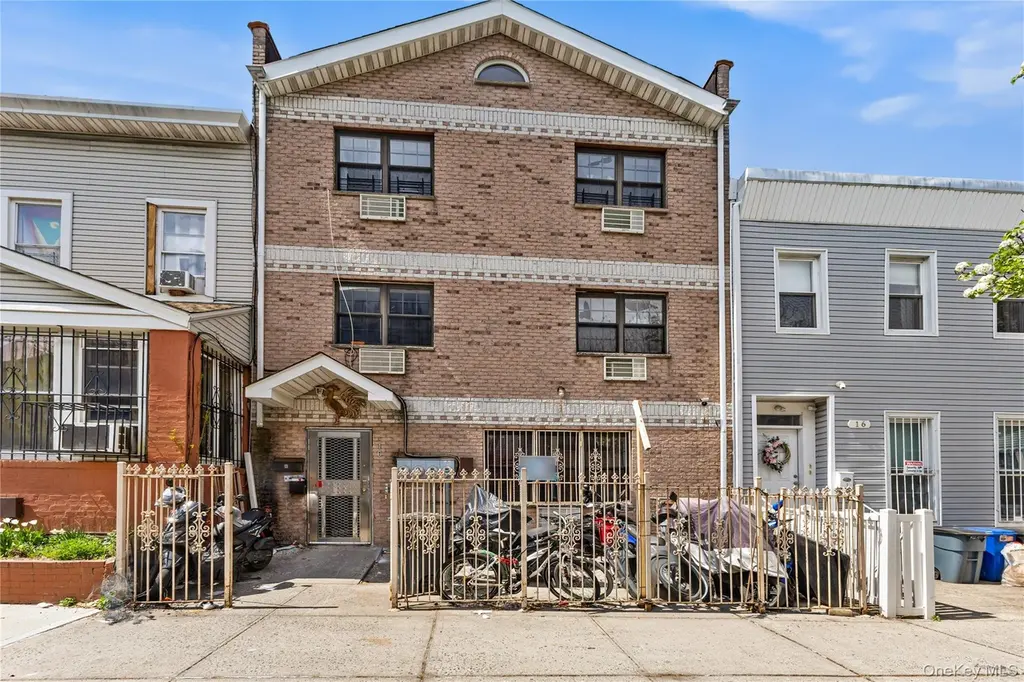
 Triplex
18 Kane Pl · New York, NY
Flood risk 1/10 · Minimal
- FEMA flood zone
- X (unshaded)
- Chance of flooding over 30 yrs
- 0.0%
- Est. flood insurance / yr
- $507 – $1,088
Fire risk 1/10 · Minimal
- Est. fire insurance / yr
- $691 – $1,283
Heat risk 7/10 · Major
- Hot days now (above 99°F)
- 7 days/yr
- Hot days in 30 yrs
- 15 days/yr
Wind risk 6/10 · Moderate
- Chance of severe wind over 30 yrs
- 39.0%
Air-quality risk 5/10 · Moderate
- Unhealthy air days now
- 6 days/yr
- Unhealthy air days in 30 yrs
- 8 days/yr
Risk factors via First Street. Map © Google.
Why this score? — see what drove the D grade
The composite is a weighted blend of 9 inputs, each scored 0–100. Each bar is that input's sub-score; the figure is the points it added to the 100-point composite (weight × sub-score).
- Appreciation +10.0/10.0
- Cash flow +7.8/30.0
- ARV discount +7.5/15.0
- Schools +5.0/10.0
- Rent growth +4.1/5.0
- Livability +3.8/5.0
- Condition / age +2.5/5.0
- DSCR +1.9/10.0
- 1% rule +1.6/10.0
$1,699,000
🖨 Deal sheet 📄 Offer letter ✓ Due diligence
Multi-family units
County records classify this as Multi-Family (2-4 Unit). Listing-text estimate: 3 units. confirmed
Listing remarks
.MASSIVE BRICK Property In Stuyvesant Height- Brooklyn. Upper Level Features XXL Four Bedroom Unit. There Are Three Bedrooms On The Second Floor While First Floor Offers Two Bedroom Apartment. Each Unit Has Two Bathrooms, Hardwood Flooring, Plenty Of Closets & Storage Space. The Full, But Unfinished, Basement Has High Ceilings And Offers So Much Potential If You Want To Cash On Laundromat And/Or Additional Storage Space. We Promise, Your Tenants Will Truly Appreciate The Huge Private Backyard That Is Big Enough To Share. So . . If You Are Looking For The Opportunity To Purchase A Well-Located Brick Multi-Family That Is Positioned For Incredible Rent Growth - You Found Your Match. Cons
Key facts
- Hardwood flooring
- Plenty of closets
- Storage space
Tags
Property features AI
Finance
- HOA & community: Access to a park
Exterior
- Parking: No dedicated parking; No carport
- Utilities: Public sewer; Water connected; Electricity connected; Natural gas connected; Cable connected; Public trash collection
- Home design: Triplex
- Construction: Brick construction; Unfinished basement
- Exterior features: Near public transit; Near schools; Near shops; Not waterfront
Interior
- Kitchen: Open kitchen
- Bedrooms: At least one 3-bedroom unit
- Flooring: Hardwood floors
- Bathrooms: 6 full bathrooms
- Heating & cooling: Natural gas heating; Hot water heating; Wall/window air conditioning units
- Interior features: High ceilings; Open kitchen; Walk-in closet(s); Aluminum-framed windows
Neighborhood map
What this means for you Summary
Snapshot
- This is a 3 × 2-bed/1-bath units multifamily listed at $1.70M.
Deal economics
- At list price, monthly cash flow is $-2k ($-22k/yr) — negative. Per door: $-621/mo.
- To cash-flow at today's rent, offer at most $1.37M (19.4% below list).
- To meet the 1% rule (rent ≥ 1% of price), the offer needs to be $1.13M (33.5% below list).
- Recommended offer: $1.13M (33.5% below list) — sets the bar for 1% rule.
- Cap rate 5.0% vs local median 2.6% in New York — top-decile yield for the area; either an underpriced asset or a hidden risk that comps aren't pricing in. Stress-test before assuming the spread holds.
Location & tenants
- Location reads 75/100 on livability (#268 in NY, #4,188 nationally) — a middle-class / working-renter tenant base. Strengths: amenities A+, commute A+, health & safety A; Watch: crime F, cost of living F.
- Market conditions: Rents rising fast (+6.4%/yr); 152 active listings in the ZIP; 10,063 units permitted in Kings County in 2024 (9,789 in 5+ unit buildings).
- At $11,292/mo this rent would consume 217% of the median local household income ($62k/yr) (locally 6960% of renters already pay >50% of income on rent) — very limited rent-growth headroom before tenants either downsize or default.
Forward outlook
- In year one you build about $182k of equity ($12k loan paydown + $170k appreciation (10.0% local appreciation)).
- Kings County population projected at +13% by 2050 — modest demand growth; plan on rents tracking national, not racing it.
- By year 2, paydown + projected appreciation supports a ~$292k cash-out refi (75% LTV) — recoverable capital for the next deal without selling this one.
Negotiation context
- It's been on market 45 days — a 3% lower offer ($1.65M) is reasonable based on typical stale-listing flexibility.
- 8 sale attempts since 11y ago with the ask held roughly flat each time — persistent listings suggest the price (not the market) is what's stuck; bring a comps-based counter.
- Current owner paid $645k; list at $1.70M implies a 163% gain — meaningful room to come down on a strong offer.
Risks & watch-outs
- Climate carrying-cost: major wind risk, 39% chance of damaging wind over 30y; extreme-heat days projected 7→15/yr by 2055 (HVAC capex compounding) — expect insurance premiums to compound above CPI over the hold.
Questions for the listing agent
- What do current leases actually rent for vs. the listed asking? Can we see a recent rent roll and the last 12 months of T-12 income?
- It's been on market 45 days. Have you received any prior offers? Is the seller open to a 34% concession, seller financing, or rate buy-down credit?
- Can we see the unit-by-unit rent roll, current vacancy, and any below-market leases? What's the average tenancy length?
- What capital expenditures (roof, boiler, parking lot, exteriors) have been made in the last 5 years, and what's planned in the next 2?
- Is there a deadline driving the sale (1031 exchange, divorce, estate, relocation)? That informs how much negotiation room exists.
- Schools are B-rated — typically a magnet for longer-tenancy family renters. What's the average tenant stay here, and is there a school-zone premium baked into asking?
- Crime grade is F in this area — have there been break-ins, vandalism, or insurance claims at this property in the last 3 years? What carrier currently insures it and at what premium?
- The area grade is low — what's the realistic commute time and amenity access for the typical tenant pool here? Any planned neighborhood developments (good or bad) we should know about?
- What's the average days-on-market for RENTAL listings here right now (not sales)? A rising rental-DOM trend means longer vacancies and softer asking-rent achievability than the comps imply.
- What's the recent tenant-quality profile in this submarket — average credit score on applications, eviction rate, late-payment / NSF rate, and stable-employment percentage? A property-management company in the area should have these aggregated.
- How much new apartment / multifamily construction is in the pipeline within 1–3 miles? Heavy new supply (>2% of stock underway) typically softens rents 12–24 months out; light construction supports rent growth.
Investment metrics
- 1% rule
- 0.66% ✗
- Cap rate
- 4.98%
- Cash-on-cash
- -4.70%
- DSCR
- 0.79
- GRM
- 12.5
CMA / ARV
No comps found within radius.
Projected returns pro-forma
10.0% appreciation · 6.44% rent growth · sell at horizon
- IRR
- 21.8%
- Equity multiple
- 2.78×
- Total profit
- $846,632
- Equity at exit
- $1,530,594
- IRR
- 20.4%
- Equity multiple
- 6.63×
- Total profit
- $2,679,934
- Equity at exit
- $3,300,783
Cash invested: $475,720 (down + closing). Projections, not guarantees.
Landlord ↔ Tenant lean methodology
- Overall (CITY)
- 0 Strongly Tenant-Friendly
- State New York
- 15 Strongly Tenant-Friendly · D+10
- County
- — inherits STATE
- City New York
- 0 Strongly Tenant-Friendly · D+34
ZIP-level market 11233
- Home prices YoY
- 2.9%
- Rents YoY
- 6.4%
- Active inventory
- 152
- Price-to-rent
- 37.6×
Monthly cashflow live
- Estimated rent
- $11,292 medium interval (Pro) →
- Mortgage (P&I)
- −$8,910
- Tax from tax record
- −$1,167 /mo · $14,001/yr
- Insurance
- −$708
- HOA
- −$0
- Vacancy / Maint / Mgmt
- −$2,371
- Net cashflow
- $-1,864
Break-even live
3-unit breakdown (identical units grouped — click to expand)
| Units | Beds | Baths | Est. rent |
|---|---|---|---|
| 3× units | 2 | 1 | $11,292 |
| #1 | 2 | 1 | $3,764 |
| #2 | 2 | 1 | $3,764 |
| #3 | 2 | 1 | $3,764 |
| Total (3 units) | $11,292 | ||
UW: 25.0% down · 7.5% · 30yr · 1.5% tax · 5.0% vac · 8.0% maint · 8.0% mgmt
Financing live
Cash to close
- Down payment
- $424,750
- Closing costs
- $50,970
- Reserves months
- —
- Total cash needed
- —
Loan-product check · same deal, 3 products live
Conventional
25% down · 7.5% · 30yr
- Down + closing
- —
- Monthly P&I
- —
- Monthly cashflow
- —
- DSCR
- —
- Eligible?
- —
Personal DTI + credit; lowest rate.
DSCR
20% down · 8.5% · 30yr
- Down + closing
- —
- Monthly P&I
- —
- Monthly cashflow
- —
- DSCR
- —
- Eligible?
- —
No personal income docs; deal must DSCR.
Hard money
10% down · 12.0% · 12mo
- Down + closing
- —
- Monthly P&I
- —
- Monthly cashflow
- —
- DSCR
- —
- Eligible?
- —
Short-term bridge; refi at stabilization.
Listing history 27 events
-
2026-06-18days on market $1,699,000 Active 45 DOM
-
2026-06-17days on market $1,699,000 Active 44 DOM
-
2026-06-16days on market $1,699,000 Active 43 DOM
-
2026-06-15days on market $1,699,000 Active 42 DOM
-
2026-06-13days on market $1,699,000 Active 40 DOM
-
2026-06-10days on market $1,699,000 Active 36 DOM
-
2026-06-08days on market $1,699,000 Active 35 DOM
-
2026-06-08days on market $1,699,000 Active 34 DOM
-
2026-06-04days on market $1,699,000 Active 31 DOM
-
2026-06-03days on market $1,699,000 Active 30 DOM
-
2026-06-01days on market $1,699,000 Active 28 DOM
-
2026-05-31days on market $1,699,000 Active 27 DOM
-
2026-05-04historical
-
2026-05-04$1,699,000 Active
-
2026-05-04historical
-
2026-05-04$1,699,000 Active
-
2025-11-18$1,699,000 Active
-
2025-09-17historical
-
2025-07-11$1,550,000 Active
-
2025-06-01historical
-
2024-09-16status Active
-
2024-06-28price $1,725,000
-
2024-05-31$1,699,999 Active
-
2017-11-18historical
-
2017-05-17$1,549,000 New
-
2016-08-15soldstatus $645,000
-
2015-04-16$550,000
ⓘ Source: listings_history table (triggers on properties + properties_extension) + one-shot
backfill from property_details.listing_events for pre-trigger history.
Tax reassessment forecast NY · Partial reset (capped growth)
- Current annual tax
- $14,001 · $1,167/mo
- Projected year-2 tax
- $21,357 · $1,780/mo
- Expected delta
- +$7,356/yr (+$613/mo · 52.5%)
ⓘ Screening estimate from a state-policy table — verify with the county assessor before closing.
Climate risk First Street
- Flood 1/10 Low FEMA zone X (unshaded) · 0% chance over 30 yrs
- Wildfire 1/10 Low
- Heat 7/10 Severe 7 d/yr ≥99°F today · 15 d/yr by 30 yrs out
- Wind 6/10 Major 39% chance of damaging wind over 30 yrs
- Air quality 5/10 Major 6 unhealthy d/yr today · 8 by 30 yrs out
Nearby sold comps map
Loading sold comps map…
Walkable amenities ~0.75 mi
Loading nearby amenities…
Taxation est. · year 1
- Rental income
- $135,504
- − Mortgage interest
- −$95,170
- − Property taxes
- −$14,001
- − Insurance
- −$8,495
- − Repairs & maintenance
- −$10,840
- − Management
- −$10,840
- − Depreciation
- −$49,425
- Taxable loss
- −$53,269
- Est. tax savings @ 24.0%
- +$12,784
- After-tax cash flow
- $-9,580/yr
For passive investors: Depreciation is non-cash, so a rental often shows a tax loss while cash-flowing — sheltering income. Rental losses are passive: they offset passive income freely, and up to $25,000/yr can offset ordinary (W-2) income if you actively participate and your MAGI is under $100k (phasing out to $0 by $150k); unused losses carry forward. On sale, claimed depreciation is recaptured at up to 25%, and gains may owe capital-gains tax (a 1031 exchange can defer both). Figures are a year-1 estimate at your 24.0% rate — not tax advice; consult a CPA.
Schools (NCES district)
No district data.
Livability — New York
- Score
- 75/100
- State rank
- #268
- US rank
- #4188
Category grades
Schools grade is shown separately in the Schools card above.
Census & demographics
- Census place
- New York, NY
- County
- Kings County · 2,614,986 people
- City population
- 7,731,280
- Metro
- New York-Newark-Jersey City, NY-NJ-PA
- Population (ZIP)
- 81,822
- Household income
- $62,411
- Rent vs Own
- Severe rent burden
- 6960.0
Population outlook (Kings County) Hauer SSP2
- Today (2025)
- 2,847,441 people
- By 2030
- 2,937,006 · +3.1%
- By 2040
- 3,095,491 · +8.7%
- By 2050
- 3,228,968 · +13.4%
- By 2075
- 3,321,723 · +16.7%
- By 2100
- 3,111,387 · +9.3%
Race, ethnicity, and origin ACS 2023
- Neighborhood character
- Predominantly Black (65%)
- Race & ethnicity
- Black 65% Hispanic / Latino 16% White 12% Two or more races 8% Asian 2%
- Hispanic origin (detail)
- Puerto Rican 5% Dominican 5%
- Common ancestry
- Hispanic 1% Romanian 1% Lithuanian 1%
- Foreign-born
- 25% · Canada, Mexico, China
- Languages at home
- 80% English-only · Spanish 12% French/Haitian/Cajun 3% Other Indo-European 1%
Political lean MEDSL · Kings
- 2024 margin
- Solid D (+44.0) · D 72.0% · R 28.0%
- 2008→2024 swing
- -15.5pp toward R · 2008: 59.4pp · 2024: 44.0pp
- All cycles
- 2024: D+44.0 2020: D+54.8 2016: D+61.8 2012: D+63.9 2008: D+59.4
Not yet ingested
- Civics
- —
Market trends
- HPI YoY
- ▲ 18.31%
- Current HPI
- 645.4828
- Rent YoY
- ▲ 6.44%
- Metro
- New York-Newark-Jersey City, NY-NJ-PA
- State GDP YoY
- ▲ 2.60%
- F500 in state
- 92
Industry mix (Fortune 500 HQ in NY)
| Industry | F500 HQs | Revenue |
|---|---|---|
| Financial Services | 10 | $950B |
|
||
| Consumer Goods | 9 | $162B |
|
||
| Insurance | 4 | $225B |
|
||
| Telecommunications | 2 | $144B |
|
||
| Pharmaceuticals | 2 | $112B |
|
||
| Media / Entertainment | 2 | $69B |
|
||
Price history
+208.9% since first listed15 events — show timeline
- 2026-05-04 Listed $1,699,000 OneKey® MLS as Distributed by MLS Grid
- 2026-05-04 Listing Removed — OneKey® MLS as Distributed by MLS Grid
- 2026-05-04 Listed $1,699,000 OneKey® MLS as Distributed by MLS Grid
- 2026-05-04 Listing Removed — OneKey® MLS as Distributed by MLS Grid
- 2025-11-18 Listed $1,699,000 OneKey® MLS as Distributed by MLS Grid
- 2025-09-17 Listing Removed — OneKey® MLS as Distributed by MLS Grid
- 2025-07-11 Listed $1,550,000 OneKey® MLS as Distributed by MLS Grid
- 2025-06-01 Listing Removed — OneKey® MLS as Distributed by MLS Grid
- 2024-09-16 Relisted — OneKey® MLS as Distributed by MLS Grid
- 2024-06-28 Price Changed $1,725,000 OneKey® MLS as Distributed by MLS Grid
- 2024-05-31 Listed $1,699,999 OneKey® MLS as Distributed by MLS Grid
- 2017-11-18 Listing Removed — OneKey® MLS as Distributed by MLS Grid
- 2017-05-17 Listed $1,549,000 OneKey® MLS as Distributed by MLS Grid
- 2016-08-15 Sold (Public Records) $645,000 Public Records
- 2015-04-16 Listed $550,000 RLS at REBNY
Property tax history
+4.1%/yrLatest (2025): $14,001 · +3.4% YoY. Source: county tax records.
Cash-flow waterfall
monthlySold comps — $/sqft
last 12 mo · ≤1 miLoading sold comps…