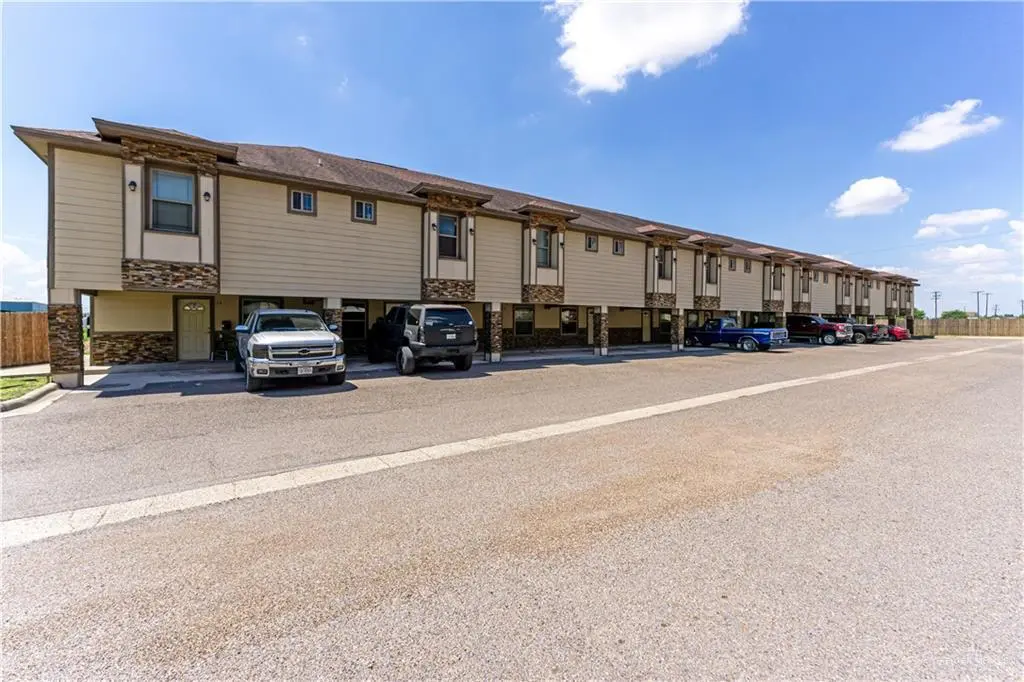
1500 Hummingbird Ct #1 · Pharr, TX
Flood risk 1/10 · Minimal
- FEMA flood zone
- X (shaded)
- Chance of flooding over 30 yrs
- 0.0%
- Est. flood insurance / yr
- $507 – $1,088
Fire risk 1/10 · Minimal
- Est. fire insurance / yr
- $1,222 – $2,270
Heat risk 9/10 · Severe
- Hot days now (above 111°F)
- 7 days/yr
- Hot days in 30 yrs
- 22 days/yr
Wind risk 8/10 · Major
- Chance of severe wind over 30 yrs
- 99.0%
Air-quality risk 3/10 · Minor
- Unhealthy air days now
- 1 days/yr
- Unhealthy air days in 30 yrs
- 4 days/yr
Risk factors via First Street. Map © Google.
Why this score? — see what drove the D- grade
The composite is a weighted blend of 9 inputs, each scored 0–100. Each bar is that input's sub-score; the figure is the points it added to the 100-point composite (weight × sub-score).
- Cash flow +11.9/30.0
- ARV discount +9.3/15.0
- Livability +3.6/5.0
- DSCR +3.5/10.0
- 1% rule +3.4/10.0
- Rent growth +2.4/5.0
- Condition / age +2.2/5.0
- Schools +2.0/10.0
- Appreciation +0.0/10.0
$145,000
🖨 Deal sheet 📄 Offer letter ✓ Due diligence
Listing remarks MLS
Lovely two story town-home in Pharr! OWNER FINANCE AVAILABLE! 10% down ,10% interest, 10 year balloon. Option for Remodel! Come check out these condos today! Well designed layout that maximizes every square foot; This 2 bedroom 2.5 bath town-home, open concept and spacious bedrooms! Great location near Hwy 281 and Expressway 83. Don't miss out on this opportunity.
Key facts
- Garage
- Built 2013
- Listed 296 days
Neighborhood map
What this means for you Summary
Snapshot
- This is a 2-bed/2.5-bath townhouse listed at $145k. Condition is rated fair.
Deal economics
- At list price, monthly cash flow is $-36 ($-432/yr) — negative.
- To cash-flow at today's rent, offer at most $140k (3.6% below list).
- To meet the 1% rule (rent ≥ 1% of price), the offer needs to be $122k (15.7% below list).
- Recommended offer: $122k (15.7% below list) — sets the bar for 1% rule.
- Cap rate 6.0% vs local median 3.4% in Pharr — top-decile yield for the area; either an underpriced asset or a hidden risk that comps aren't pricing in. Stress-test before assuming the spread holds.
Location & tenants
- Location reads 72/100 on livability (#245 in TX) — a middle-class / working-renter tenant base. Strengths: cost of living A+, housing A+, health & safety A+; Watch: schools D, amenities F, commute F.
- Pharr-San Juan-Alamo ISD (suburban): math 18% / reading 30% proficiency, ranked #740 of 826 in TX (top 90%) — low school quality limits family demand, transient renter base, plan for 1-2y turnover; 72% free/reduced lunch — lower-income household profile, screen leases tightly.
- Market conditions: Rents soft (-0.2%/yr); 451 active listings in the ZIP; 40 comparable units currently listed for rent nearby; rentals lingering (median 44d on market — plan ~5-8 weeks vacancy on turnover, expect pricing pressure); 65% of comp listings sitting > 30 days — soft ceiling on asking rent; 7,378 units permitted in Hidalgo County in 2024 (641 in 5+ unit buildings).
Forward outlook
- Local home prices are declining (-3.0%/yr); year-one equity from $1k of loan paydown is wiped out by about $4k of value loss. Plan a longer hold.
- Hidalgo County population projected at +28% by 2050 — long-run rental-demand tailwind backs the buy-and-hold thesis.
Negotiation context
- It's been on market 296 days — a 12% lower offer ($128k) is reasonable based on typical stale-listing flexibility.
Risks & watch-outs
- Climate carrying-cost: severe wind risk, 99% chance of damaging wind over 30y; extreme-heat days projected 7→22/yr by 2055 (HVAC capex compounding) — expect insurance premiums to compound above CPI over the hold.
Questions for the listing agent
- What do current leases actually rent for vs. the listed asking? Can we see a recent rent roll and the last 12 months of T-12 income?
- It's been on market 296 days. Have you received any prior offers? Is the seller open to a 16% concession, seller financing, or rate buy-down credit?
- Have any recent inspections been done? Can we get a copy of the seller's disclosures and any deferred-maintenance estimates?
- Why hasn't it sold? Are there any deal-killer items the seller is aware of (foundation, flood, title, zoning, code violations)?
- Is there a deadline driving the sale (1031 exchange, divorce, estate, relocation)? That informs how much negotiation room exists.
- Schools are D-rated, which usually means shorter tenancies and higher turnover. Who's the typical renter profile here, and what's been the actual vacancy rate?
- The area grade is low — what's the realistic commute time and amenity access for the typical tenant pool here? Any planned neighborhood developments (good or bad) we should know about?
- What's the average days-on-market for RENTAL listings here right now (not sales)? A rising rental-DOM trend means longer vacancies and softer asking-rent achievability than the comps imply.
- What's the recent tenant-quality profile in this submarket — average credit score on applications, eviction rate, late-payment / NSF rate, and stable-employment percentage? A property-management company in the area should have these aggregated.
- How much new for-sale + rental construction is in the pipeline within 1–3 miles? Heavy new supply typically softens prices + rents 12–24 months out; constrained supply supports both.
Investment metrics
- 1% rule
- 0.84% ✗
- Cap rate
- 5.99%
- Cash-on-cash
- -1.06%
- DSCR
- 0.95
- GRM
- 9.9
CMA / ARV
- ARV (median comp)
- $151,004
- List price
- $145,000
- Delta
- -3.98%
- Verdict
- FAIR
- Comps
- 20 within 1.0 mi
Show comp detail 12 sales within ~0.75 mi
| Address | Dist | Beds/Ba | Sqft | Sold | Price | $/sf | Match |
|---|---|---|---|---|---|---|---|
| 1321 E Camellia Ave #3 | 0.40mi | 2/2.5 | 1,169 (-8%) | 5mo | $154,900 | $133 | 63 |
| 1305 E Daffodil Ave Unit A | 0.48mi | 2/2.5 | 1,360 (+6%) | 5mo | $195,000 | $143 | 63 |
| 1304 E Camellia Ave #2 | 0.47mi | 2/2.5 | 1,200 (-6%) | 11mo | $159,000 | $133 | 59 |
| 1208 E Camellia Ave #2 | 0.55mi | 2/2.5 | 1,181 (-8%) | 5mo | $165,000 | $140 | 57 |
| 1213 E Daffodil Ave Unit A | 0.55mi | 2/2.5 | 1,360 (+6%) | 8mo | $175,000 | $129 | 57 |
| 1300 E Daffodil Ave Unit A | 0.49mi | 2/2.5 | 1,182 (-8%) | 15mo | $169,000 | $143 | 52 |
| 1205 E Camellia Ave #4 | 0.56mi | 2/2.5 | 1,170 (-8%) | 10mo | $179,950 | $154 | 52 |
| 1300 E Daffodil Ave Unit C | 0.49mi | 2/2.5 | 1,182 (-8%) | 17mo | $165,000 | $140 | 51 |
| 1205 E Camellia Ave #3 | 0.56mi | 2/2.5 | 1,172 (-8%) | 22mo | $179,950 | $154 | 42 |
| 1205 E Camelia St | 0.57mi | 2/3.0 | 1,172 (-8%) | 20mo | $175,950 | $150 | 41 |
| 1309 E Daffodil Ave Unit B | 0.46mi | 3/2.5 (+1) | 1,440 (+13%) | 19mo | $175,000 | $122 | 36 |
| 1210 E Daffodil Ave #2 | 0.51mi | 3/2.5 (+1) | 1,407 (+10%) | 23mo | $197,500 | $140 | 35 |
Match score weights: distance 35% · size 25% · config 20% · recency 20%. Top-matched comps best support the ARV.
Projected returns pro-forma
-3.0% appreciation · 0.0% rent growth · sell at horizon
- IRR
- -21.5%
- Equity multiple
- 0.28×
- Total profit
- $-29,356
- Equity at exit
- $21,620
- IRR
- -24.4%
- Equity multiple
- -0.04×
- Total profit
- $-42,292
- Equity at exit
- $12,537
Cash invested: $40,600 (down + closing). Projections, not guarantees.
Landlord ↔ Tenant lean methodology
- Overall (STATE)
- 87 Strongly Landlord-Friendly
- State Texas
- 87 Strongly Landlord-Friendly · R+5
- County
- — inherits STATE
- City
- — inherits STATE
ZIP-level market 78577
- Home prices YoY
- -8.1%
- Rents YoY
- -0.2%
- Active inventory
- 451
- Price-to-rent
- 9.9×
Monthly cashflow live
- Estimated rent
- $1,223 high interval (Pro) →
- Mortgage (P&I)
- −$760
- Tax est. 1.5%
- −$181 /mo · $2,175/yr
- Insurance
- −$60
- HOA
- −$0
- Vacancy / Maint / Mgmt
- −$257
- Net cashflow
- $-36
Break-even live
UW: 25.0% down · 7.5% · 30yr · 1.5% tax · 5.0% vac · 8.0% maint · 8.0% mgmt
Financing live
Cash to close
- Down payment
- $36,250
- Closing costs
- $4,350
- Reserves months
- —
- Total cash needed
- —
Loan-product check · same deal, 3 products live
Conventional
25% down · 7.5% · 30yr
- Down + closing
- —
- Monthly P&I
- —
- Monthly cashflow
- —
- DSCR
- —
- Eligible?
- —
Personal DTI + credit; lowest rate.
DSCR
20% down · 8.5% · 30yr
- Down + closing
- —
- Monthly P&I
- —
- Monthly cashflow
- —
- DSCR
- —
- Eligible?
- —
No personal income docs; deal must DSCR.
Hard money
10% down · 12.0% · 12mo
- Down + closing
- —
- Monthly P&I
- —
- Monthly cashflow
- —
- DSCR
- —
- Eligible?
- —
Short-term bridge; refi at stabilization.
Rent comps 40 comps
| Address | Beds | Baths | Sqft | Rent | $/sqft | DOM | Units | Dist |
|---|---|---|---|---|---|---|---|---|
| 1500 W Heritage Dr #2 Pharr, TX | 3.0 | 2.0 | 1140 | $1,200 | $1.05 | 43d | 1 | 0.11mi |
| 1300 Humming Bird Ct Unit 9 Pharr, TX | 2.0 | 2.5 | 1114 | $1,250 | $1.12 | 43d | 1 | 0.13mi |
| 1300 Humming Bird Ct Unit 10 Pharr, TX | 2.0 | 2.5 | 1114 | $1,250 | $1.12 | 43d | 1 | 0.13mi |
| 1321 E Camelia AVE #4 McAllen, TX | 2.0 | 2.5 | 1283 | $1,700 | $1.33 | 43d | 1 | 0.37mi |
| 1320 E Camellia Ave Unit C McAllen, TX | 2.0 | 2.5 | 1360 | $1,300 | $0.96 | 43d | 1 | 0.38mi |
| 1320 E Camellia Ave Unit A McAllen, TX | 2.0 | 2.5 | 1185 | $1,600 | $1.35 | 43d | 1 | 0.38mi |
| 1701 W Sioux Rd Unit 12305 Pharr, TX | 2.0 | 2.0 | 990 | $1,250 | $1.26 | 43d | 1 | 0.38mi |
| 1701 W Sioux Rd Unit 4204 Pharr, TX | 3.0 | 2.0 | 1187 | $1,499 | $1.26 | 23d | 1 | 0.38mi |
| 1701 W Sioux Rd Unit 5305 Pharr, TX | 2.0 | 2.0 | 990 | $1,250 | $1.26 | 23d | 1 | 0.38mi |
| 1701 W Sioux Rd Unit 4202 Pharr, TX | 3.0 | 2.0 | 1187 | $1,499 | $1.26 | 43d | 1 | 0.38mi |
| 1321 E Daffodil Ave Unit D McAllen, TX | 2.0 | 2.5 | 1187 | $1,100 | $0.93 | 43d | 1 | 0.39mi |
| 1316 E Camellia Ave Unit 1 McAllen, TX | 2.0 | 2.5 | 1185 | $1,100 | $0.93 | 23d | 1 | 0.39mi |
| 1001 Sugar Garden Dr Unit 1 Pharr, TX | 3.0 | 2.0 | 1000 | $1,250 | $1.25 | 43d | 1 | 0.40mi |
| 1006 Sugar Garden Dr Unit 4 Pharr, TX | 3.0 | 2.0 | 1000 | $1,250 | $1.25 | 21d | 1 | 0.40mi |
| 1004 Sugar Garden Dr Unit 2 Pharr, TX | 3.0 | 2.0 | 1000 | $1,250 | $1.25 | 43d | 1 | 0.41mi |
| 1312 E Daffodil Ave Unit B McAllen, TX | 2.0 | 2.5 | 1185 | $1,100 | $0.93 | 43d | 1 | 0.41mi |
| 1105 Sugar Garden Ave Pharr, TX | 3.0 | 2.0 | 1050 | $1,250 | $1.19 | 19d | 1 | 0.41mi |
| 1309 E Camellia Ave McAllen, TX | 2.0 | 2.5 | 1200 | $1,100 | $0.92 | 43d | 1 | 0.42mi |
| 1706 W Bronze St Pharr, TX | 3.0 | 2.0 | 1200 | $875 | $0.73 | 44d | 1 | 0.42mi |
| 1308 E Daffodil Ave Unit c McAllen, TX | 2.0 | 2.5 | 1300 | $1,200 | $0.92 | 43d | 1 | 0.43mi |
| 1301 E Camellia Ave Unit D Pharr, TX | 2.0 | 2.5 | 1300 | $1,250 | $0.96 | 43d | 1 | 0.46mi |
| 4008 Parkplace Ave Unit 4 Pharr, TX | 3.0 | 2.0 | 1078 | $995 | $0.92 | 43d | 1 | 0.47mi |
| 4008 Parkplace Ave Unit 1 Pharr, TX | 3.0 | 2.0 | 1078 | $1,800 | $1.67 | 43d | 1 | 0.47mi |
| 3402 Robin Pharr, TX | 3.0 | 2.0 | 1428 | $1,800 | $1.26 | 14d | 1 | 0.48mi |
| 813 W Bronze Dr Unit 8134 Pharr, TX | 2.0 | 2.0 | 891 | $875 | $0.98 | 23d | 1 | 0.48mi |
| 1221 E Daffodil Ave Unit C McAllen, TX | 2.0 | 2.5 | 1148 | $1,000 | $0.87 | 23d | 1 | 0.48mi |
| 1424 E Hibiscus Ave Unit 1 McAllen, TX | 2.0 | 2.0 | 978 | $1,200 | $1.23 | 23d | 1 | 0.49mi |
| 906 Sugar Garden Ave Pharr, TX | 3.0 | 2.0 | 1106 | $1,195 | $1.08 | 43d | 1 | 0.50mi |
| 1902 W Violet Dr #4 Pharr, TX | 3.0 | 2.0 | 950 | $1,350 | $1.42 | 23d | 1 | 0.50mi |
| 705 W Emerald Dr Unit B Pharr, TX | 2.0 | 2.0 | 1000 | $895 | $0.90 | 43d | 1 | 0.51mi |
| 801 W Bronze Dr Pharr, TX | 2.0 | 2.0 | 910 | $825 | $0.91 | 19d | 1 | 0.51mi |
| 901 Sugar Garden Dr Unit 4 Pharr, TX | 3.0 | 2.0 | 1100 | $1,200 | $1.09 | 43d | 1 | 0.52mi |
| 1907 W Violet Dr Unit 2 Pharr, TX | 2.0 | 2.0 | 940 | $1,350 | $1.44 | 43d | 1 | 0.52mi |
| 1907 W Violet Dr Unit 3 Pharr, TX | 2.0 | 2.0 | 1140 | $1,350 | $1.18 | 23d | 1 | 0.52mi |
| 902 Sugar Garden Dr Unit 4 Pharr, TX | 3.0 | 2.0 | 1106 | $1,195 | $1.08 | 43d | 1 | 0.53mi |
| 1408 E Hibiscus Ave Unit 2 McAllen, TX | 3.0 | 2.0 | 1100 | $1,350 | $1.23 | 14d | 1 | 0.53mi |
| 1204 E Daffodil McAllen, TX | 2.0 | 2.5 | 1170 | $1,200 | $1.03 | 43d | 1 | 0.53mi |
| 801 Sugar Garden Dr Unit 3 Pharr, TX | 3.0 | 2.0 | 1040 | $1,250 | $1.20 | 14d | 1 | 0.54mi |
| 900 Sugar Garden Ave Pharr, TX | 3.0 | 2.0 | 1106 | $1,195 | $1.08 | 43d | 1 | 0.54mi |
| 1205 E Daffodil Ave Unit B McAllen, TX | 2.0 | 2.5 | 1250 | $1,050 | $0.84 | 43d | 1 | 0.54mi |
Listing history 16 events
-
2026-06-18days on market $145,000 Active 296 DOM
-
2026-06-17days on market $145,000 Active 295 DOM
-
2026-06-16days on market $145,000 Active 294 DOM
-
2026-06-15days on market $145,000 Active 293 DOM
-
2026-06-14days on market $145,000 Active 291 DOM
-
2026-06-13days on market $145,000 Active 290 DOM
-
2026-06-10days on market $145,000 Active 288 DOM
-
2026-06-09days on market $145,000 Active 287 DOM
-
2026-06-08days on market $145,000 Active 286 DOM
-
2026-06-07days on market $145,000 Active 285 DOM
-
2026-06-03days on market $145,000 Active 281 DOM
-
2026-06-02days on market $145,000 Active 280 DOM
-
2026-06-01days on market $145,000 Active 279 DOM
-
2026-05-31days on market $145,000 Active 278 DOM
-
2026-05-31days on market $145,000 Active 277 DOM
-
2025-08-26$145,000 Active 370-char remark
Show marketing remark (370 chars)
Lovely two story town-home in Pharr! OWNER FINANCE AVAILABLE! 10% down ,10% interest, 10 year balloon. Option for Remodel! Come check out these condos today! Well designed layout that maximizes every square foot; This 2 bedroom 2.5 bath town-home, open concept and spacious bedrooms! Great location near Hwy 281 and Expressway 83. Don't miss out on this opportunity.
ⓘ Source: listings_history table (triggers on properties + properties_extension) + one-shot
backfill from property_details.listing_events for pre-trigger history.
Climate risk First Street
- Flood 1/10 Low FEMA zone X (shaded) · 0% chance over 30 yrs
- Wildfire 1/10 Low
- Heat 9/10 Extreme 7 d/yr ≥111°F today · 22 d/yr by 30 yrs out
- Wind 8/10 Severe 99% chance of damaging wind over 30 yrs
- Air quality 3/10 Moderate 1 unhealthy d/yr today · 4 by 30 yrs out
Nearby sold comps map
Loading sold comps map…
Walkable amenities ~0.75 mi
Loading nearby amenities…
Taxation est. · year 1
- Rental income
- $14,674
- − Mortgage interest
- −$8,122
- − Property taxes
- −$2,175
- − Insurance
- −$725
- − Repairs & maintenance
- −$1,174
- − Management
- −$1,174
- − Depreciation
- −$4,218
- Taxable loss
- −$2,914
- Est. tax savings @ 24.0%
- +$699
- After-tax cash flow
- $267/yr
For passive investors: Depreciation is non-cash, so a rental often shows a tax loss while cash-flowing — sheltering income. Rental losses are passive: they offset passive income freely, and up to $25,000/yr can offset ordinary (W-2) income if you actively participate and your MAGI is under $100k (phasing out to $0 by $150k); unused losses carry forward. On sale, claimed depreciation is recaptured at up to 25%, and gains may owe capital-gains tax (a 1031 exchange can defer both). Figures are a year-1 estimate at your 24.0% rate — not tax advice; consult a CPA.
Condition & rehab AI · 13 photos
This two-story townhome is in fair condition with cosmetic updates needed. The roof and exterior siding require attention, but the interior is in good shape with fresh paint and granite countertops.
Repairs flagged
- Major roof — visible roof structure
- Minor exterior siding — slight wear
Value-add opportunities
- Both paint exterior siding — enhances curb appeal and value
- Both repair roof — fixes major issue and prevents further damage
Renovation cost estimate screening
| Repair item | Severity | Est. cost |
|---|---|---|
| roof · visible roof structure | Major | $15,000–50,000 |
| exterior siding · slight wear | Minor | $500–3,000 |
| Total estimated repair cost · 2 items | $15,500–53,000 |
Value-add ROI direction
- Both paint exterior siding — enhances curb appeal and value ↑
- Both repair roof — fixes major issue and prevents further damage ↑
ⓘ Cost ranges are severity-bucket heuristics (US national rule-of-thumb). Get contractor quotes + a written scope before underwriting a rehab budget.
Schools (NCES district)
- District
- Pharr-San Juan-Alamo ISD
- NCES district ID
- 4834860
- Math proficiency
- 18% ▼ -34.00%
- Reading proficiency
- 30% ▼ -11.00%
- Median HH income
- $33,757
- Composite
- 19.63/100
- National rank
- #8744
- State rank
- #740 of 826 in TX
Livability — Pharr
- Score
- 72/100
- State rank
- #245
- US rank
- #5852
Category grades
Schools grade is shown separately in the Schools card above.
Census & demographics
- Census place
- Pharr, TX
- County
- Hidalgo County · 623,128 people
- City population
- 80,540
- Metro
- McAllen-Edinburg-Mission, TX
- Population (ZIP)
- 80,540
- Household income
- $52,770
- Rent vs Own
- Severe rent burden
- 2161.0
Population outlook (Hidalgo County) Hauer SSP2
- Today (2025)
- 955,232 people
- By 2030
- 1,009,774 · +5.7%
- By 2040
- 1,120,332 · +17.3%
- By 2050
- 1,225,036 · +28.2%
- By 2075
- 1,439,189 · +50.7%
- By 2100
- 1,533,429 · +60.5%
Race, ethnicity, and origin ACS 2023
- Neighborhood character
- Predominantly Hispanic (95%)
- Race & ethnicity
- Hispanic / Latino 95% Two or more races 45% White 5%
- Hispanic origin (detail)
- Mexican 92%
- Foreign-born
- 29% · Canada
- Languages at home
- 18% English-only · Spanish 81%
Political lean MEDSL · Hidalgo
- 2024 margin
- Toss-up / Even · D 48.1% · R 51.0%
- 2008→2024 swing
- -41.6pp toward R · 2008: 38.7pp · 2024: -2.9pp
- All cycles
- 2024: R+2.9 2020: D+17.1 2016: D+40.5 2012: D+41.8 2008: D+38.7
Not yet ingested
- Civics
- —
Market trends
- HPI YoY
- ▼ -23.00%
- Current HPI
- 261.1606
- Rent YoY
- ▼ -0.24%
- Metro
- McAllen-Edinburg-Mission, TX
- State GDP YoY
- ▲ 3.95%
- F500 in state
- 110
Industry mix (Fortune 500 HQ in TX)
| Industry | F500 HQs | Revenue |
|---|---|---|
| Energy | 16 | $1,198B |
|
||
| Technology | 5 | $198B |
|
||
| Engineering / Construction | 4 | $72B |
|
||
| Energy Services | 3 | $60B |
|
||
| Utilities | 3 | $41B |
|
||
| Healthcare | 2 | $330B |
|
||
Price history
1 event — show timeline
- 2025-08-26 Listed $145,000 MCALLENMLS
Cash-flow waterfall
monthlySold comps — $/sqft
last 12 mo · ≤1 miLoading sold comps…