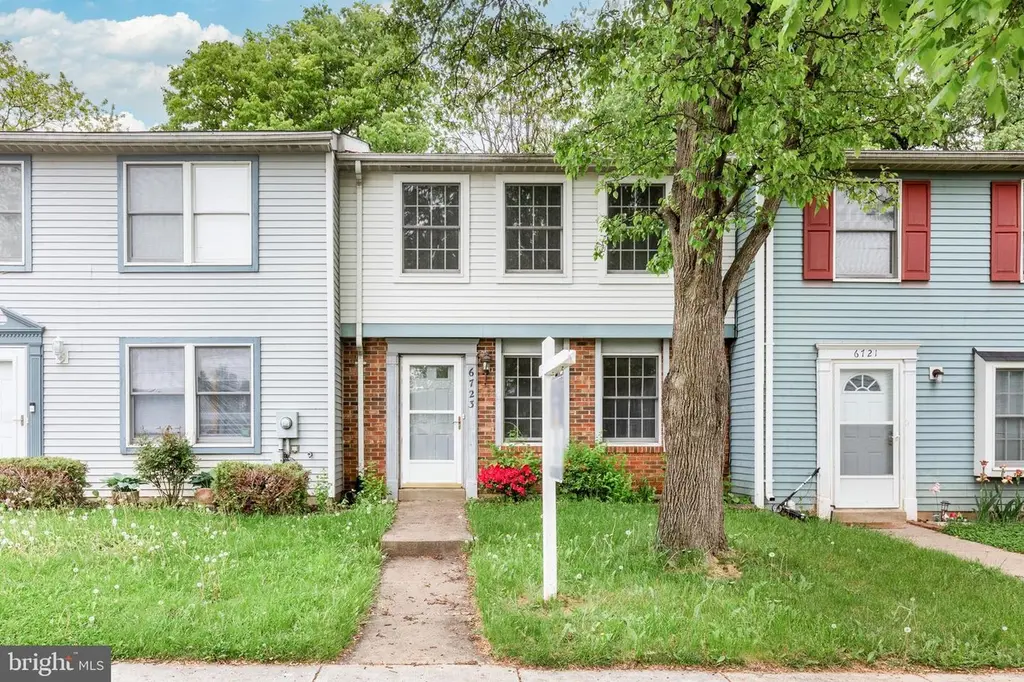
6723 Kernel Ct · Ballenger Creek, MD
Flood risk 1/10 · Minimal
- FEMA flood zone
- X (unshaded)
- Chance of flooding over 30 yrs
- 0.0%
- Est. flood insurance / yr
- $507 – $1,088
Fire risk 1/10 · Minimal
- Est. fire insurance / yr
- $755 – $1,403
Heat risk 6/10 · Moderate
- Hot days now (above 105°F)
- 7 days/yr
- Hot days in 30 yrs
- 16 days/yr
Wind risk 3/10 · Minor
- Chance of severe wind over 30 yrs
- 6.0%
Air-quality risk 2/10 · Minimal
- Unhealthy air days now
- 1 days/yr
- Unhealthy air days in 30 yrs
- 2 days/yr
Risk factors via First Street. Map © Google.
Why this score? — see what drove the D+ grade
The composite is a weighted blend of 9 inputs, each scored 0–100. Each bar is that input's sub-score; the figure is the points it added to the 100-point composite (weight × sub-score).
- ARV discount +15.0/15.0
- Cash flow +14.0/30.0
- DSCR +4.2/10.0
- 1% rule +4.0/10.0
- Livability +3.8/5.0
- Schools +3.4/10.0
- Rent growth +3.0/5.0
- Condition / age +2.5/5.0
- Appreciation +0.0/10.0
$265,000
🖨 Deal sheet (PDF) 📄 Offer letter ✓ Due diligence
Listing remarks
Multiple Offer Deadline: May 4 at 12noon 3-bedroom home located in the highly desirable Ballenger Creek area. Priced to reflect needed improvements —an excellent opportunity to build instant equity with your personal touches. Comparable updated homes in the neighborhood are selling in the $350K range, making this a smart investment for buyers looking to customize and add value. Why rent when you can buy and start building equity of your own? Roof is approx 5 years old; Plumbing inspected 2 years ago; Regular maintenance on the HVAC.
Key facts
- $103 HOA
- Built 1988
- Listed 4 days
Property features AI
Finance
- HOA & community: HOA fee of $103 per month
Exterior
- Parking: Parking lot
- Utilities: Public water; Public sewer; Electric hot water
- Home design: Interior townhouse/rowhouse; Fee simple ownership; Below average property condition
- Construction: Brick and vinyl siding exterior; Slab foundation; Above-grade and below-grade structures
- Exterior features: Deck(s); Secure storage; Privacy rear fencing
Interior
- Kitchen: Dishwasher; Stove; Refrigerator
- Bedrooms: Three bedrooms on the upper level
- Bathrooms: One full bathroom; One half bathroom
- Heating & cooling: Heat pump with electric backup; Electric heating fuel; Central air conditioning
- Interior features: Combination kitchen and dining area; Traditional floor plan; Pantry; Walk-in closet(s); Living Room; Master Bedroom; Bedroom 2; Bedroom 3; Full Bath; Half Bath
- Laundry & utility: Washer and Dryer; Main floor laundry
Neighborhood map
What this means for you Summary
Snapshot
- This is a 3-bed/1.5-bath townhouse listed at $265k.
Deal economics
- At list price, monthly cash flow is $32 ($390/yr) — positive.
- The deal already cash-flows at list — no discount required.
- To meet the 1% rule (rent ≥ 1% of price), the offer needs to be $238k (10.2% below list).
- Recommended offer: $238k (10.2% below list) — sets the bar for 1% rule.
- Cap rate 6.4% vs local median 3.9% in Ballenger Creek — top-decile yield for the area; either an underpriced asset or a hidden risk that comps aren't pricing in. Stress-test before assuming the spread holds.
Location & tenants
- Location reads 76/100 on livability (#95 in MD, #3,677 nationally) — a middle-class / working-renter tenant base. Strengths: employment A+, housing A+, health & safety A+; Watch: cost of living D, crime D-, commute F.
- Frederick County Public Schools (other): math 27% / reading 43% proficiency, ranked #4 of 24 in MD (top 17%) — families likely to look elsewhere, expect single-tenant / working-renter base with shorter leases.
- Market conditions: Rents rising (+2.0%/yr); 175 active listings in the ZIP; 28 comparable units currently listed for rent nearby; rentals at typical pace (median 20d on market — plan ~3-4 weeks tenant-placement turnaround); solid renter incomes; 1,562 units permitted in Frederick County in 2024 (374 in 5+ unit buildings).
Forward outlook
- Local home prices are declining (-3.0%/yr); year-one equity from $2k of loan paydown is wiped out by about $8k of value loss. Plan a longer hold.
- Frederick County population projected at +15% by 2050 — long-run rental-demand tailwind backs the buy-and-hold thesis.
Negotiation context
- Only 4 days on market — expect competitive offers; lowballing is unlikely to land.
- 3 sale attempts since 26y ago with the ask held roughly flat each time — persistent listings suggest the price (not the market) is what's stuck; bring a comps-based counter.
Risks & watch-outs
- Climate carrying-cost: extreme-heat days projected 7→16/yr by 2055 (HVAC capex compounding) — expect insurance premiums to compound above CPI over the hold.
Questions for the listing agent
- What does the HOA fee cover, when was the last increase, and are there any pending special assessments or reserve-fund shortfalls?
- Is there a deadline driving the sale (1031 exchange, divorce, estate, relocation)? That informs how much negotiation room exists.
- Schools are B-rated — typically a magnet for longer-tenancy family renters. What's the average tenant stay here, and is there a school-zone premium baked into asking?
- Crime grade is D in this area — have there been break-ins, vandalism, or insurance claims at this property in the last 3 years? What carrier currently insures it and at what premium?
- The area grade is low — what's the realistic commute time and amenity access for the typical tenant pool here? Any planned neighborhood developments (good or bad) we should know about?
- What's the average days-on-market for RENTAL listings here right now (not sales)? A rising rental-DOM trend means longer vacancies and softer asking-rent achievability than the comps imply.
- What's the recent tenant-quality profile in this submarket — average credit score on applications, eviction rate, late-payment / NSF rate, and stable-employment percentage? A property-management company in the area should have these aggregated.
- How much new for-sale + rental construction is in the pipeline within 1–3 miles? Heavy new supply typically softens prices + rents 12–24 months out; constrained supply supports both.
Investment metrics
- 1% rule
- 0.90% ✗
- Cap rate
- 6.44%
- Cash-on-cash
- 0.53%
- DSCR
- 1.02
- GRM
- 9.3
CMA / ARV
- ARV (median comp)
- $321,514
- List price
- $265,000
- Delta
- -17.58%
- Verdict
- UNDERPRICED
- Comps
- 20 within 1.0 mi
Show comp detail 12 sales within ~0.75 mi
| Address | Dist | Beds/Ba | Sqft | Sold | Price | $/sf | Match |
|---|---|---|---|---|---|---|---|
| 6723 Kernel Ct | 0.00mi | 3/1.5 | 1,280 (0%) | 1mo | $297,000 | $232 | 100 |
| 6734 Fallow Hill Ct | 0.20mi | 3/1.5 | 1,280 (0%) | 2mo | $342,000 | $267 | 89 |
| 6844 Carnation Cir | 0.11mi | 3/2.5 | 1,300 (+2%) | 1mo | $350,000 | $269 | 88 |
| 6934 Doublebrand Ct | 0.22mi | 3/2.5 | 1,280 (0%) | 1mo | $343,000 | $268 | 85 |
| 6852 Carnation Cir | 0.13mi | 3/2.5 | 1,320 (+3%) | 1mo | $325,000 | $246 | 84 |
| 6612 Spokeshave Ct | 0.27mi | 3/2.5 | 1,220 (-5%) | 1mo | $370,000 | $303 | 75 |
| 5693 Crabapple Dr | 0.19mi | 2/2.0 (-1) | 1,148 (-10%) | 1mo | $364,900 | $318 | 66 |
| 593 Cawley Dr Unit 3A | 0.33mi | 2/2.0 (-1) | 1,390 (+9%) | 1mo | $295,000 | $212 | 62 |
| 5757 Sunset View Ln | 0.51mi | 3/1.5 | 1,160 (-9%) | 1mo | $320,000 | $276 | 60 |
| 6985 Arbor Dr | 0.33mi | 2/2.0 (-1) | 1,444 (+13%) | 1mo | $365,000 | $253 | 56 |
| 5751 Sunset View Ln | 0.51mi | 3/1.5 | 1,120 (-12%) | 0mo | $289,000 | $258 | 56 |
| 6510-C Daytona Ct #205 | 0.70mi | 2/2.5 (-1) | 1,407 (+10%) | 1mo | $325,000 | $231 | 41 |
Match score weights: distance 35% · size 25% · config 20% · recency 20%. Top-matched comps best support the ARV.
Projected returns pro-forma
-3.0% appreciation · 1.97% rent growth · sell at horizon
- IRR
- -16.6%
- Equity multiple
- 0.42×
- Total profit
- $-43,269
- Equity at exit
- $39,512
- IRR
- -10.4%
- Equity multiple
- 0.40×
- Total profit
- $-44,642
- Equity at exit
- $22,912
Cash invested: $74,200 (down + closing). Projections, not guarantees.
Landlord ↔ Tenant lean methodology
- Overall (STATE)
- 27 Tenant-Leaning
- State Maryland
- 27 Tenant-Leaning · D+14
- County
- — inherits STATE
- City
- — inherits STATE
ZIP-level market 21703
- Rents YoY
- 2.0%
- Active inventory
- 175
- Price-to-rent
- 9.3×
Monthly cashflow live
- Estimated rent
- $2,381 high interval (Pro) →
- Mortgage (P&I)
- −$1,390
- Tax from tax record
- −$245 /mo · $2,941/yr
- Insurance
- −$110
- HOA
- −$103
- Vacancy / Maint / Mgmt
- −$500
- Net cashflow
- $32
Break-even live
Sensitivity live
| Price | -10% $182 | -5% $107 | +0% $32 | +5% $-43 | +10% $-118 |
|---|---|---|---|---|---|
| Rent | -10% $-156 | -5% $-62 | +0% $32 | +5% $127 | +10% $221 |
| Rate | -1.0pp $166 | -0.5pp $100 | base $32 | +0.5pp $-36 | +1.0pp $-106 |
UW: 25.0% down · 7.5% · 30yr · 1.5% tax · 5.0% vac · 8.0% maint · 8.0% mgmt
Financing live
Cash to close
- Down payment
- $66,250
- Closing costs
- $7,950
- Reserves months
- —
- Total cash needed
- —
Loan-product check · same deal, 3 products live
Conventional
25% down · 7.5% · 30yr
- Down + closing
- —
- Monthly P&I
- —
- Monthly cashflow
- —
- DSCR
- —
- Eligible?
- —
Personal DTI + credit; lowest rate.
DSCR
20% down · 8.5% · 30yr
- Down + closing
- —
- Monthly P&I
- —
- Monthly cashflow
- —
- DSCR
- —
- Eligible?
- —
No personal income docs; deal must DSCR.
Hard money
10% down · 12.0% · 12mo
- Down + closing
- —
- Monthly P&I
- —
- Monthly cashflow
- —
- DSCR
- —
- Eligible?
- —
Short-term bridge; refi at stabilization.
Rent comps 28 comps
| Address | Beds | Baths | Sqft | Rent | $/sqft | DOM | Units | Dist |
|---|---|---|---|---|---|---|---|---|
| 5806 Shadbush Ct Unit G Frederick, MD | 3.0 | 2.0 | 1368 | $2,195 | $1.60 | 23d | 1 | 0.18mi |
| 6930 Doublebrand Ct Unit 1 Frederick, MD | 3.0 | 2.0 | 1280 | $2,200 | $1.72 | 20d | 1 | 0.25mi |
| 5765 Sweet Bay Ct Frederick, MD | 3.0 | 2.5 | 1496 | $2,400 | $1.60 | 20d | 1 | 0.25mi |
| 5708 Trailview Ct Frederick, MD | 1.0–2.0 | 1.0–2.0 | 1121 | $2,192 | $1.95 | 45d | 1 | 0.28mi |
| 5730 Box Elder Ct Frederick, MD | 2.0 | 2.0 | 1225 | $2,300 | $1.88 | 45d | 1 | 0.33mi |
| 5614 New Design Rd Frederick, MD | 1.0–3.0 | 1.0–2.0 | 1022 | $1,969 | $1.93 | 45d | 1 | 0.35mi |
| 607 Windview Way Frederick, MD | 1.0–3.0 | 1.0–2.0 | 949 | $2,355 | $2.48 | 11d | 11 | 0.36mi |
| 5805 Farmgate Ct Unit 1 Frederick, MD | 3.0 | 1.5 | 1164 | $2,400 | $2.06 | 45d | 1 | 0.56mi |
| 5614 Denton Ct Frederick, MD | 3.0 | 2.5 | 1720 | $2,400 | $1.40 | 6d | 1 | 0.67mi |
| 6509 Wiltshire Dr Unit L Frederick, MD | 2.0 | 2.5 | 1650 | $2,099 | $1.27 | 6d | 1 | 0.78mi |
| 7104 Collinsworth Pl Frederick, MD | 3.0 | 3.5 | 1856 | $2,500 | $1.35 | 45d | 1 | 0.80mi |
| 6393 Kelly Ct Frederick, MD | 3.0 | 1.5 | 1620 | $2,300 | $1.42 | 6d | 1 | 0.80mi |
| 360 Prospect Blvd Frederick, MD | 1.0–2.0 | 1.0–2.0 | 797 | $1,758 | $2.21 | 45d | 1 | 0.86mi |
| 349 Prospect Blvd Frederick, MD | 1.0–3.0 | 1.0–2.0 | 951 | $2,879 | $3.03 | 0d | 17 | 0.93mi |
| 5208 Duke Ct Frederick, MD | 3.0 | 2.0 | 1614 | $2,300 | $1.43 | 6d | 1 | 0.95mi |
| 5171 Duke Ct Frederick, MD | 3.0 | 2.5 | 1614 | $2,300 | $1.43 | 0d | 1 | 1.00mi |
| 541 Primus Ct Unit 541 Frederick, MD | 4.0 | 3.5 | 1316 | $2,500 | $1.90 | 20d | 1 | 1.03mi |
| 5330 Witch Hazel Ln Frederick, MD | 3.0 | 3.5 | 1600 | $2,800 | $1.75 | 45d | 1 | 1.07mi |
| 909 Mansion Dr Frederick, MD | 1.0–2.0 | 1.0–2.0 | 1008 | $2,374 | $2.36 | 0d | 18 | 1.10mi |
| 6404 Wild Plum Dr Frederick, MD | 4.0 | 2.5 | 1600 | $2,999 | $1.87 | 45d | 1 | 1.12mi |
| 5835 White Lake Ln Frederick, MD | 1.0–3.0 | 1.0–2.0 | 1062 | $3,013 | $2.84 | 0d | 19 | 1.20mi |
| 408 Sherman Ave Unit 1 Frederick, MD | 3.0 | 1.0 | 1400 | $1,650 | $1.18 | 20d | 1 | 1.36mi |
| 5013 Canvasback Ct Frederick, MD | 3.0 | 2.5 | 1326 | $2,300 | $1.73 | 45d | 1 | 1.40mi |
| 4989 Pintail Ct Frederick, MD | 3.0 | 2.5 | 1820 | $2,200 | $1.21 | 6d | 1 | 1.42mi |
| 607 Himes Ave #104 Frederick, MD | 2.0 | 2.0 | 950 | $2,000 | $2.11 | 0d | 1 | 1.45mi |
| 480 W South St Unit 2 Frederick, MD | 2.0 | 1.0 | 1848 | $1,850 | $1.00 | 25d | 1 | 1.49mi |
| 542 Hollyberry Way Unit 1 Frederick, MD | 3.0 | 2.5 | 1600 | $2,400 | $1.50 | 25d | 1 | 1.49mi |
| 524 W South St Frederick, MD | 1.0–3.0 | 1.0–2.0 | 1022 | $2,100 | $2.05 | 45d | 1 | 1.50mi |
HOA detail
- Monthly dues
- $103 · $1,236/yr
Listing history 10 events
-
2026-05-05status Pending 544-char remark
-
2026-05-01$265,000 Active 544-char remark
-
2026-04-28historical $265,000 544-char remark
-
2008-04-11historical
-
2008-03-18
-
2000-08-04soldstatus $90,500
-
2000-07-31soldstatus $90,500
-
2000-07-01historical
-
2000-06-28$93,500
-
1988-07-07soldstatus $72,050
ⓘ Source: listings_history table (triggers on properties + properties_extension) + one-shot
backfill from property_details.listing_events for pre-trigger history.
Tax reassessment forecast MD · Partial reset (capped growth)
- Current annual tax
- $2,941 · $245/mo
- Projected year-2 tax
- $2,941 · $245/mo
- Expected delta
- $0/yr ($0/mo · 0.0%)
ⓘ Screening estimate from a state-policy table — verify with the county assessor before closing.
Climate risk First Street
- Flood 1/10 Low FEMA zone X (unshaded) · 0% chance over 30 yrs
- Wildfire 1/10 Low
- Heat 6/10 Major 7 d/yr ≥105°F today · 16 d/yr by 30 yrs out
- Wind 3/10 Moderate 6% chance of damaging wind over 30 yrs
- Air quality 2/10 Low 1 unhealthy d/yr today · 2 by 30 yrs out
Nearby sold comps map
Loading sold comps map…
Walkable amenities ~0.75 mi
Loading nearby amenities…
Taxation est. · year 1
- Rental income
- $28,567
- − Mortgage interest
- −$14,844
- − Property taxes
- −$2,941
- − Insurance
- −$1,325
- − Repairs & maintenance
- −$2,285
- − Management
- −$2,285
- − HOA
- −$1,236
- − Depreciation
- −$7,709
- Taxable loss
- −$4,059
- Est. tax savings @ 24.0%
- +$974
- After-tax cash flow
- $1,364/yr
For passive investors: Depreciation is non-cash, so a rental often shows a tax loss while cash-flowing — sheltering income. Rental losses are passive: they offset passive income freely, and up to $25,000/yr can offset ordinary (W-2) income if you actively participate and your MAGI is under $100k (phasing out to $0 by $150k); unused losses carry forward. On sale, claimed depreciation is recaptured at up to 25%, and gains may owe capital-gains tax (a 1031 exchange can defer both). Figures are a year-1 estimate at your 24.0% rate — not tax advice; consult a CPA.
Schools (NCES district)
- District
- Frederick County Public Schools
- NCES district ID
- 2400330
- Math proficiency
- 27% ▼ -23.00%
- Reading proficiency
- 43% ▼ -15.00%
- Median HH income
- $84,020
- Composite
- 33.54/100
- National rank
- #5429
- State rank
- #4 of 24 in MD
Livability — Ballenger Creek
- Score
- 76/100
- State rank
- #95
- US rank
- #3677
Category grades
Schools grade is shown separately in the Schools card above.
Census & demographics
- Census place
- Ballenger Creek, MD
- County
- Frederick County · 171,753 people
- Metro
- Washington-Arlington-Alexandria, DC-VA-MD-WV
- Population (ZIP)
- 41,960
- Household income
- $106,334
- Rent vs Own
- Severe rent burden
- 1475.0
Population outlook (Frederick County) Hauer SSP2
- Today (2025)
- 269,438 people
- By 2030
- 280,160 · +4.0%
- By 2040
- 298,408 · +10.8%
- By 2050
- 311,062 · +15.4%
- By 2075
- 342,819 · +27.2%
- By 2100
- 351,361 · +30.4%
Race, ethnicity, and origin ACS 2023
- Neighborhood character
- Highly diverse neighborhood (Simpson 0.70)
- Race & ethnicity
- White 47% Hispanic / Latino 21% Black 17% Two or more races 14% Asian 8%
- Hispanic origin (detail)
- Mexican 2% Puerto Rican 2% Dominican 2%
- Common ancestry
- Romanian 2% Italian 2% Lithuanian 2%
- Foreign-born
- 22% · Canada, South Korea, Jamaica
- Languages at home
- 72% English-only · Spanish 16% Other Indo-European 3% Other Asian/Pacific 2%
Political lean MEDSL · Frederick
- 2024 margin
- Lean D (+8.8) · D 53.2% · R 44.4% · Other 2.5%
- 2008→2024 swing
- +9.9pp toward D · 2008: -1.0pp · 2024: 8.8pp
- All cycles
- 2024: D+8.8 2020: D+9.6 2016: R+4.0 2012: R+3.9 2008: R+1.0
Not yet ingested
- Civics
- —
Market trends
- HPI YoY
- ▼ -194.57%
- Current HPI
- 278.7723
- Rent YoY
- ▲ 1.97%
- Metro
- Washington-Arlington-Alexandria, DC-VA-MD-WV
- State GDP YoY
- ▲ 2.97%
- F500 in state
- 12
Industry mix (Fortune 500 HQ in MD)
| Industry | F500 HQs | Revenue |
|---|---|---|
| Aerospace / Defense | 1 | $71B |
|
||
| Utilities | 1 | $25B |
|
||
| Hotels | 1 | $24B |
|
||
| Consumer Goods | 1 | $7B |
|
||
| Real Estate | 1 | $6B |
|
||
| Chemicals | 1 | $2B |
|
||
Price history
+312.2% since first listed11 events — show timeline
- 2026-06-05 Sold (MLS) $297,000 BRIGHT MLS
- 2026-05-05 Pending — BRIGHT MLS
- 2026-05-01 Listed $265,000 BRIGHT MLS
- 2026-04-28 Coming Soon $265,000 BRIGHT MLS
- 2008-04-11 Delisted — MRIS
- 2008-03-18 Listed — MRIS
- 2000-08-04 Sold (Public Records) $90,500 Public Records
- 2000-07-31 Sold (MLS) $90,500 MRIS
- 2000-07-01 Delisted — MRIS
- 2000-06-28 Listed $93,500 MRIS
- 1988-07-07 Sold (Public Records) $72,050 Public Records
Property tax history
+2.9%/yrLatest (2025): $2,941 · +7.2% YoY. Source: county tax records.
Cash-flow waterfall
monthlySold comps — $/sqft
last 12 mo · ≤1 miLoading sold comps…