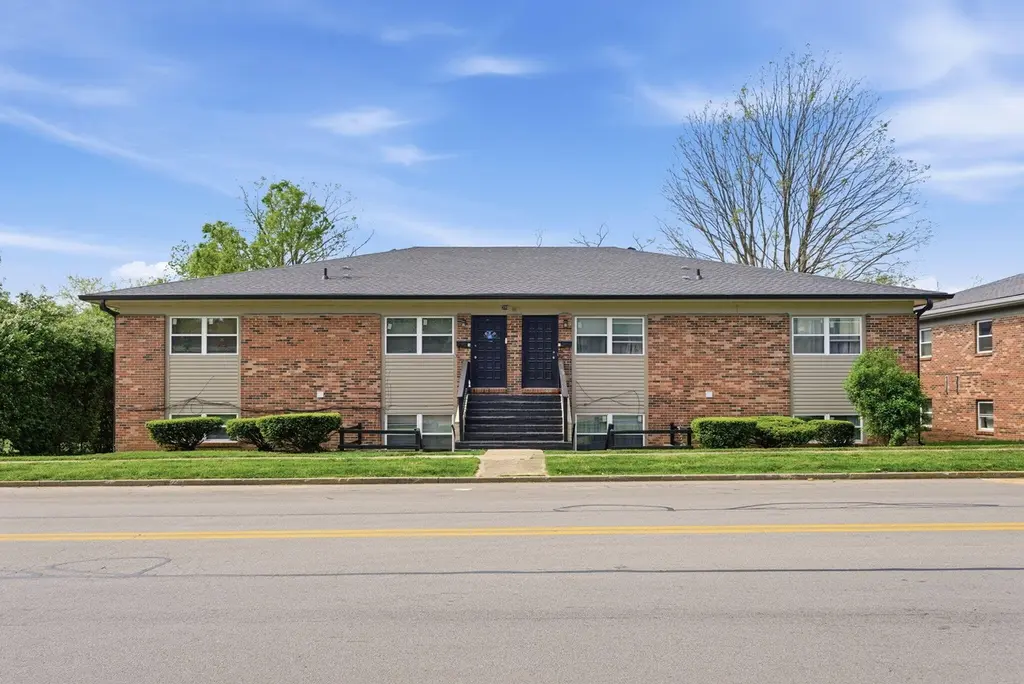
 8-Plex
388 Redding Rd · Lexington-Fayette, KY
Flood risk 1/10 · Minimal
- FEMA flood zone
- X (unshaded)
- Chance of flooding over 30 yrs
- 0.0%
- Est. flood insurance / yr
- $507 – $1,088
Fire risk 1/10 · Minimal
- Est. fire insurance / yr
- $839 – $1,559
Heat risk 4/10 · Minor
- Hot days now (above 101°F)
- 7 days/yr
- Hot days in 30 yrs
- 19 days/yr
Wind risk 2/10 · Minimal
- Chance of severe wind over 30 yrs
- 2.0%
Air-quality risk 1/10 · Minimal
- Unhealthy air days now
- 0 days/yr
- Unhealthy air days in 30 yrs
- 0 days/yr
Risk factors via First Street. Map © Google.
Why this score? — see what drove the C grade
The composite is a weighted blend of 9 inputs, each scored 0–100. Each bar is that input's sub-score; the figure is the points it added to the 100-point composite (weight × sub-score).
- Cash flow +24.8/30.0
- DSCR +8.0/10.0
- ARV discount +7.5/15.0
- 1% rule +5.2/10.0
- Rent growth +3.6/5.0
- Schools +3.4/10.0
- Livability +2.5/5.0
- Condition / age +2.5/5.0
- Appreciation +0.0/10.0
$999,900
🖨 Deal sheet (PDF) 📄 Offer letter ✓ Due diligence
Multi-family units
County records classify this as Multi-Family (5+ Unit). Listing-text estimate: 8 units. confirmed
5+ unit building — per-unit beds/baths from public records are typically unavailable; the breakdown below (if shown) is an estimate from the listing text.
Listing remarks
Attention Investors! 8-Unit Apartment Building. Turn-Key Investment Opportunity With Immediate Value-Add Potential! All the heavy lifting has already been done on this fully occupied asset, making it an easy addition to your portfolio. Recent major capital improvements include a newer roof, gutters, windows, siding, and breaker panels. Several units have also been recently updated/renovated, creating a strong blend of current stability and upside through future interior updates. The property is currently 100% occupied, with all tenants (8) on month-to-month leases, offering maximum flexibility for rent increases, additional renovations, or portfolio repositioning. 5 of 8 tenants are long
Key facts
- Newer breaker panels
- Newer roof
- Newer siding
Tags
Property features AI
Finance
- Other: Zoning: R-3 (Planned Neighborhood Residential); Lot size about 11,700 sq ft (0.2686 acres); Parcel number 13744638
Exterior
- Home design: Multi-family property; 2 stories
- Construction: Building area approximately 7,300 total square feet
- Exterior features: Located next to Kirklevington Park; Subdivision: Kirklevington
Interior
- Bathrooms: 8 full bathrooms
- Heating & cooling: Electric heating; Central air
- Interior features: Central air conditioning
Neighborhood map
What this means for you Summary
Snapshot
- This is a 8 × 2-bed/1.0-bath units multifamily listed at $1000k.
Deal economics
- At list price, monthly cash flow is $2k ($25k/yr) — positive. Per door: $264/mo.
- The deal already cash-flows at list — no discount required.
- Meets the 1% rule at list price ($10k rent vs $1000k).
- Recommended offer: $940k (6.0% below list) — sets the bar for market timing.
- Cap rate 8.8% vs local median 3.8% in Lexington-Fayette — top-decile yield for the area; either an underpriced asset or a hidden risk that comps aren't pricing in. Stress-test before assuming the spread holds.
Location & tenants
- Location reads: area grade C — affects rentability + tenant quality, not the cash-flow math above.
- Fayette County (urban): math 35% / reading 45% proficiency, ranked #27 of 165 in KY (top 16%) — families likely to look elsewhere, expect single-tenant / working-renter base with shorter leases.
- Zoned schools: Tates Creek High School (math 29% / reading 32%, grade F, #121 of 254 statewide, top 47%, 1,734 students, 52% FRL).
- Market conditions: Rents rising fast (+4.5%/yr); 103 active listings in the ZIP; 1,036 units permitted in Fayette County in 2024 (542 in 5+ unit buildings).
- At $10,223/mo this rent would consume 229% of the median local household income ($54k/yr) (locally 2743% of renters already pay >50% of income on rent) — very limited rent-growth headroom before tenants either downsize or default.
Forward outlook
- Local home prices are declining (-3.0%/yr); year-one equity from $7k of loan paydown is wiped out by about $30k of value loss. Plan a longer hold.
- Fayette County population projected at +35% by 2050 — long-run rental-demand tailwind backs the buy-and-hold thesis.
- At projected returns (-3.0% appreciation + 4.5% rent growth), your $280k cash investment doubles in ~10 years — after that, you're playing with house money.
Negotiation context
- It's been on market 64 days — a 6% lower offer ($940k) is reasonable based on typical stale-listing flexibility.
- Current owner paid $660k; list at $1000k implies a 52% gain — meaningful room to come down on a strong offer.
Questions for the listing agent
- It's been on market 64 days. Have you received any prior offers? Is the seller open to a 6% concession, seller financing, or rate buy-down credit?
- Can we see the unit-by-unit rent roll, current vacancy, and any below-market leases? What's the average tenancy length?
- What capital expenditures (roof, boiler, parking lot, exteriors) have been made in the last 5 years, and what's planned in the next 2?
- Built in 1978 — when were the roof, HVAC, electrical panel, plumbing, and water heater last replaced?
- Why hasn't it sold? Are there any deal-killer items the seller is aware of (foundation, flood, title, zoning, code violations)?
- Is there a deadline driving the sale (1031 exchange, divorce, estate, relocation)? That informs how much negotiation room exists.
- What's the average days-on-market for RENTAL listings here right now (not sales)? A rising rental-DOM trend means longer vacancies and softer asking-rent achievability than the comps imply.
- What's the recent tenant-quality profile in this submarket — average credit score on applications, eviction rate, late-payment / NSF rate, and stable-employment percentage? A property-management company in the area should have these aggregated.
- How much new apartment / multifamily construction is in the pipeline within 1–3 miles? Heavy new supply (>2% of stock underway) typically softens rents 12–24 months out; light construction supports rent growth.
Investment metrics
- 1% rule
- 1.02% ✓
- Cap rate
- 8.82%
- Cash-on-cash
- 9.04%
- DSCR
- 1.40
- GRM
- 8.2
CMA / ARV
No comps found within radius.
Projected returns pro-forma
-3.0% appreciation · 4.52% rent growth · sell at horizon
- IRR
- -1.1%
- Equity multiple
- 0.96×
- Total profit
- $-12,318
- Equity at exit
- $149,088
- IRR
- 9.9%
- Equity multiple
- 1.81×
- Total profit
- $227,611
- Equity at exit
- $86,453
Cash invested: $279,972 (down + closing). Projections, not guarantees.
Landlord ↔ Tenant lean methodology
- Overall (STATE)
- 83 Strongly Landlord-Friendly
- State Kentucky
- 83 Strongly Landlord-Friendly · R+16
- County
- — inherits STATE
- City
- — inherits STATE
ZIP-level market 40517
- Rents YoY
- 4.5%
- Active inventory
- 103
- Price-to-rent
- 65.2×
Monthly cashflow live
- Estimated rent
- $10,223 high interval (Pro) →
- Mortgage (P&I)
- −$5,244
- Tax from tax record
- −$308 /mo · $3,695/yr
- Insurance
- −$417
- HOA
- −$0
- Vacancy / Maint / Mgmt
- −$2,147
- Net cashflow
- $2,108
Break-even live
Sensitivity live
| Price | -10% $2,674 | -5% $2,391 | +0% $2,108 | +5% $1,825 | +10% $1,542 |
|---|---|---|---|---|---|
| Rent | -10% $1,300 | -5% $1,704 | +0% $2,108 | +5% $2,512 | +10% $2,916 |
| Rate | -1.0pp $2,612 | -0.5pp $2,362 | base $2,108 | +0.5pp $1,849 | +1.0pp $1,585 |
8-unit breakdown (identical units grouped — click to expand)
| Units | Beds | Baths | Est. rent |
|---|---|---|---|
| 8× units | 2 | 1 | $10,224 |
| #1 | 2 | 1 | $1,278 |
| #2 | 2 | 1 | $1,278 |
| #3 | 2 | 1 | $1,278 |
| #4 | 2 | 1 | $1,278 |
| #5 | 2 | 1 | $1,278 |
| #6 | 2 | 1 | $1,278 |
| #7 | 2 | 1 | $1,278 |
| #8 | 2 | 1 | $1,278 |
| Total (8 units) | $10,223 | ||
UW: 25.0% down · 7.5% · 30yr · 1.5% tax · 5.0% vac · 8.0% maint · 8.0% mgmt
Financing live
Cash to close
- Down payment
- $249,975
- Closing costs
- $29,997
- Reserves months
- —
- Total cash needed
- —
Loan-product check · same deal, 3 products live
Conventional
25% down · 7.5% · 30yr
- Down + closing
- —
- Monthly P&I
- —
- Monthly cashflow
- —
- DSCR
- —
- Eligible?
- —
Personal DTI + credit; lowest rate.
DSCR
20% down · 8.5% · 30yr
- Down + closing
- —
- Monthly P&I
- —
- Monthly cashflow
- —
- DSCR
- —
- Eligible?
- —
No personal income docs; deal must DSCR.
Hard money
10% down · 12.0% · 12mo
- Down + closing
- —
- Monthly P&I
- —
- Monthly cashflow
- —
- DSCR
- —
- Eligible?
- —
Short-term bridge; refi at stabilization.
Listing history 19 events
-
2026-06-18days on market $999,900 Active 64 DOM
-
2026-06-17days on market $999,900 Active 63 DOM
-
2026-06-16days on market $999,900 Active 62 DOM
-
2026-06-15days on market $999,900 Active 61 DOM
-
2026-06-14days on market $999,900 Active 59 DOM
-
2026-06-13days on market $999,900 Active 58 DOM
-
2026-06-10days on market $999,900 Active 56 DOM
-
2026-06-09days on market $999,900 Active 55 DOM
-
2026-06-08days on market $999,900 Active 54 DOM
-
2026-06-07pricedays on market $999,900 Active 53 DOM
-
2026-06-05days on market $1,049,900 Active 50 DOM
-
2026-06-03days on market $1,049,900 Active 49 DOM
-
2026-06-02days on market $1,049,900 Active 48 DOM
-
2026-06-01days on market $1,049,900 Active 47 DOM
-
2026-05-31days on market $1,049,900 Active 46 DOM
-
2026-05-18price $1,049,900
-
2026-05-05price $1,069,900
-
2026-04-15$1,099,900 Active
-
2022-02-16soldstatus $659,500
ⓘ Source: listings_history table (triggers on properties + properties_extension) + one-shot
backfill from property_details.listing_events for pre-trigger history.
Tax reassessment forecast KY · Resets to sale price
- Current annual tax
- $3,695 · $308/mo
- Projected year-2 tax
- $8,599 · $717/mo
- Expected delta
- +$4,904/yr (+$409/mo · 132.7%)
ⓘ Screening estimate from a state-policy table — verify with the county assessor before closing.
Climate risk First Street
- Flood 1/10 Low FEMA zone X (unshaded) · 0% chance over 30 yrs
- Wildfire 1/10 Low
- Heat 4/10 Moderate 7 d/yr ≥101°F today · 19 d/yr by 30 yrs out
- Wind 2/10 Low 2% chance of damaging wind over 30 yrs
- Air quality 1/10 Low 0 unhealthy d/yr today · 0 by 30 yrs out
Nearby sold comps map
Loading sold comps map…
Walkable amenities ~0.75 mi
Loading nearby amenities…
Taxation est. · year 1
- Rental income
- $122,676
- − Mortgage interest
- −$56,010
- − Property taxes
- −$3,695
- − Insurance
- −$5,000
- − Repairs & maintenance
- −$9,814
- − Management
- −$9,814
- − Depreciation
- −$29,088
- Taxable income
- $9,255
- Est. tax owed @ 24.0%
- −$2,221
- After-tax cash flow
- $23,075/yr
For passive investors: Depreciation is non-cash, so a rental often shows a tax loss while cash-flowing — sheltering income. Rental losses are passive: they offset passive income freely, and up to $25,000/yr can offset ordinary (W-2) income if you actively participate and your MAGI is under $100k (phasing out to $0 by $150k); unused losses carry forward. On sale, claimed depreciation is recaptured at up to 25%, and gains may owe capital-gains tax (a 1031 exchange can defer both). Figures are a year-1 estimate at your 24.0% rate — not tax advice; consult a CPA.
Schools (NCES district)
- District
- Fayette County
- NCES district ID
- 2101860
- Math proficiency
- 35% ▼ -16.00%
- Reading proficiency
- 45% ▼ -13.00%
- Median HH income
- $49,245
- Composite
- 34.38/100
- National rank
- #5211
- State rank
- #27 of 165 in KY
Livability — Lexington-Fayette
No livability data for this city. (Only ~50 U.S. cities are tracked.)
Census & demographics
- Census place
- Lexington-Fayette, KY
- County
- Fayette County · 317,143 people
- City population
- 321,882
- Metro
- Lexington-Fayette, KY
- Population (ZIP)
- 35,656
- Household income
- $53,670
- Rent vs Own
- Severe rent burden
- 2743.0
Population outlook (Fayette County) Hauer SSP2
- Today (2025)
- 363,454 people
- By 2030
- 388,270 · +6.8%
- By 2040
- 438,688 · +20.7%
- By 2050
- 490,667 · +35.0%
- By 2075
- 625,394 · +72.1%
- By 2100
- 721,354 · +98.5%
Race, ethnicity, and origin ACS 2023
- Neighborhood character
- Diverse neighborhood (Simpson 0.57)
- Race & ethnicity
- White 60% Black 24% Two or more races 9% Hispanic / Latino 8% Asian 2%
- Hispanic origin (detail)
- Mexican 5%
- Common ancestry
- Italian 3% Lithuanian 2% Slovak 1%
- Foreign-born
- 9% · Canada
- Languages at home
- 87% English-only · Spanish 6% Other Indo-European 2% Arabic 1%
Political lean MEDSL · Fayette
- 2024 margin
- D (+18.1) · D 58.0% · R 39.9% · Other 2.1%
- 2008→2024 swing
- +13.3pp toward D · 2008: 4.8pp · 2024: 18.1pp
- All cycles
- 2024: D+18.1 2020: D+20.8 2016: D+9.5 2012: D+1.0 2008: D+4.8
Not yet ingested
- Civics
- —
Market trends
- HPI YoY
- ▼ -182.53%
- Current HPI
- 248.0466
- Rent YoY
- ▲ 4.52%
- Metro
- Lexington-Fayette, KY
- State GDP YoY
- ▲ 1.81%
- F500 in state
- 4
Industry mix (Fortune 500 HQ in KY)
| Industry | F500 HQs | Revenue |
|---|---|---|
| Healthcare | 1 | $118B |
|
||
| Food / Beverage | 1 | $7B |
|
||
Price history
+59.2% since first listed4 events — show timeline
- 2026-05-18 Price Changed $1,049,900 ImagineMLS
- 2026-05-05 Price Changed $1,069,900 ImagineMLS
- 2026-04-15 Listed $1,099,900 ImagineMLS
- 2022-02-16 Sold (Public Records) $659,500 Public Records
Property tax history
+1.8%/yrLatest (2015): $3,695 · +1.8% YoY. Source: county tax records.
Cash-flow waterfall
monthlySold comps — $/sqft
last 12 mo · ≤1 miLoading sold comps…