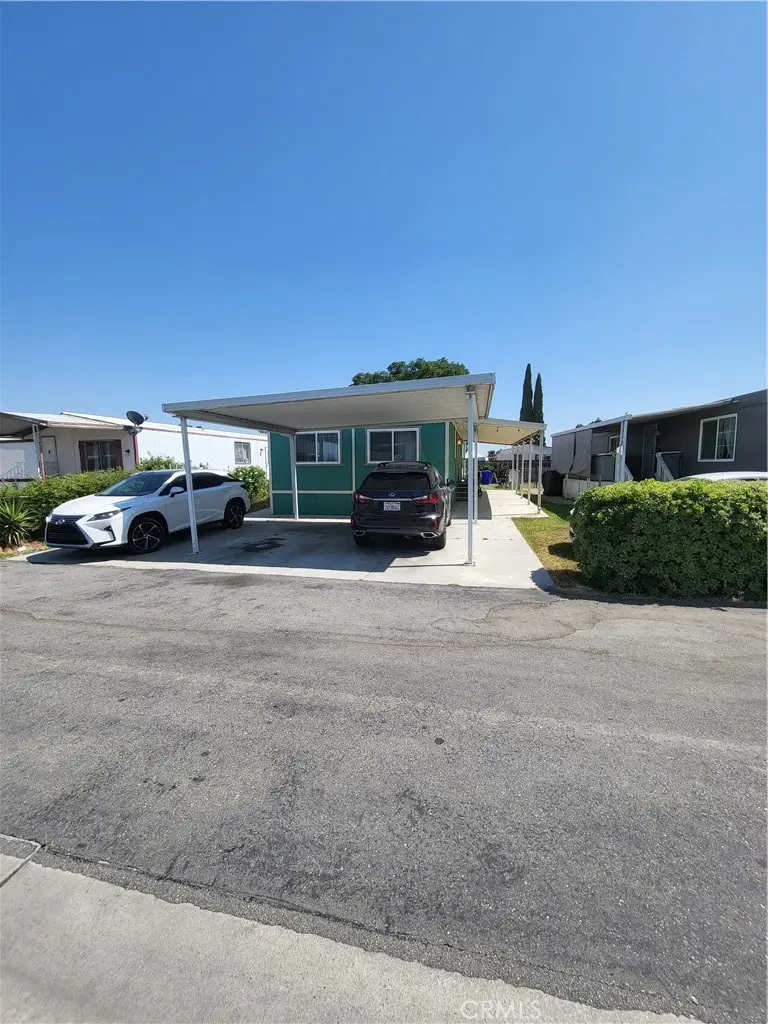
10701 Cedar Ave #46 · Bloomington, CA
Flood risk 1/10 · Minimal
- FEMA flood zone
- X (unshaded)
- Chance of flooding over 30 yrs
- 0.0%
- Est. flood insurance / yr
- $507 – $1,088
Fire risk 3/10 · Minor
- Est. fire insurance / yr
- $659 – $1,223
Heat risk 8/10 · Major
- Hot days now (above 103°F)
- 7 days/yr
- Hot days in 30 yrs
- 19 days/yr
Wind risk 1/10 · Minimal
- Chance of severe wind over 30 yrs
- —
Air-quality risk 10/10 · Severe
- Unhealthy air days now
- 27 days/yr
- Unhealthy air days in 30 yrs
- 32 days/yr
Risk factors via First Street. Map © Google.
Why this score? — see what drove the C+ grade
The composite is a weighted blend of 9 inputs, each scored 0–100. Each bar is that input's sub-score; the figure is the points it added to the 100-point composite (weight × sub-score).
- Cash flow +30.0/30.0
- 1% rule +10.0/10.0
- DSCR +10.0/10.0
- ARV discount +4.4/15.0
- Livability +2.7/5.0
- Rent growth +2.5/5.0
- Condition / age +2.5/5.0
- Schools +2.4/10.0
- Appreciation +0.0/10.0
$129,000
🖨 Deal sheet 📄 Offer letter ✓ Due diligence
Listing remarks MLS
beautiful upgraded and remodeled double wide mobile home. Perfect home for that starter family. Home is beautifully designed with upgraded Grey laminate flooring throughout, fantastic new modern kitchen with sparkly quartz counter tops, real glass tile back splashes, Grey shaker cabinets with plenty of room for storage. . very large living areas, large living room, perfect dining room, and huge master bedroom. Kid s room is perfect for 2 twin beds if needed. Bathrooms are elegantly remodeled with favorable 12x24 ceramic tile floors, big granite vanities and master bath has elegant white and very subway tiles for one's enjoyment. Need to cool down for the summer, each room has split systems for heat and cooling. Last but not least the back yard has more than enough room for that big family and kids to celebrate holidays or birthdays. Come see your future new home. Also park had a swimming pool for summer play, it's a family park for your children to make life long friends.
Key facts
- Grey shaker cabinets
- Large living areas
- Modern kitchen
Tags
Neighborhood map
What this means for you Summary
Snapshot
- This is a 2-bed/1.0-bath manufactured listed at $129k.
Deal economics
- At list price, monthly cash flow is $687 ($8k/yr) — positive.
- The deal already cash-flows at list — no discount required.
- Meets the 1% rule at list price ($2k rent vs $129k).
- Recommended offer: $125k (3.0% below list) — sets the bar for market timing.
- Cap rate 12.7% vs local median 3.1% in Bloomington — top-decile yield for the area; either an underpriced asset or a hidden risk that comps aren't pricing in. Stress-test before assuming the spread holds.
Location & tenants
- Location reads 53/100 on livability (#977 in CA) — a working-class tenant base; expect higher turnover. Strengths: housing A+, employment B; Watch: commute D, schools F, crime F.
- Colton Joint Unified (suburban): math 16% / reading 38% proficiency, ranked #373 of 517 in CA (top 72%) — low school quality limits family demand, transient renter base, plan for 1-2y turnover; 70% free/reduced lunch — lower-income household profile, screen leases tightly.
- Market conditions: 44 active listings in the ZIP; 5 comparable units currently listed for rent nearby; rentals lingering (median 44d on market — plan ~5-8 weeks vacancy on turnover, expect pricing pressure); 100% of comp listings sitting > 30 days — soft ceiling on asking rent; 5,458 units permitted in San Bernardino County in 2024 (1,500 in 5+ unit buildings).
Forward outlook
- Local home prices are declining (-3.0%/yr); year-one equity from $892 of loan paydown is wiped out by about $4k of value loss. Plan a longer hold.
- San Bernardino County population projected at +15% by 2050 — modest demand growth; plan on rents tracking national, not racing it.
- At projected returns (-3.0% appreciation + 3.0% rent growth), your $36k cash investment doubles in ~6 years — after that, you're playing with house money.
Negotiation context
- It's been on market 31 days — a 3% lower offer ($125k) is reasonable based on typical stale-listing flexibility.
- 4 sale attempts since 19y ago; this cycle's ask has dropped $10k (7%) from the opening price — seller is motivated, your offer sets the floor, not the list.
Risks & watch-outs
- Climate carrying-cost: extreme-heat days projected 7→19/yr by 2055 (HVAC capex compounding) — expect insurance premiums to compound above CPI over the hold.
Questions for the listing agent
- It's been on market 31 days. Have you received any prior offers? Is the seller open to a 3% concession, seller financing, or rate buy-down credit?
- Is there a deadline driving the sale (1031 exchange, divorce, estate, relocation)? That informs how much negotiation room exists.
- Schools are F-rated, which usually means shorter tenancies and higher turnover. Who's the typical renter profile here, and what's been the actual vacancy rate?
- Crime grade is F in this area — have there been break-ins, vandalism, or insurance claims at this property in the last 3 years? What carrier currently insures it and at what premium?
- What's the average days-on-market for RENTAL listings here right now (not sales)? A rising rental-DOM trend means longer vacancies and softer asking-rent achievability than the comps imply.
- What's the recent tenant-quality profile in this submarket — average credit score on applications, eviction rate, late-payment / NSF rate, and stable-employment percentage? A property-management company in the area should have these aggregated.
- How much new for-sale + rental construction is in the pipeline within 1–3 miles? Heavy new supply typically softens prices + rents 12–24 months out; constrained supply supports both.
Investment metrics
- 1% rule
- 1.55% ✓
- Cap rate
- 12.69%
- Cash-on-cash
- 22.84%
- DSCR
- 2.02
- GRM
- 5.4
CMA / ARV
- ARV (median comp)
- $120,569
- List price
- $129,000
- Delta
- 24.33%
- Verdict
- OVERPRICED
- Comps
- 4 within 1.0 mi
Show comp detail 2 sales within ~0.75 mi
| Address | Dist | Beds/Ba | Sqft | Sold | Price | $/sf | Match |
|---|---|---|---|---|---|---|---|
| 10701 Cedar Ave #47 | 0.09mi | 2/2.0 | 960 (+9%) | 16mo | $135,000 | $141 | 63 |
| 10701 Cedar #138 | 0.09mi | 3/2.0 (+1) | 950 (+8%) | 22mo | $130,000 | $137 | 55 |
Match score weights: distance 35% · size 25% · config 20% · recency 20%. Top-matched comps best support the ARV.
Projected returns pro-forma
-3.0% appreciation · 3.0% rent growth · sell at horizon
- IRR
- 15.8%
- Equity multiple
- 1.63×
- Total profit
- $22,910
- Equity at exit
- $19,234
- IRR
- 24.4%
- Equity multiple
- 3.12×
- Total profit
- $76,451
- Equity at exit
- $11,154
Cash invested: $36,120 (down + closing). Projections, not guarantees.
Landlord ↔ Tenant lean methodology
- Overall (STATE)
- 18 Strongly Tenant-Friendly
- State California
- 18 Strongly Tenant-Friendly · D+13
- County
- — inherits STATE
- City
- — inherits STATE
ZIP-level market 92316
- Home prices YoY
- -34.1%
- Active inventory
- 44
- Price-to-rent
- 5.4×
Monthly cashflow live
- Estimated rent
- $1,999 high interval (Pro) →
- Mortgage (P&I)
- −$676
- Tax est. 1.5%
- −$161 /mo · $1,935/yr
- Insurance
- −$54
- HOA
- −$0
- Vacancy / Maint / Mgmt
- −$420
- Net cashflow
- $687
Break-even live
UW: 25.0% down · 7.5% · 30yr · 1.5% tax · 5.0% vac · 8.0% maint · 8.0% mgmt
Financing live
Cash to close
- Down payment
- $32,250
- Closing costs
- $3,870
- Reserves months
- —
- Total cash needed
- —
Loan-product check · same deal, 3 products live
Conventional
25% down · 7.5% · 30yr
- Down + closing
- —
- Monthly P&I
- —
- Monthly cashflow
- —
- DSCR
- —
- Eligible?
- —
Personal DTI + credit; lowest rate.
DSCR
20% down · 8.5% · 30yr
- Down + closing
- —
- Monthly P&I
- —
- Monthly cashflow
- —
- DSCR
- —
- Eligible?
- —
No personal income docs; deal must DSCR.
Hard money
10% down · 12.0% · 12mo
- Down + closing
- —
- Monthly P&I
- —
- Monthly cashflow
- —
- DSCR
- —
- Eligible?
- —
Short-term bridge; refi at stabilization.
Rent comps 5 comps
| Address | Beds | Baths | Sqft | Rent | $/sqft | DOM | Units | Dist |
|---|---|---|---|---|---|---|---|---|
| 18355 Courtney Ct Unit 2 Bloomington, CA | 1.0 | 1.0 | 600 | $1,950 | $3.25 | 44d | 1 | 0.57mi |
| 10026 Portola Ave Bloomington, CA | 2.0 | 1.0 | 900 | $1,850 | $2.06 | 44d | 1 | 0.97mi |
| 18181 Valley Blvd Bloomington, CA | 2.0 | 1.5 | 814 | $1,960 | $2.41 | 44d | 2 | 1.09mi |
| 18348 10th St Bloomington, CA | 3.0 | 1.0 | 1073 | $2,500 | $2.33 | 44d | 1 | 1.14mi |
| 18348 10th St Unit 2 Bloomington, CA | 2.0 | 1.0 | 600 | $1,800 | $3.00 | 44d | 1 | 1.14mi |
Listing history 23 events
-
2026-06-18days on market $129,000 Active 31 DOM
-
2026-06-18price $129,000 Active 30 DOM
-
2026-06-17days on market $139,000 Active 30 DOM
-
2026-06-16days on market $139,000 Active 29 DOM
-
2026-06-15days on market $139,000 Active 28 DOM
-
2026-06-13days on market $139,000 Active 26 DOM
-
2026-06-13days on market $139,000 Active 25 DOM
-
2026-06-09days on market $139,000 Active 22 DOM
-
2026-06-08days on market $139,000 Active 21 DOM
-
2026-06-07days on market $139,000 Active 20 DOM
-
2026-06-04days on market $139,000 Active 17 DOM
-
2026-06-03days on market $139,000 Active 16 DOM
-
2026-06-02days on market $139,000 Active 15 DOM
-
2026-06-01days on market $139,000 Active 14 DOM
-
2026-05-31days on market $139,000 Active 13 DOM
-
2026-05-18$139,000 Active 987-char remark
Show marketing remark (987 chars)
beautiful upgraded and remodeled double wide mobile home. Perfect home for that starter family. Home is beautifully designed with upgraded Grey laminate flooring throughout, fantastic new modern kitchen with sparkly quartz counter tops, real glass tile back splashes, Grey shaker cabinets with plenty of room for storage. . very large living areas, large living room, perfect dining room, and huge master bedroom. Kid s room is perfect for 2 twin beds if needed. Bathrooms are elegantly remodeled with favorable 12x24 ceramic tile floors, big granite vanities and master bath has elegant white and very subway tiles for one's enjoyment. Need to cool down for the summer, each room has split systems for heat and cooling. Last but not least the back yard has more than enough room for that big family and kids to celebrate holidays or birthdays. Come see your future new home. Also park had a swimming pool for summer play, it's a family park for your children to make life long friends.
-
2026-05-15historical
-
2025-08-06price $149,900
-
2025-06-26$157,000 Active
-
2007-06-23historical
-
2007-06-20$40,000
-
2007-04-27historical
-
2007-04-21$68,000
ⓘ Source: listings_history table (triggers on properties + properties_extension) + one-shot
backfill from property_details.listing_events for pre-trigger history.
Climate risk First Street
- Flood 1/10 Low FEMA zone X (unshaded) · 0% chance over 30 yrs
- Wildfire 3/10 Moderate
- Heat 8/10 Severe 7 d/yr ≥103°F today · 19 d/yr by 30 yrs out
- Wind 1/10 Low
- Air quality 10/10 Extreme 27 unhealthy d/yr today · 32 by 30 yrs out
Nearby sold comps map
Loading sold comps map…
Walkable amenities ~0.75 mi
Loading nearby amenities…
Taxation est. · year 1
- Rental income
- $23,984
- − Mortgage interest
- −$7,226
- − Property taxes
- −$1,935
- − Insurance
- −$645
- − Repairs & maintenance
- −$1,919
- − Management
- −$1,919
- − Depreciation
- −$3,753
- Taxable income
- $6,588
- Est. tax owed @ 24.0%
- −$1,581
- After-tax cash flow
- $6,668/yr
For passive investors: Depreciation is non-cash, so a rental often shows a tax loss while cash-flowing — sheltering income. Rental losses are passive: they offset passive income freely, and up to $25,000/yr can offset ordinary (W-2) income if you actively participate and your MAGI is under $100k (phasing out to $0 by $150k); unused losses carry forward. On sale, claimed depreciation is recaptured at up to 25%, and gains may owe capital-gains tax (a 1031 exchange can defer both). Figures are a year-1 estimate at your 24.0% rate — not tax advice; consult a CPA.
Schools (NCES district)
- District
- Colton Joint Unified
- NCES district ID
- 0609390
- Math proficiency
- 16% ▼ -9.00%
- Reading proficiency
- 38% ▼ -1.00%
- Median HH income
- $51,178
- Composite
- 23.74/100
- National rank
- #7820
- State rank
- #373 of 517 in CA
Livability — Bloomington
- Score
- 53/100
- State rank
- #977
- US rank
- #24604
Category grades
Schools grade is shown separately in the Schools card above.
Census & demographics
- Census place
- Bloomington, CA
- City population
- 31,909
- Population (ZIP)
- 31,909
Population outlook (San Bernardino County) Hauer SSP2
- Today (2025)
- 2,300,329 people
- By 2030
- 2,378,907 · +3.4%
- By 2040
- 2,523,137 · +9.7%
- By 2050
- 2,642,388 · +14.9%
- By 2075
- 2,880,769 · +25.2%
- By 2100
- 2,909,436 · +26.5%
Race, ethnicity, and origin ACS 2023
- Neighborhood character
- Predominantly Hispanic (82%)
- Race & ethnicity
- Hispanic / Latino 82% Two or more races 24% White 12% Black 3% Native American 2%
- Hispanic origin (detail)
- Mexican 76%
- Common ancestry
- Italian 1% Lithuanian 1%
- Foreign-born
- 25% · Canada, Jamaica
- Languages at home
- 34% English-only · Spanish 64% Arabic 1%
Political lean MEDSL · San Bernardino
- 2024 margin
- Toss-up / Even · D 47.5% · R 49.7% · Other 2.8%
- 2008→2024 swing
- -8.5pp toward R · 2008: 6.3pp · 2024: -2.1pp
- All cycles
- 2024: R+2.1 2020: D+10.7 2016: D+9.8 2012: D+5.4 2008: D+6.3
Not yet ingested
- Civics
- —
Market trends
- HPI YoY
- ▼ -250.05%
- Current HPI
- 483.5611
- Rent YoY
- —
- Metro
- —
- State GDP YoY
- ▲ 3.21%
- F500 in state
- 116
Industry mix (Fortune 500 HQ in CA)
| Industry | F500 HQs | Revenue |
|---|---|---|
| Technology | 27 | $1,492B |
|
||
| Financial Services | 3 | $174B |
|
||
| Retail | 3 | $44B |
|
||
| Insurance | 3 | $26B |
|
||
| Media / Entertainment | 2 | $115B |
|
||
| Pharmaceuticals / Biotech | 2 | $62B |
|
||
Price history
+104.4% since first listed8 events — show timeline
- 2026-05-18 Listed $139,000 CRMLS
- 2026-05-15 Listing Removed — CRMLS
- 2025-08-06 Price Changed $149,900 CRMLS
- 2025-06-26 Listed $157,000 CRMLS
- 2007-06-23 Listing Removed — CRMLS
- 2007-06-20 Listed $40,000 CRMLS
- 2007-04-27 Listing Removed — CRMLS
- 2007-04-21 Listed $68,000 CRMLS
Property tax history
+8.7%/yrLatest (2025): $175 · +2.8% YoY. Source: county tax records.
Cash-flow waterfall
monthlySold comps — $/sqft
last 12 mo · ≤1 miLoading sold comps…