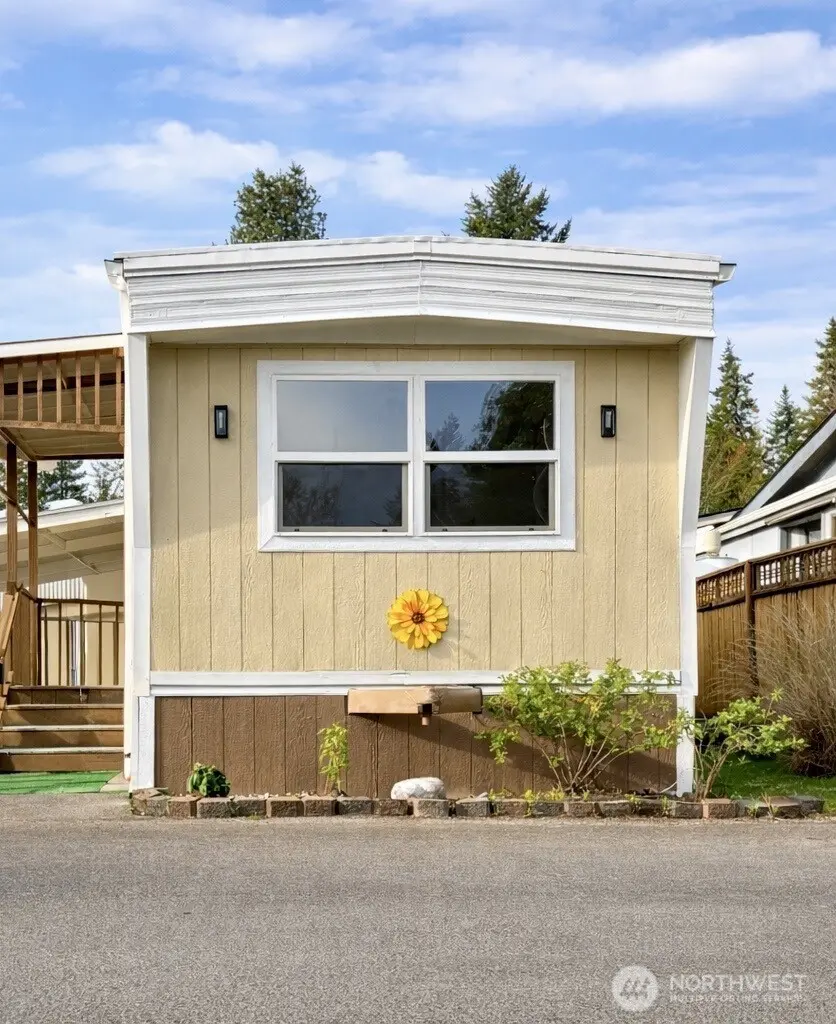
24222 54th Ave W #57 · Mountlake Terrace, WA
Flood risk No data
- FEMA flood zone
- —
- Chance of flooding over 30 yrs
- —
- Est. flood insurance / yr
- —
Fire risk No data
- Est. fire insurance / yr
- —
Heat risk No data
- Hot days now (above threshold)
- —
- Hot days in 30 yrs
- —
Wind risk No data
- Chance of severe wind over 30 yrs
- —
Air-quality risk No data
- Unhealthy air days now
- —
- Unhealthy air days in 30 yrs
- —
Risk factors via First Street. Map © Google.
Why this score? — see what drove the C+ grade
The composite is a weighted blend of 9 inputs, each scored 0–100. Each bar is that input's sub-score; the figure is the points it added to the 100-point composite (weight × sub-score).
- Cash flow +30.0/30.0
- 1% rule +10.0/10.0
- DSCR +10.0/10.0
- Schools +5.4/10.0
- Livability +4.2/5.0
- Condition / age +2.5/5.0
- Rent growth +2.4/5.0
- ARV discount +0.0/15.0
- Appreciation +0.0/10.0
$99,950
🖨 Deal sheet (PDF) 📄 Offer letter ✓ Due diligence
Listing remarks
Updated Mountlake Terrace Home Near Shoreline Border– Easy Seattle Commute! Welcome to this beautifully refreshed and move-in ready home located in Mountlake Terrace perfectly positioned along the Shoreline border, offering the ideal blend of affordability, convenience, and comfort. Enjoy nearby grocery stores, restaurants, urgent care, and daily essentials, along with quick access to I-5 and nearby light rail for an easy commute to downtown Seattle—approximately 20–25 minutes in non-peak traffic. Situated on a spacious corner lot in a quiet and friendly 55+ community, this home features thoughtful updates throughout. Interior Updates: All new interior paint, Updated kitch
Key facts
- Large closet
- New sink
- New hood
Tags
Neighborhood map
What this means for you Summary
Snapshot
- This is a 2-bed/1.0-bath manufactured listed at $100k.
Deal economics
- At list price, monthly cash flow is $953 ($11k/yr) — positive.
- The deal already cash-flows at list — no discount required.
- Meets the 1% rule at list price ($2k rent vs $100k).
- Recommended offer: $97k (3.0% below list) — sets the bar for market timing.
- Cap rate 17.7% vs local median 2.1% in Mountlake Terrace — top-decile yield for the area; either an underpriced asset or a hidden risk that comps aren't pricing in. Stress-test before assuming the spread holds.
Location & tenants
- Location reads 85/100 on livability (#28 in WA, #500 nationally) — a professional / high-income tenant draw. Strengths: commute A+, employment A+, housing A+; Watch: cost of living F.
- Edmonds School District (suburban): math 54% / reading 65% proficiency, ranked #53 of 291 in WA (top 18%) — acceptable for families but not a draw, mixed tenant base, ~2y average lease.
- Zoned schools: Mountlake Terrace Elementary (395 students, 60% FRL); Brier Terrace Middle School (682 students, 36% FRL); Mountlake Terrace High School (1,467 students, 34% FRL) — zoned schools average 44% FRL vs 28% district-wide (15 pts higher); higher-poverty schools than district average — tighter screening recommended.
- Market conditions: Rents soft (-0.5%/yr); 84 active listings in the ZIP; 12 comparable units currently listed for rent nearby; rentals leasing fast (median 1d on market — plan ~1-2 weeks tenant-placement turnaround); solid renter incomes; 3,982 units permitted in Snohomish County in 2024 (1,492 in 5+ unit buildings).
Forward outlook
- Local home prices are declining (-3.0%/yr); year-one equity from $692 of loan paydown is wiped out by about $3k of value loss. Plan a longer hold.
- Snohomish County population projected at +30% by 2050 — long-run rental-demand tailwind backs the buy-and-hold thesis.
- At projected returns (-3.0% appreciation + 0.0% rent growth), your $28k cash investment doubles in ~4 years — after that, you're playing with house money.
Negotiation context
- It's been on market 54 days — a 3% lower offer ($97k) is reasonable based on typical stale-listing flexibility.
- 2 sale attempts since 10y ago with the ask held roughly flat each time — persistent listings suggest the price (not the market) is what's stuck; bring a comps-based counter.
- Current owner paid $15k; list at $100k implies a 566% gain — meaningful room to come down on a strong offer.
Questions for the listing agent
- It's been on market 54 days. Have you received any prior offers? Is the seller open to a 3% concession, seller financing, or rate buy-down credit?
- Built in 1968 — when were the roof, HVAC, electrical panel, plumbing, and water heater last replaced?
- Is there a deadline driving the sale (1031 exchange, divorce, estate, relocation)? That informs how much negotiation room exists.
- Schools are A-rated — typically a magnet for longer-tenancy family renters. What's the average tenant stay here, and is there a school-zone premium baked into asking?
- What's the average days-on-market for RENTAL listings here right now (not sales)? A rising rental-DOM trend means longer vacancies and softer asking-rent achievability than the comps imply.
- What's the recent tenant-quality profile in this submarket — average credit score on applications, eviction rate, late-payment / NSF rate, and stable-employment percentage? A property-management company in the area should have these aggregated.
- How much new for-sale + rental construction is in the pipeline within 1–3 miles? Heavy new supply typically softens prices + rents 12–24 months out; constrained supply supports both.
Investment metrics
- 1% rule
- 2.08% ✓
- Cap rate
- 17.74%
- Cash-on-cash
- 40.88%
- DSCR
- 2.82
- GRM
- 4.0
CMA / ARV
- ARV (median comp)
- $78,000
- List price
- $99,950
- Delta
- 28.14%
- Verdict
- OVERPRICED
- Comps
- 1 within 2.0 mi
Show comp detail 1 sale within ~0.75 mi
| Address | Dist | Beds/Ba | Sqft | Sold | Price | $/sf | Match |
|---|---|---|---|---|---|---|---|
| 24222 54th Ave W #57 | 0.00mi | 2/1.0 | 672 (0%) | 1mo | $78,000 | $116 | 99 |
Match score weights: distance 35% · size 25% · config 20% · recency 20%. Top-matched comps best support the ARV.
Projected returns pro-forma
-3.0% appreciation · 0.0% rent growth · sell at horizon
- IRR
- 33.9%
- Equity multiple
- 2.37×
- Total profit
- $38,461
- Equity at exit
- $14,903
- IRR
- 39.2%
- Equity multiple
- 4.15×
- Total profit
- $88,242
- Equity at exit
- $8,642
Cash invested: $27,986 (down + closing). Projections, not guarantees.
Landlord ↔ Tenant lean methodology
- Overall (STATE)
- 28 Tenant-Leaning
- State Washington
- 28 Tenant-Leaning · D+8
- County
- — inherits STATE
- City
- — inherits STATE
ZIP-level market 98043
- Rents YoY
- -0.5%
- Active inventory
- 84
- Price-to-rent
- 4.0×
Monthly cashflow live
- Estimated rent
- $2,081 high interval (Pro) →
- Mortgage (P&I)
- −$524
- Tax est. 1.5%
- −$125 /mo · $1,499/yr
- Insurance
- −$42
- HOA
- −$0
- Vacancy / Maint / Mgmt
- −$437
- Net cashflow
- $953
Break-even live
Sensitivity live
| Price | -10% $1,023 | -5% $988 | +0% $953 | +5% $919 | +10% $884 |
|---|---|---|---|---|---|
| Rent | -10% $789 | -5% $871 | +0% $953 | +5% $1,036 | +10% $1,118 |
| Rate | -1.0pp $1,004 | -0.5pp $979 | base $953 | +0.5pp $928 | +1.0pp $901 |
UW: 25.0% down · 7.5% · 30yr · 1.5% tax · 5.0% vac · 8.0% maint · 8.0% mgmt
Financing live
Cash to close
- Down payment
- $24,988
- Closing costs
- $2,998
- Reserves months
- —
- Total cash needed
- —
Loan-product check · same deal, 3 products live
Conventional
25% down · 7.5% · 30yr
- Down + closing
- —
- Monthly P&I
- —
- Monthly cashflow
- —
- DSCR
- —
- Eligible?
- —
Personal DTI + credit; lowest rate.
DSCR
20% down · 8.5% · 30yr
- Down + closing
- —
- Monthly P&I
- —
- Monthly cashflow
- —
- DSCR
- —
- Eligible?
- —
No personal income docs; deal must DSCR.
Hard money
10% down · 12.0% · 12mo
- Down + closing
- —
- Monthly P&I
- —
- Monthly cashflow
- —
- DSCR
- —
- Eligible?
- —
Short-term bridge; refi at stabilization.
Rent comps 12 comps
| Address | Beds | Baths | Sqft | Rent | $/sqft | DOM | Units | Dist |
|---|---|---|---|---|---|---|---|---|
| 1795 NE 205th St Shoreline, WA | 1.0 | 1.0 | 654 | $1,724 | $2.63 | 6d | 3 | 0.19mi |
| 19921 19th Ave NE Shoreline, WA | 1.0 | 1.0 | 650 | $1,599 | $2.46 | 6d | 1 | 0.36mi |
| 20057 Ballinger Way NE Shoreline, WA | 1.0–3.0 | 1.0–2.0 | 950 | $1,963 | $2.07 | 0d | 11 | 0.39mi |
| 24000 Van Ry Blvd Mountlake Terrace, WA | 3.0 | 1.0–2.0 | 1013 | $2,947 | $2.91 | 0d | 33 | 0.49mi |
| 23905 Van Ry Blvd Mountlake Terrace, WA | 1.0–2.0 | 1.0–2.0 | 830 | $2,895 | $3.49 | 0d | 25 | 0.50mi |
| 2609 NE 195th St Lake Forest Park, WA | 1.0 | 1.0 | 634 | $1,534 | $2.42 | 0d | 4 | 0.66mi |
| 4208 236th St SW Mountlake Terrace, WA | 1.0–3.0 | 1.0–2.0 | 926 | $2,338 | $2.52 | 0d | 28 | 0.90mi |
| 18553 8th Ave NE Shoreline, WA | 3.0 | 1.0–2.0 | 895 | $3,096 | $3.46 | 0d | 1 | 1.16mi |
| 2405 N 202nd Pl Shoreline, WA | 1.0–3.0 | 1.0–2.0 | 938 | $2,270 | $2.42 | 0d | 16 | 1.23mi |
| 22817 Lakeview Dr Mountlake Terrace, WA | 1.0–2.0 | 1.0 | 887 | $2,135 | $2.41 | 3d | 8 | 1.31mi |
| 17712 15th Ave NE Shoreline, WA | 2.0 | 1.0–2.0 | 789 | $3,593 | $4.55 | 0d | 107 | 1.41mi |
| 1549 NE 177th St Shoreline, WA | 1.0 | 1.0 | 615 | $1,550 | $2.52 | 26d | 1 | 1.47mi |
Listing history 5 events
-
2026-05-14status Pending
-
2026-03-20$99,950 Active
-
2016-04-15soldstatus $15,000 Sold
-
2016-04-05status Pending
-
2016-03-31$20,000 Active
ⓘ Source: listings_history table (triggers on properties + properties_extension) + one-shot
backfill from property_details.listing_events for pre-trigger history.
Nearby sold comps map
Loading sold comps map…
Walkable amenities ~0.75 mi
Loading nearby amenities…
Taxation est. · year 1
- Rental income
- $24,975
- − Mortgage interest
- −$5,599
- − Property taxes
- −$1,499
- − Insurance
- −$500
- − Repairs & maintenance
- −$1,998
- − Management
- −$1,998
- − Depreciation
- −$2,908
- Taxable income
- $10,474
- Est. tax owed @ 24.0%
- −$2,514
- After-tax cash flow
- $8,928/yr
For passive investors: Depreciation is non-cash, so a rental often shows a tax loss while cash-flowing — sheltering income. Rental losses are passive: they offset passive income freely, and up to $25,000/yr can offset ordinary (W-2) income if you actively participate and your MAGI is under $100k (phasing out to $0 by $150k); unused losses carry forward. On sale, claimed depreciation is recaptured at up to 25%, and gains may owe capital-gains tax (a 1031 exchange can defer both). Figures are a year-1 estimate at your 24.0% rate — not tax advice; consult a CPA.
Schools (NCES district)
- District
- Edmonds School District
- NCES district ID
- 5302400
- Math proficiency
- 54% ▼ -1.00%
- Reading proficiency
- 65% ▬ 0.00%
- Median HH income
- $67,451
- Composite
- 53.94/100
- National rank
- #3026
- State rank
- #53 of 291 in WA
Livability — Mountlake Terrace
- Score
- 85/100
- State rank
- #28
- US rank
- #500
Category grades
Schools grade is shown separately in the Schools card above.
Census & demographics
- Census place
- Mountlake Terrace, WA
- County
- Snohomish County · 786,756 people
- City population
- 23,101
- Metro
- Seattle-Tacoma-Bellevue, WA
- Population (ZIP)
- 23,101
- Household income
- $107,687
- Rent vs Own
- Severe rent burden
- 724.0
Population outlook (Snohomish County) Hauer SSP2
- Today (2025)
- 899,800 people
- By 2030
- 960,975 · +6.8%
- By 2040
- 1,074,447 · +19.4%
- By 2050
- 1,171,954 · +30.2%
- By 2075
- 1,384,849 · +53.9%
- By 2100
- 1,497,296 · +66.4%
Race, ethnicity, and origin ACS 2023
- Neighborhood character
- Diverse neighborhood (Simpson 0.59)
- Race & ethnicity
- White 61% Hispanic / Latino 17% Two or more races 11% Asian 10% Black 4% Native American 1%
- Hispanic origin (detail)
- Mexican 12%
- Common ancestry
- Portuguese 5% Italian 4% Lithuanian 3%
- Foreign-born
- 18% · Canada, China, South Korea
- Languages at home
- 76% English-only · Spanish 12% Other Asian/Pacific 3% Other Indo-European 2%
Political lean MEDSL · Snohomish
- 2024 margin
- D (+19.0) · D 57.8% · R 38.9% · Other 3.3%
- 2008→2024 swing
- +0.1pp no change · 2008: 18.9pp · 2024: 19.0pp
- All cycles
- 2024: D+19.0 2020: D+20.6 2016: D+16.6 2012: D+16.2 2008: D+18.9
Not yet ingested
- Civics
- —
Market trends
- HPI YoY
- ▼ -907.23%
- Current HPI
- 347.9259
- Rent YoY
- ▼ -0.47%
- Metro
- Seattle-Tacoma-Bellevue, WA
- State GDP YoY
- ▲ 4.65%
- F500 in state
- 22
Industry mix (Fortune 500 HQ in WA)
| Industry | F500 HQs | Revenue |
|---|---|---|
| Retail | 2 | $269B |
|
||
| Technology / Retail | 1 | $638B |
|
||
| Technology | 1 | $245B |
|
||
| Telecommunications | 1 | $38B |
|
||
| Food / Beverage | 1 | $36B |
|
||
| Automotive / Trucks | 1 | $34B |
|
||
Price history
+399.8% since first listed5 events — show timeline
- 2026-05-14 Pending — NWMLS as Distributed by MLS Grid
- 2026-03-20 Listed $99,950 NWMLS as Distributed by MLS Grid
- 2016-04-15 Sold (MLS) $15,000 NWMLS as Distributed by MLS Grid
- 2016-04-05 Pending — NWMLS as Distributed by MLS Grid
- 2016-03-31 Listed $20,000 NWMLS as Distributed by MLS Grid
Property tax history
+4.0%/yrLatest (2026): $171 · -8.0% YoY. Source: county tax records.
Cash-flow waterfall
monthlySold comps — $/sqft
last 12 mo · ≤1 miLoading sold comps…