18026 N Cave Creek Rd #1 · Phoenix, AZ
Flood risk 1/10 · Minimal
- FEMA flood zone
- X (shaded)
- Chance of flooding over 30 yrs
- 0.0%
- Est. flood insurance / yr
- $507 – $1,088
Fire risk 4/10 · Minor
- Est. fire insurance / yr
- $610 – $1,132
Heat risk 8/10 · Major
- Hot days now (above 110°F)
- 5 days/yr
- Hot days in 30 yrs
- 13 days/yr
Wind risk 1/10 · Minimal
- Chance of severe wind over 30 yrs
- —
Air-quality risk 3/10 · Minor
- Unhealthy air days now
- 3 days/yr
- Unhealthy air days in 30 yrs
- 5 days/yr
Risk factors via First Street. Map © Google.
Why this score? — see what drove the B+ grade
The composite is a weighted blend of 9 inputs, each scored 0–100. Each bar is that input's sub-score; the figure is the points it added to the 100-point composite (weight × sub-score).
- Cash flow +30.0/30.0
- ARV discount +14.0/15.0
- 1% rule +10.0/10.0
- DSCR +10.0/10.0
- Schools +3.8/10.0
- Livability +3.8/5.0
- Condition / age +3.8/5.0
- Rent growth +2.1/5.0
- Appreciation +0.0/10.0
$35,000
🖨 Deal sheet 📄 Offer letter ✓ Due diligence
Listing remarks MLS
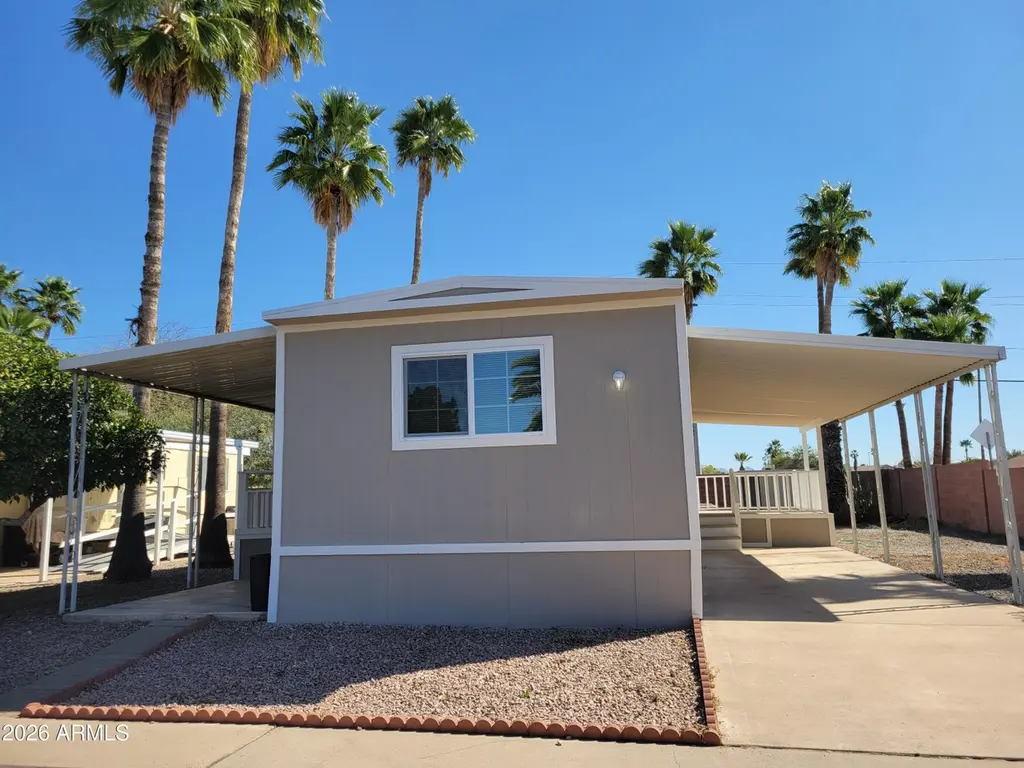
Stunning upgrades on this end lot home, in the gated, 55+ community of Paradise North! This home boasts luxury upgrades, including but not limited to a beautiful marble tiled shower, stainless steel appliances, vinyl plank flooring throughout and TWO decks (one in the front of the home and one in the back)! Enjoy meeting your neighbors at community events, or by the community pool in those warmer months! Step inside, and unwind in your beautiful new home!
Key facts
- Gated community
- Marble tiled shower
- Community pool
Tags
Neighborhood map
What this means for you Summary
Snapshot
- This is a 1-bed/1.0-bath manufactured listed at $35k. Condition is rated good.
Deal economics
- At list price, monthly cash flow is $712 ($9k/yr) — positive.
- The deal already cash-flows at list — no discount required.
- Meets the 1% rule at list price ($1k rent vs $35k).
- Recommended offer: $32k (9.0% below list) — sets the bar for market timing.
- Cap rate 30.7% vs local median 3.3% in Phoenix — top-decile yield for the area; either an underpriced asset or a hidden risk that comps aren't pricing in. Stress-test before assuming the spread holds.
Location & tenants
- Location reads 75/100 on livability (#16 in AZ, #3,924 nationally) — a middle-class / working-renter tenant base. Strengths: amenities A+, commute A+, housing A+; Watch: health & safety C-, crime F.
- Paradise Valley Unified District (4241) (urban): math 39% / reading 46% proficiency, ranked #56 of 249 in AZ (top 22%) — families likely to look elsewhere, expect single-tenant / working-renter base with shorter leases.
- Market conditions: Rents soft (-1.5%/yr); 337 active listings in the ZIP; 25 comparable units currently listed for rent nearby; rentals leasing fast (median 5d on market — plan ~1-2 weeks tenant-placement turnaround); solid renter incomes; 36,011 units permitted in Maricopa County in 2024 (12,801 in 5+ unit buildings).
Forward outlook
- Local home prices are declining (-3.0%/yr); year-one equity from $242 of loan paydown is wiped out by about $1k of value loss. Plan a longer hold.
- Maricopa County population projected at +38% by 2050 — long-run rental-demand tailwind backs the buy-and-hold thesis.
- At projected returns (-3.0% appreciation + 0.0% rent growth), your $10k cash investment doubles in ~2 years — after that, you're playing with house money.
Negotiation context
- It's been on market 104 days — a 9% lower offer ($32k) is reasonable based on typical stale-listing flexibility.
Risks & watch-outs
- Climate carrying-cost: extreme-heat days projected 5→13/yr by 2055 (HVAC capex compounding) — expect insurance premiums to compound above CPI over the hold.
Questions for the listing agent
- It's been on market 104 days. Have you received any prior offers? Is the seller open to a 9% concession, seller financing, or rate buy-down credit?
- Built in 1978 — when were the roof, HVAC, electrical panel, plumbing, and water heater last replaced?
- Why hasn't it sold? Are there any deal-killer items the seller is aware of (foundation, flood, title, zoning, code violations)?
- Is there a deadline driving the sale (1031 exchange, divorce, estate, relocation)? That informs how much negotiation room exists.
- Crime grade is F in this area — have there been break-ins, vandalism, or insurance claims at this property in the last 3 years? What carrier currently insures it and at what premium?
- What's the average days-on-market for RENTAL listings here right now (not sales)? A rising rental-DOM trend means longer vacancies and softer asking-rent achievability than the comps imply.
- What's the recent tenant-quality profile in this submarket — average credit score on applications, eviction rate, late-payment / NSF rate, and stable-employment percentage? A property-management company in the area should have these aggregated.
- How much new for-sale + rental construction is in the pipeline within 1–3 miles? Heavy new supply typically softens prices + rents 12–24 months out; constrained supply supports both.
Investment metrics
- 1% rule
- 3.45% ✓
- Cap rate
- 30.71%
- Cash-on-cash
- 87.22%
- DSCR
- 4.88
- GRM
- 2.4
CMA / ARV
- ARV (median comp)
- $40,928
- List price
- $35,000
- Delta
- -14.48%
- Verdict
- UNDERPRICED
- Comps
- 4 within 1.0 mi
Show comp detail 9 sales within ~0.75 mi
| Address | Dist | Beds/Ba | Sqft | Sold | Price | $/sf | Match |
|---|---|---|---|---|---|---|---|
| 2120 E Bluefield Ave #141 | 0.36mi | 1/1.0 | 768 (+6%) | 13mo | $45,000 | $59 | 63 |
| 2523 E Contention Mine Rd #34 | 0.39mi | 2/1.5 (+1) | 728 (0%) | 14mo | $50,000 | $69 | 63 |
| 18026 N Cave Creek Rd #101 | 0.05mi | 2/1.0 (+1) | 784 (+8%) | 21mo | $55,000 | $70 | 62 |
| 2523 E Contention Mine Rd #29 | 0.39mi | 1/1.0 | 704 (-3%) | 17mo | $70,000 | $99 | 62 |
| 2524 E Contention Mine Rd #45 | 0.42mi | 2/1.0 (+1) | 720 (-1%) | 17mo | $36,000 | $50 | 60 |
| 2502 E Cowan Cir | 0.50mi | 1/1.0 | 750 (+3%) | 14mo | $169,900 | $227 | 60 |
| 2524 E Contention Mine Rd #46 | 0.44mi | 1/1.0 | 660 (-9%) | 14mo | $25,000 | $38 | 52 |
| 19225 N Cave Creek Rd N #61 | 0.74mi | 2/1.5 (+1) | 758 (+4%) | 12mo | $11,000 | $15 | 42 |
| 2701 E Utopia Rd #3 | 0.72mi | 1/1.0 | 644 (-12%) | 13mo | $36,000 | $56 | 36 |
Match score weights: distance 35% · size 25% · config 20% · recency 20%. Top-matched comps best support the ARV.
Projected returns pro-forma
-3.0% appreciation · 0.0% rent growth · sell at horizon
- IRR
- 84.3%
- Equity multiple
- 4.69×
- Total profit
- $36,172
- Equity at exit
- $5,219
- IRR
- 86.9%
- Equity multiple
- 8.79×
- Total profit
- $76,307
- Equity at exit
- $3,026
Cash invested: $9,800 (down + closing). Projections, not guarantees.
Landlord ↔ Tenant lean methodology
- Overall (STATE)
- 87 Strongly Landlord-Friendly
- State Arizona
- 87 Strongly Landlord-Friendly · R+3
- County
- — inherits STATE
- City
- — inherits STATE
ZIP-level market 85032
- Rents YoY
- -1.5%
- Active inventory
- 337
- Price-to-rent
- 2.4×
Monthly cashflow live
- Estimated rent
- $1,208 high interval (Pro) →
- Mortgage (P&I)
- −$184
- Tax est. 1.5%
- −$44 /mo · $525/yr
- Insurance
- −$15
- HOA
- −$0
- Vacancy / Maint / Mgmt
- −$254
- Net cashflow
- $712
Break-even live
UW: 25.0% down · 7.5% · 30yr · 1.5% tax · 5.0% vac · 8.0% maint · 8.0% mgmt
Financing live
Cash to close
- Down payment
- $8,750
- Closing costs
- $1,050
- Reserves months
- —
- Total cash needed
- —
Loan-product check · same deal, 3 products live
Conventional
25% down · 7.5% · 30yr
- Down + closing
- —
- Monthly P&I
- —
- Monthly cashflow
- —
- DSCR
- —
- Eligible?
- —
Personal DTI + credit; lowest rate.
DSCR
20% down · 8.5% · 30yr
- Down + closing
- —
- Monthly P&I
- —
- Monthly cashflow
- —
- DSCR
- —
- Eligible?
- —
No personal income docs; deal must DSCR.
Hard money
10% down · 12.0% · 12mo
- Down + closing
- —
- Monthly P&I
- —
- Monthly cashflow
- —
- DSCR
- —
- Eligible?
- —
Short-term bridge; refi at stabilization.
Rent comps 25 comps
| Address | Beds | Baths | Sqft | Rent | $/sqft | DOM | Units | Dist |
|---|---|---|---|---|---|---|---|---|
| 18202 N Cave Creek Rd Phoenix, AZ | 1.0–3.0 | 1.0–2.0 | 722 | $795 | $1.10 | 4d | 7 | 0.13mi |
| 2077 E Charleston Ave Phoenix, AZ | 2.0 | 1.0 | 720 | $1,295 | $1.80 | 24d | 1 | 0.20mi |
| 17602 N Cave Creek Rd Phoenix, AZ | 2.0 | 1.0–2.0 | 650 | $1,312 | $2.02 | 2d | 13 | 0.25mi |
| 18416 N Cave Creek Rd Phoenix, AZ | 2.0 | 1.0–2.0 | 786 | $1,975 | $2.51 | 4d | 9 | 0.26mi |
| 18416 N Cave Creek Rd Unit 6 Phoenix, AZ | 1.0 | 1.0 | 748 | $1,250 | $1.67 | 7d | 1 | 0.29mi |
| 18660 N Cave Creek Rd Phoenix, AZ | 1.0–3.0 | 1.0–2.0 | 961 | $1,290 | $1.34 | 2d | 11 | 0.44mi |
| 1750 E Bell Rd Phoenix, AZ | 1.0–2.0 | 1.0 | 700 | $999 | $1.43 | 24d | 1 | 0.89mi |
| 16621 N 25th St Phoenix, AZ | 1.0 | 1.0 | 570 | $899 | $1.58 | 7d | 1 | 0.90mi |
| 2424 E Grandview Rd Phoenix, AZ | 2.0 | 1.0 | 700 | $1,159 | $1.66 | 24d | 1 | 1.01mi |
| 2424 E Grandview Rd Phoenix, AZ | 2.0 | 1.0 | 700 | $942 | $1.35 | 22d | 1 | 1.01mi |
| 2424 E Grandview Rd Phoenix, AZ | 2.0 | 1.0 | 575 | $856 | $1.49 | 4d | 6 | 1.01mi |
| 2424 E Grandview Rd Unit 107 Phoenix, AZ | 2.0 | 1.0 | 700 | $829 | $1.18 | 24d | 1 | 1.01mi |
| 2424 E Grandview Rd Unit 312 Phoenix, AZ | 1.0 | 1.0 | 550 | $856 | $1.56 | 22d | 1 | 1.01mi |
| 2424 E Grandview Rd Unit 112 Phoenix, AZ | 1.0 | 1.0 | 550 | $856 | $1.56 | 24d | 1 | 1.01mi |
| 2424 E Grandview Rd Apt 310 Phoenix, AZ | 2.0 | 1.0 | 700 | $942 | $1.35 | 24d | 1 | 1.01mi |
| 19635 N Cave Creek Rd Phoenix, AZ | 3.0 | 1.0–2.0 | 999 | $1,354 | $1.36 | 2d | 22 | 1.12mi |
| 1450 E Bell Rd Phoenix, AZ | 1.0–3.0 | 1.0–2.0 | 957 | $1,027 | $1.07 | 2d | 93 | 1.16mi |
| 2500 E Marco Polo Rd Phoenix, AZ | 2.0 | 1.0–2.0 | 918 | $1,912 | $2.08 | 2d | 16 | 1.24mi |
| 20050 N Cave Creek Rd Phoenix, AZ | 1.0–2.0 | 1.0–2.0 | 909 | $1,385 | $1.52 | 1d | 10 | 1.25mi |
| 16437 N 31st St Phoenix, AZ | 1.0–2.0 | 1.0 | 687 | $849 | $1.23 | 2d | 4 | 1.29mi |
| 16645 N 31st St Phoenix, AZ | 2.0 | 1.0 | 483 | $1,297 | $2.68 | 2d | 6 | 1.29mi |
| 2826 E Le Marche Ave Unit 102 Phoenix, AZ | 1.0 | 1.0 | 725 | $1,000 | $1.38 | 5d | 1 | 1.36mi |
| 2220 E Beardsley Rd Phoenix, AZ | 4.0 | 1.0–2.0 | 855 | $1,424 | $1.67 | 3d | 62 | 1.41mi |
| 2814 E Kathleen Rd #102 Phoenix, AZ | 1.0 | 1.0 | 700 | $950 | $1.36 | 24d | 1 | 1.47mi |
| 2837 E Marconi Ave Unit 102 Phoenix, AZ | 1.0 | 1.0 | 700 | $950 | $1.36 | 24d | 1 | 1.49mi |
Listing history 19 events
-
2026-06-18days on market $35,000 Active 104 DOM
-
2026-06-17days on market $35,000 Active 103 DOM
-
2026-06-16days on market $35,000 Active 102 DOM
-
2026-06-15days on market $35,000 Active 101 DOM
-
2026-06-13days on market $35,000 Active 99 DOM
-
2026-06-13days on market $35,000 Active 98 DOM
-
2026-06-10status $35,000 Active 95 DOM
-
2026-06-09days on market $35,000 Under Contract Accepting Backups 95 DOM
-
2026-06-08days on market $35,000 Under Contract Accepting Backups 94 DOM
-
2026-06-07statusdays on market $35,000 Under Contract Accepting Backups 93 DOM
-
2026-06-04days on market $35,000 Active 90 DOM
-
2026-06-03days on market $35,000 Active 89 DOM
-
2026-06-02days on market $35,000 Active 88 DOM
-
2026-06-01days on market $35,000 Active 87 DOM
-
2026-05-31days on market $35,000 Active 86 DOM
-
2026-05-16price $35,000 459-char remark
Show marketing remark (459 chars)
Stunning upgrades on this end lot home, in the gated, 55+ community of Paradise North! This home boasts luxury upgrades, including but not limited to a beautiful marble tiled shower, stainless steel appliances, vinyl plank flooring throughout and TWO decks (one in the front of the home and one in the back)! Enjoy meeting your neighbors at community events, or by the community pool in those warmer months! Step inside, and unwind in your beautiful new home!
-
2026-05-05price $40,000 459-char remark
Show marketing remark (459 chars)
Stunning upgrades on this end lot home, in the gated, 55+ community of Paradise North! This home boasts luxury upgrades, including but not limited to a beautiful marble tiled shower, stainless steel appliances, vinyl plank flooring throughout and TWO decks (one in the front of the home and one in the back)! Enjoy meeting your neighbors at community events, or by the community pool in those warmer months! Step inside, and unwind in your beautiful new home!
-
2026-04-09price $50,000 459-char remark
Show marketing remark (459 chars)
Stunning upgrades on this end lot home, in the gated, 55+ community of Paradise North! This home boasts luxury upgrades, including but not limited to a beautiful marble tiled shower, stainless steel appliances, vinyl plank flooring throughout and TWO decks (one in the front of the home and one in the back)! Enjoy meeting your neighbors at community events, or by the community pool in those warmer months! Step inside, and unwind in your beautiful new home!
-
2026-03-06$59,900 Active 459-char remark
Show marketing remark (459 chars)
Stunning upgrades on this end lot home, in the gated, 55+ community of Paradise North! This home boasts luxury upgrades, including but not limited to a beautiful marble tiled shower, stainless steel appliances, vinyl plank flooring throughout and TWO decks (one in the front of the home and one in the back)! Enjoy meeting your neighbors at community events, or by the community pool in those warmer months! Step inside, and unwind in your beautiful new home!
ⓘ Source: listings_history table (triggers on properties + properties_extension) + one-shot
backfill from property_details.listing_events for pre-trigger history.
Climate risk First Street
- Flood 1/10 Low FEMA zone X (shaded) · 0% chance over 30 yrs
- Wildfire 4/10 Moderate
- Heat 8/10 Severe 5 d/yr ≥110°F today · 13 d/yr by 30 yrs out
- Wind 1/10 Low
- Air quality 3/10 Moderate 3 unhealthy d/yr today · 5 by 30 yrs out
Nearby sold comps map
Loading sold comps map…
Walkable amenities ~0.75 mi
Loading nearby amenities…
Taxation est. · year 1
- Rental income
- $14,493
- − Mortgage interest
- −$1,961
- − Property taxes
- −$525
- − Insurance
- −$175
- − Repairs & maintenance
- −$1,159
- − Management
- −$1,159
- − Depreciation
- −$1,018
- Taxable income
- $8,496
- Est. tax owed @ 24.0%
- −$2,039
- After-tax cash flow
- $6,508/yr
For passive investors: Depreciation is non-cash, so a rental often shows a tax loss while cash-flowing — sheltering income. Rental losses are passive: they offset passive income freely, and up to $25,000/yr can offset ordinary (W-2) income if you actively participate and your MAGI is under $100k (phasing out to $0 by $150k); unused losses carry forward. On sale, claimed depreciation is recaptured at up to 25%, and gains may owe capital-gains tax (a 1031 exchange can defer both). Figures are a year-1 estimate at your 24.0% rate — not tax advice; consult a CPA.
Condition & rehab AI · 1 photo
This manufactured home in Paradise North is in good condition with recent upgrades, offering a move-in-ready experience with potential for further value enhancement through minor updates.
Value-add opportunities
- Both Paint exterior and interior — Fresh paint enhances curb appeal and interior aesthetics
- Resale Replace countertops — Modern countertops improve the kitchen's appearance and functionality
- Resale Install new flooring in bathrooms — New flooring in bathrooms enhances the home's overall appeal and value
Renovation cost estimate screening
Value-add ROI direction
- Both Paint exterior and interior — Fresh paint enhances curb appeal and interior aesthetics ↑
- Resale Replace countertops — Modern countertops improve the kitchen's appearance and functionality ↑
- Resale Install new flooring in bathrooms — New flooring in bathrooms enhances the home's overall appeal and value ↑
ⓘ Cost ranges are severity-bucket heuristics (US national rule-of-thumb). Get contractor quotes + a written scope before underwriting a rehab budget.
Schools (NCES district)
- District
- Paradise Valley Unified District (4241)
- NCES district ID
- 0405930
- Math proficiency
- 39% ▼ -11.00%
- Reading proficiency
- 46% ▼ -7.00%
- Median HH income
- $64,106
- Composite
- 37.89/100
- National rank
- #4316
- State rank
- #56 of 249 in AZ
Livability — Phoenix
- Score
- 75/100
- State rank
- #16
- US rank
- #3924
Category grades
Schools grade is shown separately in the Schools card above.
Census & demographics
- Census place
- Phoenix, AZ
- County
- Maricopa County · 4,537,380 people
- City population
- 1,500,198
- Metro
- Phoenix-Mesa-Chandler, AZ
- Population (ZIP)
- 70,839
- Household income
- $78,643
- Rent vs Own
- Severe rent burden
- 2887.0
Population outlook (Maricopa County) Hauer SSP2
- Today (2025)
- 4,979,203 people
- By 2030
- 5,378,229 · +8.0%
- By 2040
- 6,156,598 · +23.6%
- By 2050
- 6,872,376 · +38.0%
- By 2075
- 8,401,270 · +68.7%
- By 2100
- 9,247,439 · +85.7%
Race, ethnicity, and origin ACS 2023
- Neighborhood character
- Diverse neighborhood (Simpson 0.57)
- Race & ethnicity
- White 59% Hispanic / Latino 29% Two or more races 17% Asian 4% Black 3% Native American 2%
- Hispanic origin (detail)
- Mexican 25%
- Common ancestry
- Romanian 2% Slovak 2% Portuguese 2%
- Foreign-born
- 18% · Canada, China
- Languages at home
- 71% English-only · Spanish 21% Russian/Polish/Slavic 2% Other Indo-European 1%
Political lean MEDSL · Maricopa
- 2024 margin
- Toss-up / Even · D 47.7% · R 51.2% · Other 1.1%
- 2008→2024 swing
- +7.1pp toward D · 2008: -10.6pp · 2024: -3.5pp
- All cycles
- 2024: R+3.5 2020: D+2.2 2016: R+3.5 2012: R+12.0 2008: R+10.6
Not yet ingested
- Civics
- —
Market trends
- HPI YoY
- ▼ -488.65%
- Current HPI
- 339.4181
- Rent YoY
- ▼ -1.46%
- Metro
- Phoenix-Mesa-Chandler, AZ
- State GDP YoY
- ▲ 4.54%
- F500 in state
- 20
Industry mix (Fortune 500 HQ in AZ)
| Industry | F500 HQs | Revenue |
|---|---|---|
| Technology | 2 | $13B |
|
||
| Mining / Metals | 1 | $23B |
|
||
| Environmental Services | 1 | $16B |
|
||
| Metals / Steel | 1 | $14B |
|
||
| Technology Distribution | 1 | $9B |
|
||
| Homebuilding | 1 | $8B |
|
||
Price history
-41.6% since first listed4 events — show timeline
- 2026-05-16 Price Changed $35,000 ARMLS
- 2026-05-05 Price Changed $40,000 ARMLS
- 2026-04-09 Price Changed $50,000 ARMLS
- 2026-03-06 Listed $59,900 ARMLS
Cash-flow waterfall
monthlySold comps — $/sqft
last 12 mo · ≤1 miLoading sold comps…