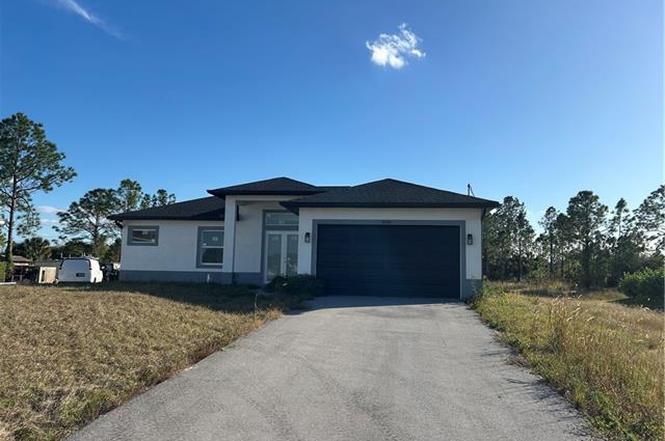
3558 60th Ave NE · Orangetree, FL
Flood risk 1/10 · Minimal
- FEMA flood zone
- X (unshaded)
- Chance of flooding over 30 yrs
- 0.0%
- Est. flood insurance / yr
- $507 – $1,088
Fire risk 5/10 · Moderate
- Est. fire insurance / yr
- $947 – $1,759
Heat risk 9/10 · Severe
- Hot days now (above 110°F)
- 7 days/yr
- Hot days in 30 yrs
- 28 days/yr
Wind risk 10/10 · Severe
- Chance of severe wind over 30 yrs
- 99.0%
Air-quality risk 2/10 · Minimal
- Unhealthy air days now
- 0 days/yr
- Unhealthy air days in 30 yrs
- 1 days/yr
Risk factors via First Street. Map © Google.
Why this score? — see what drove the F grade
The composite is a weighted blend of 9 inputs, each scored 0–100. Each bar is that input's sub-score; the figure is the points it added to the 100-point composite (weight × sub-score).
- Cash flow +8.1/30.0
- ARV discount +7.5/15.0
- Schools +5.0/10.0
- Livability +3.2/5.0
- 1% rule +2.5/10.0
- Condition / age +2.5/5.0
- DSCR +2.2/10.0
- Rent growth +2.1/5.0
- Appreciation +0.0/10.0
$400,000
🖨 Deal sheet (PDF) 📄 Offer letter ✓ Due diligence
Listing remarks
CASH ONLY SALE, HOME IS UNDER CONSTRUCTION, HOME SOLD AS IS. House is approximately 90% finished, 3 bedrooms, plus Den/office, lanai, and 2 car garage. This beautiful home features kitchen with wood cabinets, Quartz countertops, tile floor, impact resistant doors and windows. This is a must to see home. BUYER TO ASSUME THE PROJECT AND COMPLETE CONSTRUCTION AFTER CLOSING.
Key facts
- 1.14 acre lot
- 2 garage spots
- Built 2026
Property features AI
Finance
- Other: Property located in Golden Gate Estates; Approximately 1.14 acres; Lot described as suitable for horses; Paved public dead-end road access; Wooded area view; GPS directions available
- HOA & community: No HOA maintenance; Community allows horses; Non-gated community
Exterior
- Parking: Attached 2-car garage
- Security: Impact resistant doors and windows
- Utilities: Well water; Septic sewer; Electric service (central)
- Home design: Single-family residential home; Florida-style design; One story; Rear exposure faces south
- Construction: Concrete block construction; Shingle roof; Built in 2026; Surveyed lot
- Exterior features: Room for pool; Impact resistant windows and doors; Single-hung windows; Stucco exterior
Interior
- Kitchen: Kitchen with island
- Bedrooms: 3 bedrooms plus den; Split bedroom layout
- Flooring: Tile flooring
- Bathrooms: 2 full bathrooms; Master bath with shower (no tub)
- Heating & cooling: Central electric heat; Central electric cooling
- Interior features: Tray ceiling; Great room / open floor plan; Formal dining; Den / study; Open porch / lanai; Auto garage door; Washer/dryer hookup; Unfurnished; 3 ceiling fans; 6 total rooms
- Laundry & utility: Laundry in residence; Washer/dryer hookup
Neighborhood map
What this means for you Summary
Snapshot
- This is a 3-bed/2.0-bath land listed at $400k.
Deal economics
- At list price, monthly cash flow is $-385 ($-5k/yr) — negative.
- To cash-flow at today's rent, offer at most $344k (13.9% below list).
- To meet the 1% rule (rent ≥ 1% of price), the offer needs to be $301k (24.7% below list).
- Recommended offer: $301k (24.7% below list) — sets the bar for 1% rule.
Location & tenants
- Location reads 65/100 on livability (#636 in FL) — a middle-class / working-renter tenant base. Strengths: crime A+, employment A+, housing A+; Watch: health & safety D, amenities F, commute F.
- Collier (suburban): math 60% / reading 56% proficiency, ranked #16 of 73 in FL (top 22%) — acceptable for families but not a draw, mixed tenant base, ~2y average lease.
- Zoned schools: Estates Elementary School (math 70% / reading 67%, grade B+, #409 of 2,144 statewide, top 20%, 862 students, 53% FRL); Corkscrew Middle School (math 68% / reading 59%, grade B+, #109 of 571 statewide, top 19%, 958 students, 43% FRL); Palmetto Ridge High School (math 43% / reading 51%, grade D-, #207 of 667 statewide, top 32%, 2,347 students, 38% FRL).
- Market conditions: Rents soft (-1.6%/yr); 1132 active listings in the ZIP; 1 comparable units currently listed for rent nearby; solid renter incomes; 3,520 units permitted in Collier County in 2024 (959 in 5+ unit buildings).
- This rent runs 39% of the median local income ($94k/yr) — at the standard rent-burdened threshold; future hikes will face affordability resistance.
Forward outlook
- Local home prices are declining (-3.0%/yr); year-one equity from $3k of loan paydown is wiped out by about $12k of value loss. Plan a longer hold.
- Collier County population projected at +30% by 2050 — long-run rental-demand tailwind backs the buy-and-hold thesis.
Negotiation context
- It's been on market 147 days — a 12% lower offer ($352k) is reasonable based on typical stale-listing flexibility.
- 2 sale attempts since 2y ago with the ask held roughly flat each time — persistent listings suggest the price (not the market) is what's stuck; bring a comps-based counter.
- Current owner paid $14k; list at $400k implies a 2757% gain — meaningful room to come down on a strong offer.
Risks & watch-outs
- Climate carrying-cost: severe wind risk, 99% chance of damaging wind over 30y; moderate wildfire risk; extreme-heat days projected 7→28/yr by 2055 (HVAC capex compounding) — expect insurance premiums to compound above CPI over the hold.
Questions for the listing agent
- What do current leases actually rent for vs. the listed asking? Can we see a recent rent roll and the last 12 months of T-12 income?
- It's been on market 147 days. Have you received any prior offers? Is the seller open to a 25% concession, seller financing, or rate buy-down credit?
- Why hasn't it sold? Are there any deal-killer items the seller is aware of (foundation, flood, title, zoning, code violations)?
- Is there a deadline driving the sale (1031 exchange, divorce, estate, relocation)? That informs how much negotiation room exists.
- Schools are D-rated, which usually means shorter tenancies and higher turnover. Who's the typical renter profile here, and what's been the actual vacancy rate?
- The area grade is low — what's the realistic commute time and amenity access for the typical tenant pool here? Any planned neighborhood developments (good or bad) we should know about?
- What's the average days-on-market for RENTAL listings here right now (not sales)? A rising rental-DOM trend means longer vacancies and softer asking-rent achievability than the comps imply.
- What's the recent tenant-quality profile in this submarket — average credit score on applications, eviction rate, late-payment / NSF rate, and stable-employment percentage? A property-management company in the area should have these aggregated.
- How much new for-sale + rental construction is in the pipeline within 1–3 miles? Heavy new supply typically softens prices + rents 12–24 months out; constrained supply supports both.
Investment metrics
- 1% rule
- 0.75% ✗
- Cap rate
- 5.14%
- Cash-on-cash
- -4.12%
- DSCR
- 0.82
- GRM
- 11.1
CMA / ARV
No comps found within radius.
Projected returns pro-forma
-3.0% appreciation · 0.0% rent growth · sell at horizon
- IRR
- -26.6%
- Equity multiple
- 0.12×
- Total profit
- $-98,092
- Equity at exit
- $59,641
- IRR
- -38.7%
- Equity multiple
- -0.35×
- Total profit
- $-150,886
- Equity at exit
- $34,585
Cash invested: $112,000 (down + closing). Projections, not guarantees.
Landlord ↔ Tenant lean methodology
- Overall (STATE)
- 87 Strongly Landlord-Friendly
- State Florida
- 87 Strongly Landlord-Friendly · R+3
- County
- — inherits STATE
- City
- — inherits STATE
ZIP-level market 34120
- Rents YoY
- -1.6%
- Active inventory
- 1132
- Price-to-rent
- 11.1×
Monthly cashflow live
- Estimated rent
- $3,012 medium interval (Pro) →
- Mortgage (P&I)
- −$2,098
- Tax est. 1.5%
- −$500 /mo · $6,000/yr
- Insurance
- −$167
- HOA
- −$0
- Vacancy / Maint / Mgmt
- −$633
- Net cashflow
- $-385
Break-even live
Sensitivity live
| Price | -10% $-108 | -5% $-246 | +0% $-385 | +5% $-523 | +10% $-661 |
|---|---|---|---|---|---|
| Rent | -10% $-623 | -5% $-504 | +0% $-385 | +5% $-266 | +10% $-147 |
| Rate | -1.0pp $-183 | -0.5pp $-283 | base $-385 | +0.5pp $-488 | +1.0pp $-594 |
UW: 25.0% down · 7.5% · 30yr · 1.5% tax · 5.0% vac · 8.0% maint · 8.0% mgmt
Financing live
Cash to close
- Down payment
- $100,000
- Closing costs
- $12,000
- Reserves months
- —
- Total cash needed
- —
Loan-product check · same deal, 3 products live
Conventional
25% down · 7.5% · 30yr
- Down + closing
- —
- Monthly P&I
- —
- Monthly cashflow
- —
- DSCR
- —
- Eligible?
- —
Personal DTI + credit; lowest rate.
DSCR
20% down · 8.5% · 30yr
- Down + closing
- —
- Monthly P&I
- —
- Monthly cashflow
- —
- DSCR
- —
- Eligible?
- —
No personal income docs; deal must DSCR.
Hard money
10% down · 12.0% · 12mo
- Down + closing
- —
- Monthly P&I
- —
- Monthly cashflow
- —
- DSCR
- —
- Eligible?
- —
Short-term bridge; refi at stabilization.
Rent comps 1 comps
| Address | Beds | Baths | Sqft | Rent | $/sqft | DOM | Units | Dist |
|---|---|---|---|---|---|---|---|---|
| 3061 52nd Ave NE Naples, FL | 4.0 | 2.0 | 1690 | $2,990 | $1.77 | 25d | 1 | 1.14mi |
Listing history 20 events
-
2026-06-21days on market $400,000 Active 147 DOM
-
2026-06-18days on market $400,000 Active 144 DOM
-
2026-06-17days on market $400,000 Active 143 DOM
-
2026-06-16days on market $400,000 Active 142 DOM
-
2026-06-15days on market $400,000 Active 141 DOM
-
2026-06-14days on market $400,000 Active 139 DOM
-
2026-06-10days on market $400,000 Active 136 DOM
-
2026-06-09days on market $400,000 Active 135 DOM
-
2026-06-08days on market $400,000 Active 134 DOM
-
2026-06-07days on market $400,000 Active 133 DOM
-
2026-06-03days on market $400,000 Active 129 DOM
-
2026-06-02days on market $400,000 Active 128 DOM
-
2026-06-01days on market $400,000 Active 127 DOM
-
2026-05-31days on market $400,000 Active 126 DOM
-
2026-05-30days on market $400,000 Active 125 DOM
-
2026-01-25$400,000 Active
-
2024-09-12historical
-
2024-07-13price $515,000
-
2024-07-13$5,150,000 Active
-
1998-11-30soldstatus $14,000
ⓘ Source: listings_history table (triggers on properties + properties_extension) + one-shot
backfill from property_details.listing_events for pre-trigger history.
Climate risk First Street
- Flood 1/10 Low FEMA zone X (unshaded) · 0% chance over 30 yrs
- Wildfire 5/10 Major
- Heat 9/10 Extreme 7 d/yr ≥110°F today · 28 d/yr by 30 yrs out
- Wind 10/10 Extreme 99% chance of damaging wind over 30 yrs
- Air quality 2/10 Low 0 unhealthy d/yr today · 1 by 30 yrs out
Nearby sold comps map
Loading sold comps map…
Walkable amenities ~0.75 mi
Loading nearby amenities…
Taxation est. · year 1
- Rental income
- $36,148
- − Mortgage interest
- −$22,406
- − Property taxes
- −$6,000
- − Insurance
- −$2,000
- − Repairs & maintenance
- −$2,892
- − Management
- −$2,892
- − Depreciation
- −$11,636
- Taxable loss
- −$11,678
- Est. tax savings @ 24.0%
- +$2,803
- After-tax cash flow
- $-1,812/yr
For passive investors: Depreciation is non-cash, so a rental often shows a tax loss while cash-flowing — sheltering income. Rental losses are passive: they offset passive income freely, and up to $25,000/yr can offset ordinary (W-2) income if you actively participate and your MAGI is under $100k (phasing out to $0 by $150k); unused losses carry forward. On sale, claimed depreciation is recaptured at up to 25%, and gains may owe capital-gains tax (a 1031 exchange can defer both). Figures are a year-1 estimate at your 24.0% rate — not tax advice; consult a CPA.
Schools (NCES district)
- District
- Collier
- NCES district ID
- 1200330
- Math proficiency
- 60% ▼ -4.00%
- Reading proficiency
- 56% ▼ -2.00%
- Median HH income
- $58,275
- Composite
- 50.23/100
- National rank
- #1892
- State rank
- #16 of 73 in FL
Livability — Orangetree
- Score
- 65/100
- State rank
- #636
- US rank
- #12453
Category grades
Schools grade is shown separately in the Schools card above.
Census & demographics
- County
- Collier County · 396,295 people
- Metro
- Naples-Marco Island, FL
- Population (ZIP)
- 42,345
- Household income
- $93,861
- Rent vs Own
- Severe rent burden
- 409.0
Population outlook (Collier County) Hauer SSP2
- Today (2025)
- 420,858 people
- By 2030
- 450,054 · +6.9%
- By 2040
- 502,232 · +19.3%
- By 2050
- 544,932 · +29.5%
- By 2075
- 627,203 · +49.0%
- By 2100
- 659,015 · +56.6%
Race, ethnicity, and origin ACS 2023
- Neighborhood character
- Diverse neighborhood (Simpson 0.58)
- Race & ethnicity
- White 56% Hispanic / Latino 32% Two or more races 23% Black 8% Asian 2%
- Hispanic origin (detail)
- Mexican 8% Puerto Rican 2% Cuban 13%
- Common ancestry
- Hispanic 4% Romanian 3% Italian 2%
- Foreign-born
- 28% · Canada, Jamaica, China
- Languages at home
- 62% English-only · Spanish 28% French/Haitian/Cajun 5% Other Indo-European 3%
Political lean MEDSL · Collier
- 2024 margin
- Solid R (+33.1) · D 33.1% · R 66.2%
- 2008→2024 swing
- -10.6pp toward R · 2008: -22.5pp · 2024: -33.1pp
- All cycles
- 2024: R+33.1 2020: R+24.7 2016: R+26.0 2012: R+30.1 2008: R+22.5
Not yet ingested
- Civics
- —
Market trends
- HPI YoY
- ▼ -223.18%
- Current HPI
- 316.2474
- Rent YoY
- ▼ -1.65%
- Metro
- Naples-Marco Island, FL
- State GDP YoY
- ▲ 3.28%
- F500 in state
- 36
Industry mix (Fortune 500 HQ in FL)
| Industry | F500 HQs | Revenue |
|---|---|---|
| Industrial Technology | 2 | $29B |
|
||
| Insurance | 2 | $17B |
|
||
| Retail | 1 | $60B |
|
||
| Technology Distribution | 1 | $58B |
|
||
| Homebuilding | 1 | $35B |
|
||
| Technology Manufacturing | 1 | $35B |
|
||
Price history
+2757.1% since first listed5 events — show timeline
- 2026-01-25 Listed $400,000 NAPLESMLS
- 2024-09-12 Listing Removed — NAPLESMLS
- 2024-07-13 Price Changed $515,000 NAPLESMLS
- 2024-07-13 Listed $5,150,000 NAPLESMLS
- 1998-11-30 Sold (Public Records) $14,000 Public Records
Property tax history
+20.7%/yrLatest (2025): $411 · +8.8% YoY. Source: county tax records.
Cash-flow waterfall
monthlySold comps — $/sqft
last 12 mo · ≤1 miLoading sold comps…