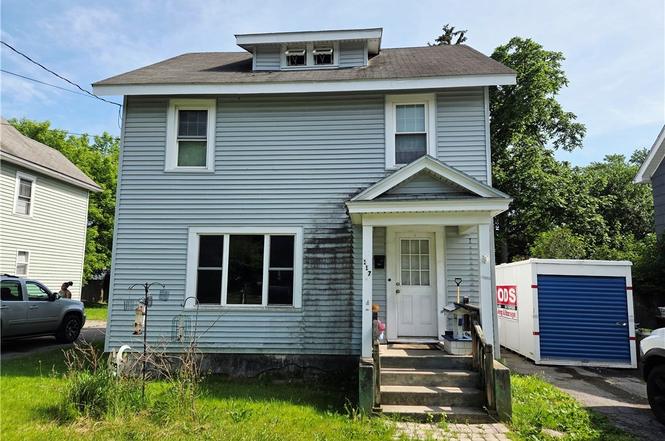
117 Everingham Rd · Nedrow, NY
Flood risk 3/10 · Minor
- FEMA flood zone
- X (unshaded)
- Chance of flooding over 30 yrs
- 0.2%
- Est. flood insurance / yr
- $473 – $860
Fire risk 1/10 · Minimal
- Est. fire insurance / yr
- $691 – $1,283
Heat risk 3/10 · Minor
- Hot days now (above 93°F)
- 7 days/yr
- Hot days in 30 yrs
- 17 days/yr
Wind risk 1/10 · Minimal
- Chance of severe wind over 30 yrs
- 1.0%
Air-quality risk 2/10 · Minimal
- Unhealthy air days now
- 0 days/yr
- Unhealthy air days in 30 yrs
- 1 days/yr
Risk factors via First Street. Map © Google.
Why this score? — see what drove the A grade
The composite is a weighted blend of 9 inputs, each scored 0–100. Each bar is that input's sub-score; the figure is the points it added to the 100-point composite (weight × sub-score).
- Cash flow +30.0/30.0
- ARV discount +15.0/15.0
- 1% rule +10.0/10.0
- DSCR +10.0/10.0
- Appreciation +10.0/10.0
- Schools +5.0/10.0
- Livability +3.6/5.0
- Rent growth +2.5/5.0
- Condition / age +2.5/5.0
$119,900
🖨 Deal sheet 📄 Offer letter ✓ Due diligence
Listing remarks
Here's your chance to build instant equity in a solid 3-bedroom, 1-bathroom home with great bones and even better potential! Whether you're an investor looking to add to your portfolio or an owner-occupant ready to roll up your sleeves and make it your own, this property is priced to reflect the opportunity. This home offers an ideal layout with a living room, formal dining room, eat-in kitchen, and a convenient quarter bath off the kitchen giving you a practical, functional floor plan to work with. The basement dry bar area is a fun bonus space just waiting to be brought back to life. A new furnace and hot water heater (both just 3 years old) mean the major mechanicals are solid. The above
Key facts
- New furnace
- Formal dining room
- New hot water heater
Tags
Property features AI
Finance
- Other: Lot is rectangular, near public transit, city street frontage
Exterior
- Parking: Detached garage (1 car)
- Utilities: Public water (connected); Sewer connected
- Home design: 3-story building; Existing construction; Vinyl siding; Block foundation
- Construction: Asphalt shingle roof; Vinyl siding construction; Block foundation; Built (existing)
- Exterior features: Covered patio/porch; Patio; Porch; Above-ground pool; Concrete driveway; Gravel driveway; Fully fenced yard; Shed(s)/storage
Interior
- Kitchen: Gas cooktop; Refrigerator; Pantry; Eat-in kitchen
- Flooring: Hardwood floors; Laminate flooring; Varied flooring
- Bathrooms: 1 full bathroom
- Heating & cooling: Gas forced-air heating
- Interior features: Dry bar; Eat-in kitchen; Pantry; Additional features — see remarks
- Laundry & utility: Washer; Dryer; Gas water heater
Neighborhood map
What this means for you Summary
Snapshot
- This is a 3-bed/1.0-bath single-family listed at $120k.
Deal economics
- At list price, monthly cash flow is $659 ($8k/yr) — positive.
- The deal already cash-flows at list — no discount required.
- Meets the 1% rule at list price ($2k rent vs $120k).
Location & tenants
- Location reads 71/100 on livability (#415 in NY) — a middle-class / working-renter tenant base. Strengths: cost of living A+, housing A+, health & safety A; Watch: employment C-, schools D, amenities F.
- Onondaga Central School District (rural): math 54% / reading 61% proficiency, ranked #261 of 590 in NY (top 44%) — acceptable for families but not a draw, mixed tenant base, ~2y average lease.
- Market conditions: 67 active listings in the ZIP; 1 comparable units currently listed for rent nearby; 616 units permitted in Onondaga County in 2024 (256 in 5+ unit buildings).
Forward outlook
- In year one you build about $13k of equity ($829 loan paydown + $12k appreciation (10.0% local appreciation)).
- Onondaga County population projected to shrink 9% by 2050 — rents likely to lag national; underwrite the cash flow, not the appreciation.
- At projected returns (10.0% appreciation + 3.0% rent growth), your $34k cash investment doubles in ~2 years — after that, you're playing with house money.
- By year 3, paydown + projected appreciation supports a ~$32k cash-out refi (75% LTV) — recoverable capital for the next deal without selling this one.
Negotiation context
- Only 1 days on market — expect competitive offers; lowballing is unlikely to land.
Risks & watch-outs
- Watch-outs: property tax is 3.2% of price; built in 1920 — expect roof / HVAC / electrical / plumbing capex.
Questions for the listing agent
- Built in 1920 — when were the roof, HVAC, electrical panel, plumbing, and water heater last replaced?
- Property tax is high relative to price — has the assessment been appealed recently, and will the sale trigger a re-assessment?
- Is there a deadline driving the sale (1031 exchange, divorce, estate, relocation)? That informs how much negotiation room exists.
- Schools are D-rated, which usually means shorter tenancies and higher turnover. Who's the typical renter profile here, and what's been the actual vacancy rate?
- What's the average days-on-market for RENTAL listings here right now (not sales)? A rising rental-DOM trend means longer vacancies and softer asking-rent achievability than the comps imply.
- What's the recent tenant-quality profile in this submarket — average credit score on applications, eviction rate, late-payment / NSF rate, and stable-employment percentage? A property-management company in the area should have these aggregated.
- How much new for-sale + rental construction is in the pipeline within 1–3 miles? Heavy new supply typically softens prices + rents 12–24 months out; constrained supply supports both.
Investment metrics
- 1% rule
- 1.75% ✓
- Cap rate
- 12.89%
- Cash-on-cash
- 23.57%
- DSCR
- 2.05
- GRM
- 4.8
CMA / ARV
- ARV (on-the-fly)
- $193,860
- Comps found
- 12
Show comp detail 12 sales within ~0.75 mi
| Address | Dist | Beds/Ba | Sqft | Sold | Price | $/sf | Match |
|---|---|---|---|---|---|---|---|
| 108 Hoover Dr | 0.04mi | 3/2.0 | 1,379 (-4%) | 8mo | $190,000 | $138 | 81 |
| 222 Hoover Dr | 0.28mi | 4/2.0 (+1) | 1,460 (+2%) | 8mo | $197,000 | $135 | 68 |
| 120 Hoover Dr | 0.08mi | 2/1.0 (-1) | 1,237 (-14%) | 2mo | $134,250 | $109 | 67 |
| 217 Hoover Dr | 0.24mi | 3/2.0 | 1,302 (-9%) | 4mo | $166,400 | $128 | 66 |
| 209 Richfield Ave | 0.47mi | 4/2.0 (+1) | 1,462 (+2%) | 1mo | $250,000 | $171 | 65 |
| 220 Hoover Dr | 0.26mi | 4/1.5 (+1) | 1,308 (-9%) | 5mo | $179,900 | $138 | 61 |
| 5572 S Salina St | 0.45mi | 3/2.0 | 1,380 (-4%) | 10mo | $273,000 | $198 | 60 |
| 119 Kenneth Ave | 0.70mi | 3/1.0 | 1,440 (+0%) | 9mo | $190,000 | $132 | 59 |
| 120 Maplewood Ave | 0.38mi | 3/1.0 | 1,221 (-15%) | 8mo | $95,000 | $78 | 50 |
| 181 Brampton Rd | 0.72mi | 3/1.0 | 1,360 (-5%) | 10mo | $190,000 | $140 | 50 |
| 132 Wendell Ave | 0.39mi | 4/2.0 (+1) | 1,300 (-10%) | 9mo | $167,500 | $129 | 49 |
| 206 Brampton Rd | 0.71mi | 3/1.5 | 1,532 (+7%) | 6mo | $177,160 | $116 | 49 |
Match score weights: distance 35% · size 25% · config 20% · recency 20%. Top-matched comps best support the ARV.
Projected returns pro-forma
10.0% appreciation · 3.0% rent growth · sell at horizon
- IRR
- 42.0%
- Equity multiple
- 4.20×
- Total profit
- $107,437
- Equity at exit
- $108,015
- IRR
- 36.3%
- Equity multiple
- 9.45×
- Total profit
- $283,629
- Equity at exit
- $232,939
Cash invested: $33,572 (down + closing). Projections, not guarantees.
Landlord ↔ Tenant lean methodology
- Overall (STATE)
- 15 Strongly Tenant-Friendly
- State New York
- 15 Strongly Tenant-Friendly · D+10
- County
- — inherits STATE
- City
- — inherits STATE
ZIP-level market 13205
- Home prices YoY
- 3.0%
- Active inventory
- 67
- Price-to-rent
- 4.8×
Monthly cashflow live
- Estimated rent
- $2,100 medium interval (Pro) →
- Mortgage (P&I)
- −$629
- Tax from tax record
- −$321 /mo · $3,850/yr
- Insurance
- −$50
- HOA
- −$0
- Vacancy / Maint / Mgmt
- −$441
- Net cashflow
- $659
Break-even live
UW: 25.0% down · 7.5% · 30yr · 1.5% tax · 5.0% vac · 8.0% maint · 8.0% mgmt
Financing live
Cash to close
- Down payment
- $29,975
- Closing costs
- $3,597
- Reserves months
- —
- Total cash needed
- —
Loan-product check · same deal, 3 products live
Conventional
25% down · 7.5% · 30yr
- Down + closing
- —
- Monthly P&I
- —
- Monthly cashflow
- —
- DSCR
- —
- Eligible?
- —
Personal DTI + credit; lowest rate.
DSCR
20% down · 8.5% · 30yr
- Down + closing
- —
- Monthly P&I
- —
- Monthly cashflow
- —
- DSCR
- —
- Eligible?
- —
No personal income docs; deal must DSCR.
Hard money
10% down · 12.0% · 12mo
- Down + closing
- —
- Monthly P&I
- —
- Monthly cashflow
- —
- DSCR
- —
- Eligible?
- —
Short-term bridge; refi at stabilization.
Rent comps 1 comps
| Address | Beds | Baths | Sqft | Rent | $/sqft | DOM | Units | Dist |
|---|---|---|---|---|---|---|---|---|
| 154 Seeley Ave Syracuse, NY | 4.0 | 1.0 | 1312 | $2,100 | $1.60 | 13d | 1 | 1.33mi |
Listing history 2 events
-
2026-06-17remarks 699-char remark
-
2026-06-17$119,900 Active 1 DOM
ⓘ Source: listings_history table (triggers on properties + properties_extension) + one-shot
backfill from property_details.listing_events for pre-trigger history.
Tax reassessment forecast NY · Partial reset (capped growth)
- Current annual tax
- $3,850 · $321/mo
- Projected year-2 tax
- $3,850 · $321/mo
- Expected delta
- $0/yr ($0/mo · -0.0%)
ⓘ Screening estimate from a state-policy table — verify with the county assessor before closing.
Climate risk First Street
- Flood 3/10 Moderate FEMA zone X (unshaded) · 20% chance over 30 yrs
- Wildfire 1/10 Low
- Heat 3/10 Moderate 7 d/yr ≥93°F today · 17 d/yr by 30 yrs out
- Wind 1/10 Low 100% chance of damaging wind over 30 yrs
- Air quality 2/10 Low 0 unhealthy d/yr today · 1 by 30 yrs out
Nearby sold comps map
Loading sold comps map…
Walkable amenities ~0.75 mi
Loading nearby amenities…
Taxation est. · year 1
- Rental income
- $25,200
- − Mortgage interest
- −$6,716
- − Property taxes
- −$3,850
- − Insurance
- −$600
- − Repairs & maintenance
- −$2,016
- − Management
- −$2,016
- − Depreciation
- −$3,488
- Taxable income
- $6,514
- Est. tax owed @ 24.0%
- −$1,563
- After-tax cash flow
- $6,350/yr
For passive investors: Depreciation is non-cash, so a rental often shows a tax loss while cash-flowing — sheltering income. Rental losses are passive: they offset passive income freely, and up to $25,000/yr can offset ordinary (W-2) income if you actively participate and your MAGI is under $100k (phasing out to $0 by $150k); unused losses carry forward. On sale, claimed depreciation is recaptured at up to 25%, and gains may owe capital-gains tax (a 1031 exchange can defer both). Figures are a year-1 estimate at your 24.0% rate — not tax advice; consult a CPA.
Schools (NCES district)
- District
- Onondaga Central School District
- NCES district ID
- 3621810
- Math proficiency
- 54% ▼ -5.00%
- Reading proficiency
- 61% ▲ 16.00%
- Median HH income
- $60,148
- Composite
- 49.95/100
- National rank
- #1929
- State rank
- #261 of 590 in NY
Livability — Nedrow
- Score
- 71/100
- State rank
- #415
- US rank
- #7218
Category grades
Schools grade is shown separately in the Schools card above.
Census & demographics
- Census place
- Nedrow, NY
- Population (ZIP)
- 18,562
Population outlook (Onondaga County) Hauer SSP2
- Today (2025)
- 467,894 people
- By 2030
- 463,381 · -1.0%
- By 2040
- 447,697 · -4.3%
- By 2050
- 426,399 · -8.9%
- By 2075
- 373,661 · -20.1%
- By 2100
- 307,967 · -34.2%
Race, ethnicity, and origin ACS 2023
- Neighborhood character
- Diverse neighborhood (Simpson 0.67)
- Race & ethnicity
- Black 44% White 37% Two or more races 10% Hispanic / Latino 6% Asian 3%
- Hispanic origin (detail)
- Puerto Rican 4%
- Common ancestry
- Romanian 2% Italian 2% Swiss 1%
- Foreign-born
- 9% · Canada, China, Vietnam
- Languages at home
- 87% English-only · Spanish 5% Arabic 1% Other Indo-European 1%
Political lean MEDSL · Onondaga
- 2024 margin
- D (+17.3) · D 58.6% · R 41.4%
- 2008→2024 swing
- -3.0pp toward R · 2008: 20.3pp · 2024: 17.3pp
- All cycles
- 2024: D+17.3 2020: D+20.6 2016: D+12.8 2012: D+21.1 2008: D+20.3
Not yet ingested
- Civics
- —
Market trends
- HPI YoY
- ▲ 10.12%
- Current HPI
- 345.8854
- Rent YoY
- —
- Metro
- —
- State GDP YoY
- ▲ 2.60%
- F500 in state
- 92
Industry mix (Fortune 500 HQ in NY)
| Industry | F500 HQs | Revenue |
|---|---|---|
| Financial Services | 10 | $950B |
|
||
| Consumer Goods | 9 | $162B |
|
||
| Insurance | 4 | $225B |
|
||
| Telecommunications | 2 | $144B |
|
||
| Pharmaceuticals | 2 | $112B |
|
||
| Media / Entertainment | 2 | $69B |
|
||
Price history
1 event — show timeline
- 2026-06-17 Listed $119,900 CNYIS
Property tax history
+3.2%/yrLatest (2025): $3,850 · +2.6% YoY. Source: county tax records.
Cash-flow waterfall
monthlySold comps — $/sqft
last 12 mo · ≤1 miLoading sold comps…