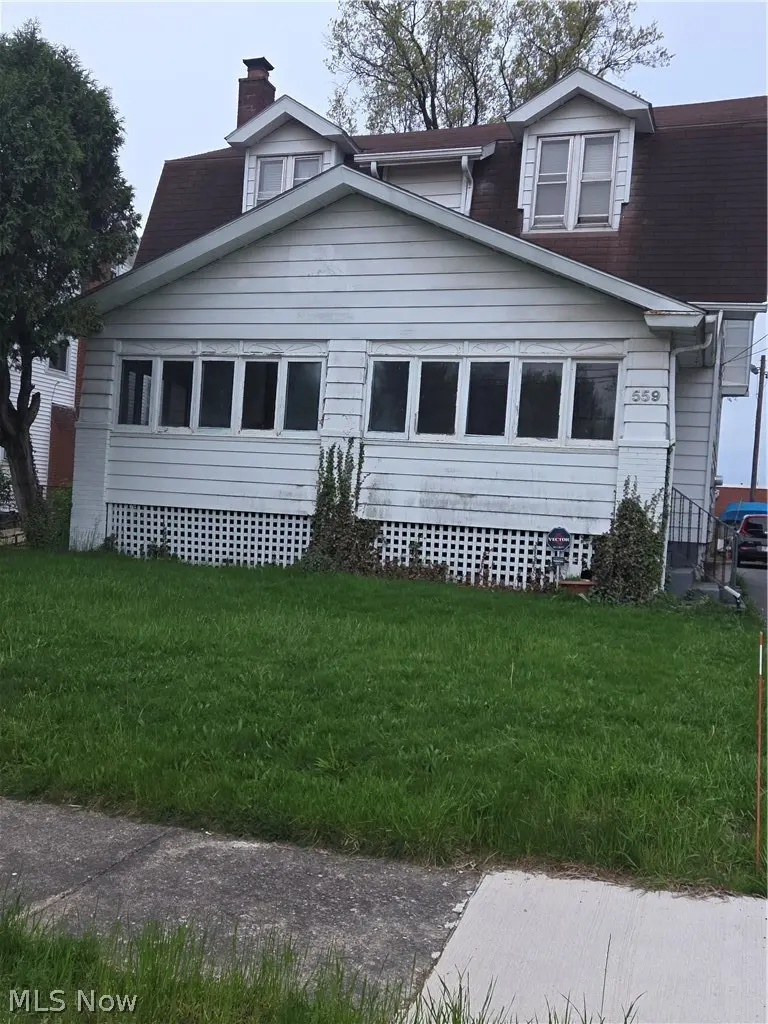
559 Redondo Rd · Youngstown, OH
Flood risk 1/10 · Minimal
- FEMA flood zone
- X (unshaded)
- Chance of flooding over 30 yrs
- 0.0%
- Est. flood insurance / yr
- $473 – $860
Fire risk 1/10 · Minimal
- Est. fire insurance / yr
- $713 – $1,323
Heat risk 3/10 · Minor
- Hot days now (above 97°F)
- 7 days/yr
- Hot days in 30 yrs
- 17 days/yr
Wind risk 1/10 · Minimal
- Chance of severe wind over 30 yrs
- —
Air-quality risk 2/10 · Minimal
- Unhealthy air days now
- 1 days/yr
- Unhealthy air days in 30 yrs
- 2 days/yr
Risk factors via First Street. Map © Google.
Why this score? — see what drove the B+ grade
The composite is a weighted blend of 9 inputs, each scored 0–100. Each bar is that input's sub-score; the figure is the points it added to the 100-point composite (weight × sub-score).
- Cash flow +30.0/30.0
- 1% rule +10.0/10.0
- DSCR +10.0/10.0
- Appreciation +8.4/10.0
- ARV discount +7.5/15.0
- Livability +4.0/5.0
- Rent growth +2.5/5.0
- Condition / age +2.5/5.0
- Schools +0.9/10.0
$59,900
🖨 Deal sheet (PDF) 📄 Offer letter ✓ Due diligence
Listing remarks
A lil TLC, some creativity & you'll make this a spacious 3 bedroom 1 bath home on the Northside with the VA services in your backyard. Home features carpeting & original hardwood trim throughout. The large enclosed front porch is a great place to relax and enjoy the neighborhood scenes. Large livingroom and diningroom with builit-ins on main floor including the Kitchen with space to add a sitting area and/or pantry. Upstairs features a full large bathroom with bonus room attached, 3 bedrooms with 2 large closets in the primary bedroom. The Basement is an open slate with great storage space, laundry area with a newer furnace and a sump pump. There's also an oversized attached 2.5
Key facts
- Open slate basement
- Large livingroom
- Great storage space
Tags
Property features AI
Finance
- HOA & community: Street lights; Sidewalks
Exterior
- Parking: Attached garage; Approximately 2.5 garage spaces
- Utilities: Public water; Public sewer
- Home design: 2-story home; Fixer condition
- Construction: Asphalt and block construction materials; Block and brick/mortar foundation; Asphalt fiberglass roof; Built in (year source: public records)
- Exterior features: Enclosed patio/porch; Front porch; Patio; Porch; Back yard; Front yard; City lot; Has view
Interior
- Kitchen: Pantry (first level)
- Bedrooms: Bedroom on second level
- Bathrooms: 1 full bathroom
- Interior features: Built-in features; Pantry; Decorative fireplace
- Laundry & utility: Laundry in basement
Neighborhood map
What this means for you Summary
Snapshot
- This is a 4-bed/1.0-bath single-family listed at $60k.
Deal economics
- At list price, monthly cash flow is $376 ($5k/yr) — positive.
- The deal already cash-flows at list — no discount required.
- Meets the 1% rule at list price ($1k rent vs $60k).
- Cap rate 13.8% vs local median 7.0% in Youngstown — top-decile yield for the area; either an underpriced asset or a hidden risk that comps aren't pricing in. Stress-test before assuming the spread holds.
Location & tenants
- Location reads 81/100 on livability (#99 in OH, #1,506 nationally) — a professional / high-income tenant draw. Strengths: amenities A+, commute A+, cost of living A+; Watch: crime F, employment F.
- Youngstown City (urban): math 8% / reading 17% proficiency, ranked #649 of 656 in OH (top 99%) — low school quality limits family demand, transient renter base, plan for 1-2y turnover; 88% free/reduced lunch — lower-income household profile, screen leases tightly.
- Market conditions: 28 active listings in the ZIP; 3 comparable units currently listed for rent nearby; rentals at typical pace (median 14d on market — plan ~3-4 weeks tenant-placement turnaround); lower-income renter base — watch delinquency; 147 units permitted in Mahoning County in 2024 (0 in 5+ unit buildings).
- This rent runs 30% of the median local income ($40k/yr) — at the standard rent-burdened threshold; future hikes will face affordability resistance.
Forward outlook
- In year one you build about $4k of equity ($414 loan paydown + $4k appreciation (6.7% local appreciation)).
- Mahoning County population projected at -14% by 2050 — secular population decline; favor cash flow + early exit over multi-decade hold.
- At projected returns (6.7% appreciation + 3.0% rent growth), your $17k cash investment doubles in ~2 years — after that, you're playing with house money.
- By year 8, paydown + projected appreciation supports a ~$35k cash-out refi (75% LTV) — recoverable capital for the next deal without selling this one.
Negotiation context
- Only 2 days on market — expect competitive offers; lowballing is unlikely to land.
- 2 sale attempts since 33y ago with the ask held roughly flat each time — persistent listings suggest the price (not the market) is what's stuck; bring a comps-based counter.
- Current owner paid $29k; list at $60k implies a 107% gain — meaningful room to come down on a strong offer.
Risks & watch-outs
- Watch-outs: built in 1924 — expect roof / HVAC / electrical / plumbing capex.
Questions for the listing agent
- Built in 1924 — when were the roof, HVAC, electrical panel, plumbing, and water heater last replaced?
- Is there a deadline driving the sale (1031 exchange, divorce, estate, relocation)? That informs how much negotiation room exists.
- Crime grade is F in this area — have there been break-ins, vandalism, or insurance claims at this property in the last 3 years? What carrier currently insures it and at what premium?
- What's the average days-on-market for RENTAL listings here right now (not sales)? A rising rental-DOM trend means longer vacancies and softer asking-rent achievability than the comps imply.
- What's the recent tenant-quality profile in this submarket — average credit score on applications, eviction rate, late-payment / NSF rate, and stable-employment percentage? A property-management company in the area should have these aggregated.
- How much new for-sale + rental construction is in the pipeline within 1–3 miles? Heavy new supply typically softens prices + rents 12–24 months out; constrained supply supports both.
Investment metrics
- 1% rule
- 1.70% ✓
- Cap rate
- 13.83%
- Cash-on-cash
- 26.90%
- DSCR
- 2.20
- GRM
- 4.9
CMA / ARV
- ARV (on-the-fly)
- $151,360
- Comps found
- 8
Show comp detail 8 sales within ~0.75 mi
| Address | Dist | Beds/Ba | Sqft | Sold | Price | $/sf | Match |
|---|---|---|---|---|---|---|---|
| 487 Carlotta Dr | 0.35mi | 3/2.5 (-1) | 1,711 (-0%) | 11mo | $145,000 | $85 | 62 |
| 1841 Goleta Ave | 0.41mi | 5/1.5 (+1) | 1,840 (+7%) | 6mo | $100,000 | $54 | 58 |
| 495 Madera Ave | 0.30mi | 3/2.0 (-1) | 1,868 (+9%) | 10mo | $176,000 | $94 | 54 |
| 2242 Cordova Ave | 0.73mi | 3/1.0 (-1) | 1,593 (-7%) | 2mo | $70,000 | $44 | 47 |
| 2314 Goleta Ave | 0.53mi | 3/1.5 (-1) | 1,599 (-7%) | 14mo | $140,000 | $88 | 45 |
| 1863 Selma Ave | 0.55mi | 5/1.5 (+1) | 1,632 (-5%) | 19mo | $170,000 | $104 | 43 |
| 437 Madera Ave | 0.38mi | 5/2.5 (+1) | 1,969 (+14%) | 9mo | $190,000 | $96 | 39 |
| 184 Wirt St | 0.75mi | 3/2.0 (-1) | 1,550 (-10%) | 13mo | $134,000 | $86 | 29 |
Match score weights: distance 35% · size 25% · config 20% · recency 20%. Top-matched comps best support the ARV.
Projected returns pro-forma
6.72% appreciation · 3.0% rent growth · sell at horizon
- IRR
- 39.3%
- Equity multiple
- 3.62×
- Total profit
- $43,869
- Equity at exit
- $40,423
- IRR
- 36.0%
- Equity multiple
- 7.54×
- Total profit
- $109,764
- Equity at exit
- $75,820
Cash invested: $16,772 (down + closing). Projections, not guarantees.
Landlord ↔ Tenant lean methodology
- Overall (STATE)
- 73 Landlord-Friendly
- State Ohio
- 73 Landlord-Friendly · R+6
- County
- — inherits STATE
- City
- — inherits STATE
ZIP-level market 44504
- Home prices YoY
- 4.0%
- Active inventory
- 28
- Price-to-rent
- 4.9×
Monthly cashflow live
- Estimated rent
- $1,018 medium interval (Pro) →
- Mortgage (P&I)
- −$314
- Tax from tax record
- −$89 /mo · $1,073/yr
- Insurance
- −$25
- HOA
- −$0
- Vacancy / Maint / Mgmt
- −$214
- Net cashflow
- $376
Break-even live
Sensitivity live
| Price | -10% $410 | -5% $393 | +0% $376 | +5% $359 | +10% $342 |
|---|---|---|---|---|---|
| Rent | -10% $296 | -5% $336 | +0% $376 | +5% $416 | +10% $456 |
| Rate | -1.0pp $406 | -0.5pp $391 | base $376 | +0.5pp $361 | +1.0pp $345 |
UW: 25.0% down · 7.5% · 30yr · 1.5% tax · 5.0% vac · 8.0% maint · 8.0% mgmt
Financing live
Cash to close
- Down payment
- $14,975
- Closing costs
- $1,797
- Reserves months
- —
- Total cash needed
- —
Loan-product check · same deal, 3 products live
Conventional
25% down · 7.5% · 30yr
- Down + closing
- —
- Monthly P&I
- —
- Monthly cashflow
- —
- DSCR
- —
- Eligible?
- —
Personal DTI + credit; lowest rate.
DSCR
20% down · 8.5% · 30yr
- Down + closing
- —
- Monthly P&I
- —
- Monthly cashflow
- —
- DSCR
- —
- Eligible?
- —
No personal income docs; deal must DSCR.
Hard money
10% down · 12.0% · 12mo
- Down + closing
- —
- Monthly P&I
- —
- Monthly cashflow
- —
- DSCR
- —
- Eligible?
- —
Short-term bridge; refi at stabilization.
Rent comps 3 comps
| Address | Beds | Baths | Sqft | Rent | $/sqft | DOM | Units | Dist |
|---|---|---|---|---|---|---|---|---|
| 171 Upland Ave Unit 171 2nd floor Youngstown, OH | 3.0 | 1.0 | 1100 | $1,040 | $0.95 | 14d | 1 | 1.04mi |
| 176 Upland Ave Unit 1 Youngstown, OH | 4.0 | 2.0 | 1300 | $1,225 | $0.94 | 44d | 1 | 1.04mi |
| 351 Lincoln Ave Youngstown, OH | 3.0–5.0 | 3.0–5.0 | 1527 | $760 | $0.50 | 14d | 10 | 1.40mi |
Listing history 4 events
-
2026-04-30status Pending
-
2026-04-28$59,900 Active
-
1994-10-14soldstatus $29,000
-
1993-10-09$31,900
ⓘ Source: listings_history table (triggers on properties + properties_extension) + one-shot
backfill from property_details.listing_events for pre-trigger history.
Tax reassessment forecast OH · Partial reset (capped growth)
- Current annual tax
- $1,073 · $89/mo
- Projected year-2 tax
- $1,073 · $89/mo
- Expected delta
- $0/yr ($0/mo · 0.0%)
ⓘ Screening estimate from a state-policy table — verify with the county assessor before closing.
Climate risk First Street
- Flood 1/10 Low FEMA zone X (unshaded) · 0% chance over 30 yrs
- Wildfire 1/10 Low
- Heat 3/10 Moderate 7 d/yr ≥97°F today · 17 d/yr by 30 yrs out
- Wind 1/10 Low
- Air quality 2/10 Low 1 unhealthy d/yr today · 2 by 30 yrs out
Nearby sold comps map
Loading sold comps map…
Walkable amenities ~0.75 mi
Loading nearby amenities…
Taxation est. · year 1
- Rental income
- $12,220
- − Mortgage interest
- −$3,355
- − Property taxes
- −$1,073
- − Insurance
- −$300
- − Repairs & maintenance
- −$978
- − Management
- −$978
- − Depreciation
- −$1,743
- Taxable income
- $3,795
- Est. tax owed @ 24.0%
- −$911
- After-tax cash flow
- $3,602/yr
For passive investors: Depreciation is non-cash, so a rental often shows a tax loss while cash-flowing — sheltering income. Rental losses are passive: they offset passive income freely, and up to $25,000/yr can offset ordinary (W-2) income if you actively participate and your MAGI is under $100k (phasing out to $0 by $150k); unused losses carry forward. On sale, claimed depreciation is recaptured at up to 25%, and gains may owe capital-gains tax (a 1031 exchange can defer both). Figures are a year-1 estimate at your 24.0% rate — not tax advice; consult a CPA.
Schools (NCES district)
- District
- Youngstown City
- NCES district ID
- 3904516
- Math proficiency
- 8% ▼ -15.00%
- Reading proficiency
- 17% ▼ -10.00%
- Median HH income
- $25,257
- Composite
- 9.29/100
- National rank
- #9858
- State rank
- #649 of 656 in OH
Livability — Youngstown
- Score
- 81/100
- State rank
- #99
- US rank
- #1506
Category grades
Schools grade is shown separately in the Schools card above.
Census & demographics
- Census place
- Youngstown, OH
- County
- Mahoning · 224,175 people
- City population
- 28,503
- Metro
- Youngstown-Warren, OH
- Population (ZIP)
- 5,185
- Household income
- $40,156
- Rent vs Own
- Severe rent burden
- 15.7
Population outlook (Mahoning County) Hauer SSP2
- Today (2025)
- 223,932 people
- By 2030
- 218,387 · -2.5%
- By 2040
- 205,367 · -8.3%
- By 2050
- 193,606 · -13.5%
- By 2075
- 173,694 · -22.4%
- By 2100
- 151,147 · -32.5%
Race, ethnicity, and origin ACS 2023
- Neighborhood character
- Diverse neighborhood (Simpson 0.65)
- Race & ethnicity
- White 45% Black 38% Two or more races 8% Asian 5% Hispanic / Latino 4%
- Common ancestry
- Italian 4% Serbian 1% Romanian 1%
- Foreign-born
- 7% · Canada, Dominican Republic, South Korea
- Languages at home
- 93% English-only · Other Indo-European 4% Spanish 1%
Political lean MEDSL · Mahoning
- 2024 margin
- Lean R (+9.4) · D 44.9% · R 54.4%
- 2008→2024 swing
- -36.1pp toward R · 2008: 26.6pp · 2024: -9.4pp
- All cycles
- 2024: R+9.4 2020: R+1.9 2016: D+3.0 2012: D+27.7 2008: D+26.6
Not yet ingested
- Civics
- —
Market trends
- HPI YoY
- ▲ 6.72%
- Current HPI
- 174.9495
- Rent YoY
- —
- Metro
- —
- State GDP YoY
- ▲ 1.98%
- F500 in state
- 48
Industry mix (Fortune 500 HQ in OH)
| Industry | F500 HQs | Revenue |
|---|---|---|
| Insurance | 3 | $145B |
|
||
| Industrial Machinery | 3 | $49B |
|
||
| Financial Services | 3 | $24B |
|
||
| Consumer Goods | 2 | $93B |
|
||
| Aerospace / Defense | 2 | $47B |
|
||
| Utilities | 2 | $33B |
|
||
Price history
+87.8% since first listed4 events — show timeline
- 2026-04-30 Pending — MLSNOW
- 2026-04-28 Listed $59,900 MLSNOW
- 1994-10-14 Sold (Public Records) $29,000 Public Records
- 1993-10-09 Listed $31,900 MLSNOW
Property tax history
+77.1%/yrLatest (2025): $1,073 · -11.9% YoY. Source: county tax records.
Cash-flow waterfall
monthlySold comps — $/sqft
last 12 mo · ≤1 miLoading sold comps…