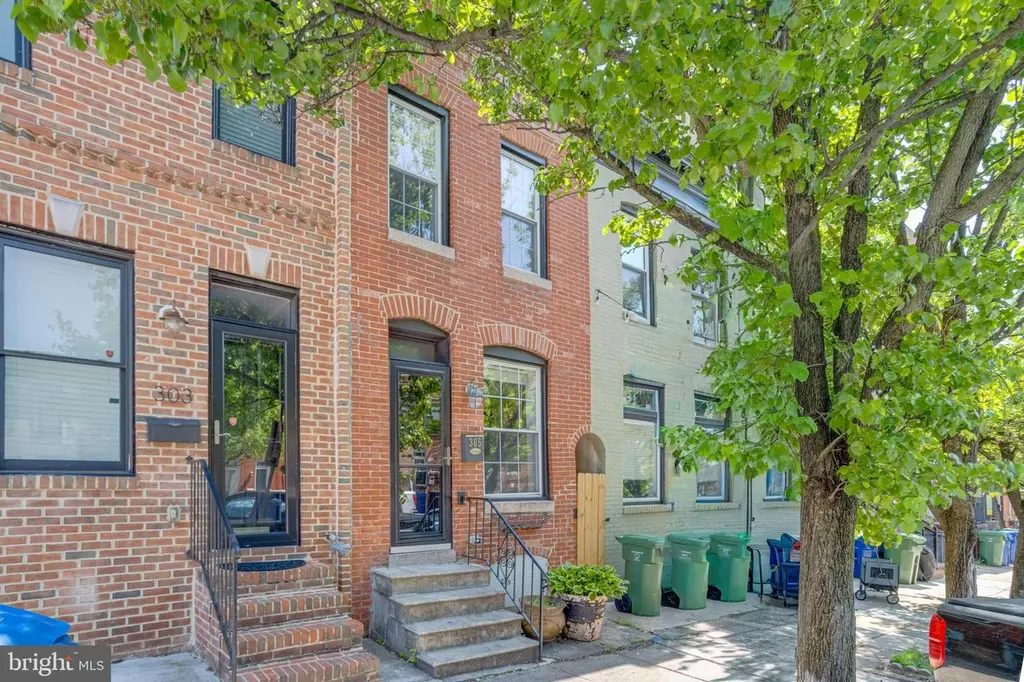
305 S Collington Ave · Baltimore, MD
Flood risk 1/10 · Minimal
- FEMA flood zone
- X (unshaded)
- Chance of flooding over 30 yrs
- 0.0%
- Est. flood insurance / yr
- $473 – $860
Fire risk 1/10 · Minimal
- Est. fire insurance / yr
- $755 – $1,403
Heat risk 8/10 · Major
- Hot days now (above 103°F)
- 7 days/yr
- Hot days in 30 yrs
- 15 days/yr
Wind risk 6/10 · Moderate
- Chance of severe wind over 30 yrs
- 27.0%
Air-quality risk 4/10 · Minor
- Unhealthy air days now
- 6 days/yr
- Unhealthy air days in 30 yrs
- 7 days/yr
Risk factors via First Street. Map © Google.
Why this score? — see what drove the D grade
The composite is a weighted blend of 9 inputs, each scored 0–100. Each bar is that input's sub-score; the figure is the points it added to the 100-point composite (weight × sub-score).
- ARV discount +15.0/15.0
- Cash flow +9.8/30.0
- 1% rule +4.3/10.0
- Livability +3.8/5.0
- Rent growth +3.1/5.0
- DSCR +2.8/10.0
- Condition / age +2.5/5.0
- Schools +1.0/10.0
- Appreciation +0.0/10.0
$289,900
🖨 Deal sheet 📄 Offer letter ✓ Due diligence
Listing remarks
“Beautiful 3-bedroom, 2 full bath, 1 half bath home located within walking distance to a wide variety of dining and entertainment options. This home offers everything you need, featuring spacious living areas, modern finishes, and a convenient, vibrant location perfect for everyday living and entertaining. ”
Key facts
- Built 1910
- Listed 10 days
Property features AI
Finance
- Financial info: Fee simple ownership
Exterior
- Parking: Off-street parking; On-street parking
- Utilities: Public water; Public sewer; Electric service
- Home design: Interior townhouse/rowhouse; Brick construction
- Construction: Brick foundation (brick/mortar); Above-grade and below-grade structures; Year built per assessor
- Exterior features: Property is in city limits
Interior
- Bedrooms: Three bedrooms on the first upper level
- Bathrooms: Two full bathrooms; One half bathroom
- Heating & cooling: Central heating (electric); Central air conditioning with ceiling fans; Electric hot water
- Interior features: Assessor-listed living area; No basement
Neighborhood map
What this means for you Summary
Snapshot
- This is a 3-bed/2.5-bath townhouse listed at $290k.
Deal economics
- At list price, monthly cash flow is $-187 ($-2k/yr) — negative.
- To cash-flow at today's rent, offer at most $257k (11.4% below list).
- To meet the 1% rule (rent ≥ 1% of price), the offer needs to be $269k (7.3% below list).
- Recommended offer: $257k (11.4% below list) — sets the bar for cash-flow.
Location & tenants
- Location reads 76/100 on livability (#90 in MD, #3,396 nationally) — a middle-class / working-renter tenant base. Strengths: amenities A+, commute A+, housing A+; Watch: schools D, crime F.
- Baltimore City Public Schools (urban): math 7% / reading 16% proficiency, ranked #24 of 24 in MD (top 100%) — low school quality limits family demand, transient renter base, plan for 1-2y turnover; 79% free/reduced lunch — lower-income household profile, screen leases tightly.
- Market conditions: Rents rising (+2.3%/yr); 131 active listings in the ZIP; 40 comparable units currently listed for rent nearby; rentals at typical pace (median 24d on market — plan ~3-4 weeks tenant-placement turnaround); 42% of comp listings sitting > 30 days — soft ceiling on asking rent; solid renter incomes; 1,273 units permitted in Baltimore city in 2024 (1,104 in 5+ unit buildings).
- This rent runs 38% of the median local income ($85k/yr) — at the standard rent-burdened threshold; future hikes will face affordability resistance.
Forward outlook
- Local home prices are declining (-3.0%/yr); year-one equity from $2k of loan paydown is wiped out by about $9k of value loss. Plan a longer hold.
- Baltimore County population projected to shrink 4% by 2050 — rents likely to lag national; underwrite the cash flow, not the appreciation.
Negotiation context
- Only 10 days on market — expect competitive offers; lowballing is unlikely to land.
- 12 sale attempts since 24y ago with the ask held roughly flat each time — persistent listings suggest the price (not the market) is what's stuck; bring a comps-based counter.
- Current owner paid $220k; 32% above their basis — modest negotiation headroom, anchor on the comps not their cost.
Risks & watch-outs
- Watch-outs: property tax is 2.8% of price; built in 1910 — expect roof / HVAC / electrical / plumbing capex.
- Climate carrying-cost: major wind risk, 27% chance of damaging wind over 30y; extreme-heat days projected 7→15/yr by 2055 (HVAC capex compounding) — expect insurance premiums to compound above CPI over the hold.
Questions for the listing agent
- What do current leases actually rent for vs. the listed asking? Can we see a recent rent roll and the last 12 months of T-12 income?
- Built in 1910 — when were the roof, HVAC, electrical panel, plumbing, and water heater last replaced?
- Property tax is high relative to price — has the assessment been appealed recently, and will the sale trigger a re-assessment?
- Is there a deadline driving the sale (1031 exchange, divorce, estate, relocation)? That informs how much negotiation room exists.
- Schools are D-rated, which usually means shorter tenancies and higher turnover. Who's the typical renter profile here, and what's been the actual vacancy rate?
- Crime grade is F in this area — have there been break-ins, vandalism, or insurance claims at this property in the last 3 years? What carrier currently insures it and at what premium?
- The area grade is low — what's the realistic commute time and amenity access for the typical tenant pool here? Any planned neighborhood developments (good or bad) we should know about?
- What's the average days-on-market for RENTAL listings here right now (not sales)? A rising rental-DOM trend means longer vacancies and softer asking-rent achievability than the comps imply.
- What's the recent tenant-quality profile in this submarket — average credit score on applications, eviction rate, late-payment / NSF rate, and stable-employment percentage? A property-management company in the area should have these aggregated.
- How much new for-sale + rental construction is in the pipeline within 1–3 miles? Heavy new supply typically softens prices + rents 12–24 months out; constrained supply supports both.
Investment metrics
- 1% rule
- 0.93% ✗
- Cap rate
- 5.52%
- Cash-on-cash
- -2.77%
- DSCR
- 0.88
- GRM
- 9.0
CMA / ARV
- ARV (median comp)
- $396,494
- List price
- $289,900
- Delta
- -26.88%
- Verdict
- UNDERPRICED
- Comps
- 20 within 1.0 mi
Show comp detail 12 sales within ~0.75 mi
| Address | Dist | Beds/Ba | Sqft | Sold | Price | $/sf | Match |
|---|---|---|---|---|---|---|---|
| 2038 E Pratt St | 0.17mi | 3/3.0 | 2,227 (+11%) | 0mo | $570,000 | $256 | 71 |
| 633 S Linwood Ave S | 0.59mi | 3/2.5 | 1,935 (-3%) | 0mo | $351,000 | $181 | 66 |
| 37 S Washington St | 0.29mi | 2/2.5 (-1) | 2,180 (+9%) | 1mo | $360,000 | $165 | 66 |
| 24 S Regester St | 0.44mi | 3/3.5 | 2,118 (+6%) | 0mo | $437,500 | $207 | 66 |
| 21 S Linwood Ave | 0.59mi | 3/2.5 | 1,912 (-5%) | 0mo | $490,000 | $256 | 65 |
| 426 S Eden St | 0.69mi | 3/3.0 | 2,155 (+8%) | 1mo | $325,000 | $151 | 52 |
| 804 S Glover St | 0.48mi | 2/3.0 (-1) | 1,776 (-11%) | 1mo | $405,000 | $228 | 51 |
| 802 S Potomac St | 0.69mi | 3/3.0 | 1,755 (-12%) | 0mo | $435,000 | $248 | 45 |
| 1400 Lancaster St #901 | 0.69mi | 2/2.5 (-1) | 1,781 (-11%) | 1mo | $629,000 | $353 | 44 |
| 38 S Curley St | 0.60mi | 3/1.0 | 1,729 (-14%) | 0mo | $181,100 | $105 | 42 |
| 532 N Luzerne Ave | 0.73mi | 4/3.5 (+1) | 2,172 (+8%) | 0mo | $255,000 | $117 | 42 |
| 730 S Decker Ave | 0.70mi | 4/3.5 (+1) | 1,740 (-13%) | 0mo | $564,900 | $325 | 36 |
Match score weights: distance 35% · size 25% · config 20% · recency 20%. Top-matched comps best support the ARV.
Projected returns pro-forma
-3.0% appreciation · 2.26% rent growth · sell at horizon
- IRR
- -21.8%
- Equity multiple
- 0.25×
- Total profit
- $-60,668
- Equity at exit
- $43,225
- IRR
- -17.5%
- Equity multiple
- 0.07×
- Total profit
- $-75,295
- Equity at exit
- $25,065
Cash invested: $81,172 (down + closing). Projections, not guarantees.
Landlord ↔ Tenant lean methodology
- Overall (CITY)
- 12 Strongly Tenant-Friendly
- State Maryland
- 27 Tenant-Leaning · D+14
- County
- — inherits STATE
- City Baltimore
- 12 Strongly Tenant-Friendly · D+58
ZIP-level market 21231
- Rents YoY
- 2.3%
- Active inventory
- 131
- Price-to-rent
- 9.0×
Monthly cashflow live
- Estimated rent
- $2,686 high interval (Pro) →
- Mortgage (P&I)
- −$1,520
- Tax from tax record
- −$668 /mo · $8,020/yr
- Insurance
- −$121
- HOA
- −$0
- Vacancy / Maint / Mgmt
- −$564
- Net cashflow
- $-187
Break-even live
UW: 25.0% down · 7.5% · 30yr · 1.5% tax · 5.0% vac · 8.0% maint · 8.0% mgmt
Financing live
Cash to close
- Down payment
- $72,475
- Closing costs
- $8,697
- Reserves months
- —
- Total cash needed
- —
Loan-product check · same deal, 3 products live
Conventional
25% down · 7.5% · 30yr
- Down + closing
- —
- Monthly P&I
- —
- Monthly cashflow
- —
- DSCR
- —
- Eligible?
- —
Personal DTI + credit; lowest rate.
DSCR
20% down · 8.5% · 30yr
- Down + closing
- —
- Monthly P&I
- —
- Monthly cashflow
- —
- DSCR
- —
- Eligible?
- —
No personal income docs; deal must DSCR.
Hard money
10% down · 12.0% · 12mo
- Down + closing
- —
- Monthly P&I
- —
- Monthly cashflow
- —
- DSCR
- —
- Eligible?
- —
Short-term bridge; refi at stabilization.
Rent comps 40 comps
| Address | Beds | Baths | Sqft | Rent | $/sqft | DOM | Units | Dist |
|---|---|---|---|---|---|---|---|---|
| 250 S Washington St Baltimore, MD | 4.0 | 3.5 | 2261 | $2,595 | $1.15 | 23d | 1 | 0.17mi |
| 513 S Chester St Baltimore, MD | 4.0 | 4.5 | 1534 | $3,000 | $1.96 | 17d | 1 | 0.18mi |
| 1904 Bank St Baltimore, MD | 3.0 | 3.5 | 1792 | $3,250 | $1.81 | 43d | 1 | 0.23mi |
| 2217 Fleet St Baltimore, MD | 3.0 | 2.0 | 1598 | $2,700 | $1.69 | 10d | 1 | 0.23mi |
| 1911 Eastern Ave Baltimore, MD | 4.0 | 4.0 | 1520 | $2,600 | $1.71 | 23d | 1 | 0.26mi |
| 2013 Fleet St Baltimore, MD | 3.0 | 2.5 | 1565 | $3,100 | $1.98 | 12d | 1 | 0.26mi |
| 1901 E Lombard St Baltimore, MD | 2.0 | 1.0 | 2054 | $2,200 | $1.07 | 44d | 1 | 0.28mi |
| 2210 Cambridge St Baltimore, MD | 3.0 | 3.5 | 1450 | $2,725 | $1.88 | 43d | 1 | 0.28mi |
| 2206 E Baltimore St Baltimore, MD | 3.0 | 2.5 | 2612 | $2,900 | $1.11 | 21d | 1 | 0.28mi |
| 1818 E Pratt St Apt A Baltimore, MD | 3.0 | 2.5 | 1736 | $2,500 | $1.44 | 17d | 1 | 0.29mi |
| 2313 Foster Ave Baltimore, MD | 3.0 | 2.5 | 1974 | $2,900 | $1.47 | 43d | 1 | 0.33mi |
| 2115 E Fairmount Ave Baltimore, MD | 3.0 | 2.5 | 1736 | $2,795 | $1.61 | 23d | 1 | 0.33mi |
| 2015 E Fairmount Ave Baltimore, MD | 3.0 | 3.5 | 1402 | $2,500 | $1.78 | 43d | 1 | 0.36mi |
| 14 S Ann St Baltimore, MD | 3.0 | 2.5 | 2850 | $2,550 | $0.89 | 11d | 1 | 0.38mi |
| 107 N Chester St Unit 2 Baltimore, MD | 3.0 | 1.0 | 1750 | $2,750 | $1.57 | 43d | 1 | 0.39mi |
| 141 N Patterson Park Ave Baltimore, MD | 3.0 | 3.5 | 2264 | $2,300 | $1.02 | 43d | 1 | 0.42mi |
| 143 N Patterson Park Ave Baltimore, MD | 4.0 | 3.5 | 1650 | $3,700 | $2.24 | 23d | 1 | 0.42mi |
| 1726 Aliceanna St Baltimore, MD | 2.0 | 2.5 | 2300 | $3,000 | $1.30 | 23d | 1 | 0.42mi |
| 2200 E Fayette St Unit 2 2ND FLOOR Baltimore, MD | 2.0 | 1.0 | 2205 | $1,500 | $0.68 | 43d | 1 | 0.44mi |
| 2209 Mullikin St Baltimore, MD | 3.0 | 2.5 | 1512 | $1,900 | $1.26 | 3d | 1 | 0.46mi |
| 622 S Broadway Baltimore, MD | 2.0 | 1.0–2.0 | 953 | $2,998 | $3.14 | 1d | 8 | 0.50mi |
| 2040 Orleans St Baltimore, MD | 4.0 | 1.5 | 1974 | $2,100 | $1.06 | 14d | 1 | 0.53mi |
| 430 S Bond St Baltimore, MD | 3.0 | 2.5 | 1842 | $2,875 | $1.56 | 17d | 1 | 0.54mi |
| 602 S Streeper St Baltimore, MD | 4.0 | 3.0 | 1980 | $3,200 | $1.62 | 23d | 1 | 0.54mi |
| 2619 E Fayette St Baltimore, MD | 3.0 | 2.0 | 1600 | $1,900 | $1.19 | 43d | 1 | 0.56mi |
| 227 N Rose St Baltimore, MD | 2.0 | 4.0 | 1420 | $1,600 | $1.13 | 23d | 1 | 0.56mi |
| 706 S Bethel St Baltimore, MD | 3.0 | 2.0 | 1500 | $3,300 | $2.20 | 43d | 1 | 0.56mi |
| 10 N Streeper St Baltimore, MD | 3.0 | 2.5 | 1440 | $2,500 | $1.74 | 23d | 1 | 0.58mi |
| 233 N Luzerne Ave Baltimore, MD | 3.0 | 2.5 | 1700 | $2,250 | $1.32 | 21d | 1 | 0.58mi |
| 11 N Streeper St Baltimore, MD | 3.0 | 3.5 | 1800 | $2,600 | $1.44 | 43d | 1 | 0.59mi |
| 104 N Dallas St Baltimore, MD | 3.0 | 2.5 | 1584 | $2,500 | $1.58 | 21d | 1 | 0.65mi |
| 2431 McElderry St Baltimore, MD | 4.0 | 2.5 | 1600 | $2,100 | $1.31 | 43d | 1 | 0.68mi |
| 424 S Eden St Baltimore, MD | 4.0 | 3.5 | 1830 | $3,200 | $1.75 | 23d | 1 | 0.69mi |
| 2800 Orleans St Baltimore, MD | 3.0 | 1.0 | 1404 | $1,600 | $1.14 | 14d | 1 | 0.72mi |
| 2800 Orleans St Baltimore, MD | 3.0 | 1.0 | 1404 | $1,600 | $1.14 | 17d | 1 | 0.72mi |
| 300 S Robinson St Baltimore, MD | 4.0 | 3.5 | 2604 | $3,500 | $1.34 | 43d | 1 | 0.72mi |
| 539 N Luzerne Ave Baltimore, MD | 3.0 | 2.5 | 1702 | $2,300 | $1.35 | 43d | 1 | 0.72mi |
| 622 S Ellwood Ave Baltimore, MD | 3.0 | 2.0 | 1906 | $2,800 | $1.47 | 43d | 1 | 0.73mi |
| 10 N Ellwood Ave Baltimore, MD | 4.0 | 2.5 | 1768 | $2,500 | $1.41 | 43d | 1 | 0.74mi |
| 127 S Robinson St Baltimore, MD | 2.0 | 1.5 | 1400 | $2,000 | $1.43 | 43d | 1 | 0.75mi |
Listing history 38 events
-
2026-06-18days on market $289,900 Active 10 DOM
-
2026-06-17days on market $289,900 Active 9 DOM
-
2026-06-16days on market $289,900 Active 8 DOM
-
2026-06-15days on market $289,900 Active 7 DOM
-
2026-06-13days on market $289,900 Active 5 DOM
-
2026-06-08days on market $289,900 Active 1 DOM
-
2026-06-01days on market $289,900 Active 28 DOM
-
2026-05-31days on market $289,900 Active 27 DOM
-
2026-05-15status Pending 321-char remark
-
2026-05-12price $289,900 321-char remark
-
2026-04-27$299,900 Active 321-char remark
-
2024-12-23historical $2,600
-
2024-11-24$2,600
-
2024-11-19historical $2,600
-
2024-10-10soldstatus $220,000
-
2024-10-02price $2,600
-
2024-09-21historical $2,700
-
2024-09-21$2,700
-
2024-09-20$2,700
-
2024-07-08historical
-
2024-07-03price $291,000
-
2024-06-20price $309,900
-
2024-06-13price $319,900
-
2024-06-07$329,900 Active
-
2007-09-12historical
-
2007-09-12price
-
2007-08-08
-
2006-10-12historical
-
2006-08-30
-
2005-07-07soldstatus $286,000
-
2005-06-09soldstatus $287,500
-
2005-05-04historical
-
2005-02-18$269,900
-
2002-09-11soldstatus $85,000
-
2002-09-06soldstatus $85,000
-
2002-08-29historical
-
2002-07-23$89,900
-
1988-06-17soldstatus $29,500
ⓘ Source: listings_history table (triggers on properties + properties_extension) + one-shot
backfill from property_details.listing_events for pre-trigger history.
Tax reassessment forecast MD · Partial reset (capped growth)
- Current annual tax
- $8,020 · $668/mo
- Projected year-2 tax
- $8,020 · $668/mo
- Expected delta
- $0/yr ($0/mo · 0.0%)
ⓘ Screening estimate from a state-policy table — verify with the county assessor before closing.
Climate risk First Street
- Flood 1/10 Low FEMA zone X (unshaded) · 0% chance over 30 yrs
- Wildfire 1/10 Low
- Heat 8/10 Severe 7 d/yr ≥103°F today · 15 d/yr by 30 yrs out
- Wind 6/10 Major 27% chance of damaging wind over 30 yrs
- Air quality 4/10 Moderate 6 unhealthy d/yr today · 7 by 30 yrs out
Nearby sold comps map
Loading sold comps map…
Walkable amenities ~0.75 mi
Loading nearby amenities…
Taxation est. · year 1
- Rental income
- $32,233
- − Mortgage interest
- −$16,239
- − Property taxes
- −$8,020
- − Insurance
- −$1,450
- − Repairs & maintenance
- −$2,579
- − Management
- −$2,579
- − Depreciation
- −$8,433
- Taxable loss
- −$7,066
- Est. tax savings @ 24.0%
- +$1,696
- After-tax cash flow
- $-553/yr
For passive investors: Depreciation is non-cash, so a rental often shows a tax loss while cash-flowing — sheltering income. Rental losses are passive: they offset passive income freely, and up to $25,000/yr can offset ordinary (W-2) income if you actively participate and your MAGI is under $100k (phasing out to $0 by $150k); unused losses carry forward. On sale, claimed depreciation is recaptured at up to 25%, and gains may owe capital-gains tax (a 1031 exchange can defer both). Figures are a year-1 estimate at your 24.0% rate — not tax advice; consult a CPA.
Schools (NCES district)
- District
- Baltimore City Public Schools
- NCES district ID
- 2400090
- Math proficiency
- 7% ▼ -9.00%
- Reading proficiency
- 16% ▼ -5.00%
- Median HH income
- $42,108
- Composite
- 10.08/100
- National rank
- #9805
- State rank
- #24 of 24 in MD
Livability — Baltimore
- Score
- 76/100
- State rank
- #90
- US rank
- #3396
Category grades
Schools grade is shown separately in the Schools card above.
Census & demographics
- Census place
- Baltimore, MD
- County
- Baltimore City · 558,601 people
- City population
- 588,727
- Metro
- Baltimore-Columbia-Towson, MD
- Population (ZIP)
- 14,969
- Household income
- $85,254
- Rent vs Own
- Severe rent burden
- 1147.0
Population outlook (Baltimore County) Hauer SSP2
- Today (2025)
- 624,249 people
- By 2030
- 621,541 · -0.4%
- By 2040
- 609,756 · -2.3%
- By 2050
- 597,249 · -4.3%
- By 2075
- 552,236 · -11.5%
- By 2100
- 513,934 · -17.7%
Race, ethnicity, and origin ACS 2023
- Neighborhood character
- Diverse neighborhood (Simpson 0.62)
- Race & ethnicity
- White 53% Black 29% Hispanic / Latino 9% Two or more races 7% Asian 4%
- Hispanic origin (detail)
- Mexican 3% Puerto Rican 1%
- Common ancestry
- Romanian 6% Slovak 2% Lithuanian 2%
- Foreign-born
- 10% · Canada, China, South Korea
- Languages at home
- 85% English-only · Spanish 6% Other Indo-European 2% Russian/Polish/Slavic 1%
Political lean MEDSL · Baltimore
- 2024 margin
- Solid D (+73.0) · D 85.2% · R 12.2% · Other 2.6%
- 2008→2024 swing
- -2.5pp toward R · 2008: 75.5pp · 2024: 73.0pp
- All cycles
- 2024: D+73.0 2020: D+76.6 2016: D+74.6 2012: D+76.4 2008: D+75.5
Not yet ingested
- Civics
- —
Market trends
- HPI YoY
- ▼ -545.26%
- Current HPI
- 351.3778
- Rent YoY
- ▲ 2.26%
- Metro
- Baltimore-Columbia-Towson, MD
- State GDP YoY
- ▲ 2.97%
- F500 in state
- 12
Industry mix (Fortune 500 HQ in MD)
| Industry | F500 HQs | Revenue |
|---|---|---|
| Aerospace / Defense | 1 | $71B |
|
||
| Utilities | 1 | $25B |
|
||
| Hotels | 1 | $24B |
|
||
| Consumer Goods | 1 | $7B |
|
||
| Real Estate | 1 | $6B |
|
||
| Chemicals | 1 | $2B |
|
||
Price history
-90.9% since first listed35 events — show timeline
- 2026-06-17 Price Changed $2,695 APPFOLIO
- 2026-06-08 Listed $289,900 BRIGHT MLS
- 2026-06-02 Listing Removed — BRIGHT MLS
- 2026-05-24 Listed for Rent $2,895 APPFOLIO
- 2026-05-22 Relisted — BRIGHT MLS
- 2026-05-15 Pending — BRIGHT MLS
- 2026-05-12 Price Changed $289,900 BRIGHT MLS
- 2026-04-27 Listed $299,900 BRIGHT MLS
- 2024-12-23 Rental Removed $2,600 RENTSPREE
- 2024-11-24 Listed for Rent $2,600 RENTSPREE
- 2024-11-19 Rental Removed $2,600 BRIGHTMLS
- 2024-10-10 Sold (Public Records) $220,000 Public Records
- 2024-10-02 Price Changed $2,600 BRIGHTMLS
- 2024-09-21 Rental Removed $2,700 RENTSPREE
- 2024-09-21 Listed for Rent $2,700 BRIGHTMLS
- 2024-09-20 Listed for Rent $2,700 RENTSPREE
- 2024-07-08 Listing Removed — BRIGHT MLS
- 2024-07-03 Price Changed $291,000 BRIGHT MLS
- 2024-06-20 Price Changed $309,900 BRIGHT MLS
- 2024-06-13 Price Changed $319,900 BRIGHT MLS
- 2024-06-07 Listed $329,900 BRIGHT MLS
- 2007-09-12 Delisted — MRIS
- 2007-09-12 Price Changed — MRIS
- 2007-08-08 Listed — MRIS
- 2006-10-12 Delisted — MRIS
- 2006-08-30 Listed — MRIS
- 2005-07-07 Sold (Public Records) $286,000 Public Records
- 2005-06-09 Sold (MLS) $287,500 MRIS
- 2005-05-04 Delisted — MRIS
- 2005-02-18 Listed $269,900 MRIS
- 2002-09-11 Sold (Public Records) $85,000 Public Records
- 2002-09-06 Sold (MLS) $85,000 MRIS
- 2002-08-29 Delisted — MRIS
- 2002-07-23 Listed $89,900 MRIS
- 1988-06-17 Sold (Public Records) $29,500 Public Records
Property tax history
+0.6%/yrLatest (2025): $8,020 · +4.5% YoY. Source: county tax records.
Cash-flow waterfall
monthlySold comps — $/sqft
last 12 mo · ≤1 miLoading sold comps…