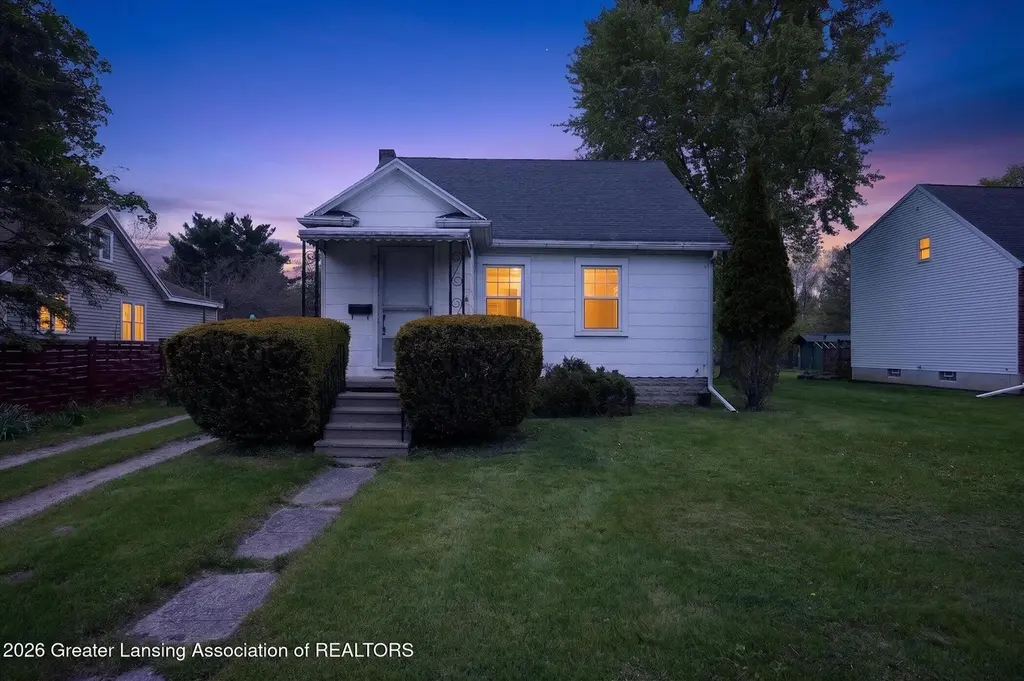
501 High St · Williamston, MI
Flood risk 1/10 · Minimal
- FEMA flood zone
- X (unshaded)
- Chance of flooding over 30 yrs
- 0.0%
- Est. flood insurance / yr
- $507 – $1,088
Fire risk 1/10 · Minimal
- Est. fire insurance / yr
- $784 – $1,456
Heat risk 2/10 · Minimal
- Hot days now (above 97°F)
- 7 days/yr
- Hot days in 30 yrs
- 15 days/yr
Wind risk 2/10 · Minimal
- Chance of severe wind over 30 yrs
- —
Air-quality risk 2/10 · Minimal
- Unhealthy air days now
- 1 days/yr
- Unhealthy air days in 30 yrs
- 2 days/yr
Risk factors via First Street. Map © Google.
Why this score? — see what drove the B- grade
The composite is a weighted blend of 9 inputs, each scored 0–100. Each bar is that input's sub-score; the figure is the points it added to the 100-point composite (weight × sub-score).
- Cash flow +24.9/30.0
- ARV discount +12.6/15.0
- DSCR +8.1/10.0
- 1% rule +6.8/10.0
- Schools +5.0/10.0
- Livability +4.3/5.0
- Rent growth +2.5/5.0
- Condition / age +2.5/5.0
- Appreciation +0.0/10.0
$180,000
🖨 Deal sheet 📄 Offer letter ✓ Due diligence
Listing remarks MLS
This downtown charmer on a river front lot has tons of potential! Charming plaster walls with coved ceilings and archways, foyer with coat closet, vinyl windows, Central Air, established grape vines, 2 car garage and shed with an extra deep lot off of the Red Cedar River. Walk to town and the park! There is work needed her but it can be a great opportunity to build some equity. Property is being sold for cash due to an active leak in the roof that could make financing difficult.
Key facts
- River front lot
- Vinyl windows
- Plaster walls
Tags
Property features AI
Exterior
- Parking: Detached garage with garage door opener
- Utilities: Public sewer; Fuses for electric; Water connected; Sewer connected; Natural gas connected; Electricity connected
- Home design: One and one half levels; Built in 1947; City street frontage
- Construction: Shingle siding; Block foundation
- Exterior features: Back yard; Waterfront frontage on a river; Double pane windows; Shingle roof; Shed(s)
Interior
- Kitchen: Microwave; Oven; Range; Refrigerator
- Bedrooms: Primary bedroom; Two additional bedrooms (total 3 bedrooms)
- Flooring: Carpet; Hardwood; Vinyl
- Bathrooms: 1 full bathroom
- Heating & cooling: Forced air heating; Central air conditioning
- Interior features: Entrance foyer; Cove ceilings in living room; Full block basement
- Laundry & utility: Laundry located in basement
Neighborhood map
What this means for you Summary
Snapshot
- This is a 3-bed/1.0-bath single-family listed at $180k.
Deal economics
- At list price, monthly cash flow is $386 ($5k/yr) — positive.
- The deal already cash-flows at list — no discount required.
- Meets the 1% rule at list price ($2k rent vs $180k).
Location & tenants
- Location reads 86/100 on livability (#19 in MI, #359 nationally) — a professional / high-income tenant draw. Strengths: crime A+, employment A+, cost of living A+; Watch: amenities D-, health & safety D-.
- Williamston Community Schools (town): math 49% / reading 62% proficiency, ranked #55 of 540 in MI (top 10%) — acceptable for families but not a draw, mixed tenant base, ~2y average lease; only 16% free/reduced lunch — higher-income household profile.
- Market conditions: 59 active listings in the ZIP; 2 comparable units currently listed for rent nearby; 350 units permitted in Ingham County in 2024 (186 in 5+ unit buildings).
Forward outlook
- Local home prices are declining (-3.0%/yr); year-one equity from $1k of loan paydown is wiped out by about $5k of value loss. Plan a longer hold.
- Ingham County population projected at +11% by 2050 — modest demand growth; plan on rents tracking national, not racing it.
Negotiation context
- Only 11 days on market — expect competitive offers; lowballing is unlikely to land.
- 2 sale attempts with the ask held roughly flat each time — persistent listings suggest the price (not the market) is what's stuck; bring a comps-based counter.
Risks & watch-outs
- Watch-outs: built in 1947 — expect roof / HVAC / electrical / plumbing capex.
Questions for the listing agent
- Built in 1947 — when were the roof, HVAC, electrical panel, plumbing, and water heater last replaced?
- Is there a deadline driving the sale (1031 exchange, divorce, estate, relocation)? That informs how much negotiation room exists.
- Schools are B-rated — typically a magnet for longer-tenancy family renters. What's the average tenant stay here, and is there a school-zone premium baked into asking?
- What's the average days-on-market for RENTAL listings here right now (not sales)? A rising rental-DOM trend means longer vacancies and softer asking-rent achievability than the comps imply.
- What's the recent tenant-quality profile in this submarket — average credit score on applications, eviction rate, late-payment / NSF rate, and stable-employment percentage? A property-management company in the area should have these aggregated.
- How much new for-sale + rental construction is in the pipeline within 1–3 miles? Heavy new supply typically softens prices + rents 12–24 months out; constrained supply supports both.
Investment metrics
- 1% rule
- 1.18% ✓
- Cap rate
- 8.87%
- Cash-on-cash
- 9.19%
- DSCR
- 1.41
- GRM
- 7.0
CMA / ARV
- ARV (on-the-fly)
- $202,797
- Comps found
- 12
Show comp detail 12 sales within ~0.75 mi
| Address | Dist | Beds/Ba | Sqft | Sold | Price | $/sf | Match |
|---|---|---|---|---|---|---|---|
| 501 High St | 0.00mi | 3/1.0 | 1,073 (0%) | 0mo | $180,000 | $168 | 100 |
| 407 S Cedar St | 0.32mi | 3/1.0 | 1,120 (+4%) | 1mo | $210,000 | $188 | 78 |
| 607 E Riverside St | 0.26mi | 2/1.0 (-1) | 1,060 (-1%) | 10mo | $230,000 | $217 | 73 |
| 310 Crossman St | 0.21mi | 2/2.0 (-1) | 1,083 (+1%) | 16mo | $230,000 | $212 | 67 |
| 216 S Cedar St | 0.25mi | 2/1.0 (-1) | 1,025 (-4%) | 11mo | $185,000 | $180 | 66 |
| 112 Jackson St | 0.43mi | 3/1.5 | 1,072 (-0%) | 15mo | $202,500 | $189 | 66 |
| 621 E Church St | 0.35mi | 2/1.0 (-1) | 1,056 (-2%) | 13mo | $245,000 | $232 | 66 |
| 638 Irving St | 0.42mi | 2/1.0 (-1) | 1,096 (+2%) | 17mo | $176,200 | $161 | 58 |
| 302 E Grand River Ave | 0.13mi | 2/1.5 (-1) | 1,200 (+12%) | 18mo | $252,000 | $210 | 52 |
| 2260 E E Grand Riv | 0.28mi | 3/1.0 | 945 (-12%) | 20mo | $105,501 | $112 | 51 |
| 825 S Putnam St | 0.56mi | 2/1.0 (-1) | 992 (-8%) | 11mo | $225,000 | $227 | 47 |
| 1818 Harvey Dr | 0.72mi | 3/1.0 | 1,144 (+7%) | 16mo | $210,000 | $184 | 42 |
Match score weights: distance 35% · size 25% · config 20% · recency 20%. Top-matched comps best support the ARV.
Projected returns pro-forma
-3.0% appreciation · 3.0% rent growth · sell at horizon
- IRR
- -2.4%
- Equity multiple
- 0.91×
- Total profit
- $-4,511
- Equity at exit
- $26,839
- IRR
- 7.4%
- Equity multiple
- 1.56×
- Total profit
- $28,001
- Equity at exit
- $15,563
Cash invested: $50,400 (down + closing). Projections, not guarantees.
Landlord ↔ Tenant lean methodology
- Overall (STATE)
- 62 Landlord-Friendly
- State Michigan
- 62 Landlord-Friendly · EVEN
- County
- — inherits STATE
- City
- — inherits STATE
ZIP-level market 48895
- Active inventory
- 59
- Price-to-rent
- 7.0×
Monthly cashflow live
- Estimated rent
- $2,130 medium interval (Pro) →
- Mortgage (P&I)
- −$944
- Tax from tax record
- −$278 /mo · $3,333/yr
- Insurance
- −$75
- HOA
- −$0
- Vacancy / Maint / Mgmt
- −$447
- Net cashflow
- $386
Break-even live
UW: 25.0% down · 7.5% · 30yr · 1.5% tax · 5.0% vac · 8.0% maint · 8.0% mgmt
Financing live
Cash to close
- Down payment
- $45,000
- Closing costs
- $5,400
- Reserves months
- —
- Total cash needed
- —
Loan-product check · same deal, 3 products live
Conventional
25% down · 7.5% · 30yr
- Down + closing
- —
- Monthly P&I
- —
- Monthly cashflow
- —
- DSCR
- —
- Eligible?
- —
Personal DTI + credit; lowest rate.
DSCR
20% down · 8.5% · 30yr
- Down + closing
- —
- Monthly P&I
- —
- Monthly cashflow
- —
- DSCR
- —
- Eligible?
- —
No personal income docs; deal must DSCR.
Hard money
10% down · 12.0% · 12mo
- Down + closing
- —
- Monthly P&I
- —
- Monthly cashflow
- —
- DSCR
- —
- Eligible?
- —
Short-term bridge; refi at stabilization.
Rent comps 2 comps
| Address | Beds | Baths | Sqft | Rent | $/sqft | DOM | Units | Dist |
|---|---|---|---|---|---|---|---|---|
| 123 E Riverside St Williamston, MI | 3.0 | 2.0 | 1292 | $1,975 | $1.53 | 13d | 1 | 0.38mi |
| 2155 Mitchell Rd Williamston, MI | 3.0 | 2.0 | 1492 | $2,530 | $1.70 | 13d | 1 | 0.85mi |
Listing history 2 events
-
2026-05-16$180,000 Active
Show marketing remark (483 chars)
This downtown charmer on a river front lot has tons of potential! Charming plaster walls with coved ceilings and archways, foyer with coat closet, vinyl windows, Central Air, established grape vines, 2 car garage and shed with an extra deep lot off of the Red Cedar River. Walk to town and the park! There is work needed her but it can be a great opportunity to build some equity. Property is being sold for cash due to an active leak in the roof that could make financing difficult.
-
2026-05-16$180,000 Active 483-char remark
Show marketing remark (483 chars)
This downtown charmer on a river front lot has tons of potential! Charming plaster walls with coved ceilings and archways, foyer with coat closet, vinyl windows, Central Air, established grape vines, 2 car garage and shed with an extra deep lot off of the Red Cedar River. Walk to town and the park! There is work needed her but it can be a great opportunity to build some equity. Property is being sold for cash due to an active leak in the roof that could make financing difficult.
ⓘ Source: listings_history table (triggers on properties + properties_extension) + one-shot
backfill from property_details.listing_events for pre-trigger history.
Tax reassessment forecast MI · Partial reset (capped growth)
- Current annual tax
- $3,333 · $278/mo
- Projected year-2 tax
- $3,333 · $278/mo
- Expected delta
- $0/yr ($0/mo · 0.0%)
ⓘ Screening estimate from a state-policy table — verify with the county assessor before closing.
Climate risk First Street
- Flood 1/10 Low FEMA zone X (unshaded) · 0% chance over 30 yrs
- Wildfire 1/10 Low
- Heat 2/10 Low 7 d/yr ≥97°F today · 15 d/yr by 30 yrs out
- Wind 2/10 Low
- Air quality 2/10 Low 1 unhealthy d/yr today · 2 by 30 yrs out
Nearby sold comps map
Loading sold comps map…
Walkable amenities ~0.75 mi
Loading nearby amenities…
Taxation est. · year 1
- Rental income
- $25,561
- − Mortgage interest
- −$10,083
- − Property taxes
- −$3,333
- − Insurance
- −$900
- − Repairs & maintenance
- −$2,045
- − Management
- −$2,045
- − Depreciation
- −$5,236
- Taxable income
- $1,920
- Est. tax owed @ 24.0%
- −$461
- After-tax cash flow
- $4,173/yr
For passive investors: Depreciation is non-cash, so a rental often shows a tax loss while cash-flowing — sheltering income. Rental losses are passive: they offset passive income freely, and up to $25,000/yr can offset ordinary (W-2) income if you actively participate and your MAGI is under $100k (phasing out to $0 by $150k); unused losses carry forward. On sale, claimed depreciation is recaptured at up to 25%, and gains may owe capital-gains tax (a 1031 exchange can defer both). Figures are a year-1 estimate at your 24.0% rate — not tax advice; consult a CPA.
Schools (NCES district)
- District
- Williamston Community Schools
- NCES district ID
- 2636420
- Math proficiency
- 49% ▼ -15.00%
- Reading proficiency
- 62% ▼ -8.00%
- Median HH income
- $79,113
- Composite
- 50.08/100
- National rank
- #1909
- State rank
- #55 of 540 in MI
Livability — Williamston
- Score
- 86/100
- State rank
- #19
- US rank
- #359
Category grades
Schools grade is shown separately in the Schools card above.
Census & demographics
- Census place
- Williamston, MI
- City population
- 11,294
- Population (ZIP)
- 11,294
Population outlook (Ingham County) Hauer SSP2
- Today (2025)
- 300,362 people
- By 2030
- 307,808 · +2.5%
- By 2040
- 320,492 · +6.7%
- By 2050
- 333,223 · +10.9%
- By 2075
- 373,693 · +24.4%
- By 2100
- 392,021 · +30.5%
Race, ethnicity, and origin ACS 2023
- Neighborhood character
- Predominantly White (93%)
- Race & ethnicity
- White 93% Two or more races 3% Hispanic / Latino 3%
- Common ancestry
- Italian 7% Romanian 6% Lithuanian 5%
- Foreign-born
- 1%
- Languages at home
- 97% English-only · Spanish 1% French/Haitian/Cajun 1% German/W. Germanic 1%
Political lean MEDSL · Ingham
- 2024 margin
- Strong D (+29.7) · D 63.9% · R 34.2% · Other 2.0%
- 2008→2024 swing
- -3.6pp toward R · 2008: 33.3pp · 2024: 29.7pp
- All cycles
- 2024: D+29.7 2020: D+32.2 2016: D+27.6 2012: D+27.9 2008: D+33.3
Not yet ingested
- Civics
- —
Market trends
- HPI YoY
- ▼ -175.37%
- Current HPI
- 202.0808
- Rent YoY
- —
- Metro
- —
- State GDP YoY
- ▲ 1.37%
- F500 in state
- 28
Industry mix (Fortune 500 HQ in MI)
| Industry | F500 HQs | Revenue |
|---|---|---|
| Automotive Parts | 3 | $48B |
|
||
| Automotive | 2 | $372B |
|
||
| Chemicals | 1 | $45B |
|
||
| Automotive Retail | 1 | $29B |
|
||
| Healthcare / Medical Devices | 1 | $23B |
|
||
| Automotive Technology | 1 | $20B |
|
||
Price history
+0.0% since first listed2 events — show timeline
- 2026-05-16 Listed $180,000 REALCOMP
- 2026-05-16 Listed $180,000 Greater Lansing AoR
Property tax history
+3.0%/yrLatest (2025): $3,333 · +2.9% YoY. Source: county tax records.
Cash-flow waterfall
monthlySold comps — $/sqft
last 12 mo · ≤1 miLoading sold comps…