195 Laurinton Farms Dr · Hopkins, SC
Flood risk No data
- FEMA flood zone
- —
- Chance of flooding over 30 yrs
- —
- Est. flood insurance / yr
- —
Fire risk No data
- Est. fire insurance / yr
- —
Heat risk No data
- Hot days now (above threshold)
- —
- Hot days in 30 yrs
- —
Wind risk No data
- Chance of severe wind over 30 yrs
- —
Air-quality risk No data
- Unhealthy air days now
- —
- Unhealthy air days in 30 yrs
- —
Risk factors via First Street. Map © Google.
Why this score? — see what drove the D+ grade
The composite is a weighted blend of 9 inputs, each scored 0–100. Each bar is that input's sub-score; the figure is the points it added to the 100-point composite (weight × sub-score).
- Cash flow +19.9/30.0
- ARV discount +7.5/15.0
- DSCR +6.3/10.0
- 1% rule +5.6/10.0
- Livability +3.0/5.0
- Schools +2.6/10.0
- Rent growth +2.5/5.0
- Condition / age +2.5/5.0
- Appreciation +0.0/10.0
$205,000
🖨 Deal sheet (PDF) 📄 Offer letter ✓ Due diligence
Listing remarks
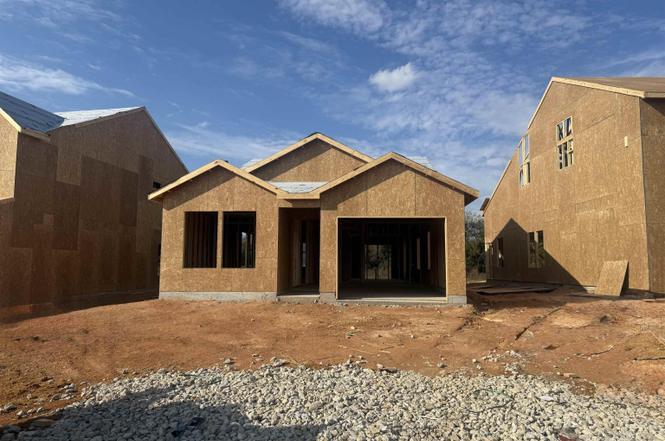
* Get up to $15K in closing cost with our partner lender plus blinds and fridge!! The Baker plan is a welcoming ranch-style home that offers thoughtful design and comfortable living. This three-bedroom, two-bathroom layout features a cozy great room with a boxed ceiling and a bright eat-in area, making it ideal for both relaxing and entertaining. Durable luxury vinyl plank flooring flows through the main living spaces, while the bedrooms are carpeted for added comfort. The kitchen includes a spacious island with Dallas white granite countertops, stone gray cabinetry, and a stainless-steel electric cooktop, combining style and functionality. Whether you're downsizing, right-sizing, or just s
Key facts
- Eat-in area
- Spacious island
- Ranch-style home
Tags
Neighborhood map
What this means for you Summary
Snapshot
- This is a 3-bed/2.0-bath single-family listed at $205k.
Deal economics
- At list price, monthly cash flow is $249 ($3k/yr) — positive.
- The deal already cash-flows at list — no discount required.
- Meets the 1% rule at list price ($2k rent vs $205k).
- Recommended offer: $193k (6.0% below list) — sets the bar for market timing.
Location & tenants
- Location reads 59/100 on livability (#238 in SC) — a working-class tenant base; expect higher turnover. Strengths: cost of living A+, crime B+, housing B; Watch: employment D+, amenities F, commute F.
- Richland 01 (urban): math 26% / reading 36% proficiency, ranked #54 of 80 in SC (top 68%) — families likely to look elsewhere, expect single-tenant / working-renter base with shorter leases; 64% free/reduced lunch — lower-income household profile, screen leases tightly.
- Zoned schools: Horrell Hill Elementary (math 17% / reading 17%, grade F, #515 of 597 statewide, top 89%, 562 students, 100% FRL); Lower Richland High (math 5% / reading 64%, grade F, #185 of 196 statewide, top 94%, 1,244 students, 100% FRL) — zoned schools average 100% FRL vs 64% district-wide (36 pts higher); higher-poverty schools than district average — tighter screening recommended.
- Market conditions: 328 active listings in the ZIP; 2 comparable units currently listed for rent nearby; 3,472 units permitted in Richland County in 2024 (1,096 in 5+ unit buildings).
- This rent runs 43% of the median local income ($60k/yr) — at the standard rent-burdened threshold; future hikes will face affordability resistance.
Forward outlook
- Local home prices are declining (-3.0%/yr); year-one equity from $1k of loan paydown is wiped out by about $6k of value loss. Plan a longer hold.
- Richland County population projected at +30% by 2050 — long-run rental-demand tailwind backs the buy-and-hold thesis.
Negotiation context
- It's been on market 71 days — a 6% lower offer ($193k) is reasonable based on typical stale-listing flexibility.
- 2 sale attempts; this cycle's ask has dropped $19k (9%) from the opening price — seller is motivated, your offer sets the floor, not the list.
Questions for the listing agent
- It's been on market 71 days. Have you received any prior offers? Is the seller open to a 6% concession, seller financing, or rate buy-down credit?
- What does the HOA fee cover, when was the last increase, and are there any pending special assessments or reserve-fund shortfalls?
- Why hasn't it sold? Are there any deal-killer items the seller is aware of (foundation, flood, title, zoning, code violations)?
- Is there a deadline driving the sale (1031 exchange, divorce, estate, relocation)? That informs how much negotiation room exists.
- Schools are F-rated, which usually means shorter tenancies and higher turnover. Who's the typical renter profile here, and what's been the actual vacancy rate?
- The area grade is low — what's the realistic commute time and amenity access for the typical tenant pool here? Any planned neighborhood developments (good or bad) we should know about?
- What's the average days-on-market for RENTAL listings here right now (not sales)? A rising rental-DOM trend means longer vacancies and softer asking-rent achievability than the comps imply.
- What's the recent tenant-quality profile in this submarket — average credit score on applications, eviction rate, late-payment / NSF rate, and stable-employment percentage? A property-management company in the area should have these aggregated.
- How much new for-sale + rental construction is in the pipeline within 1–3 miles? Heavy new supply typically softens prices + rents 12–24 months out; constrained supply supports both.
Investment metrics
- 1% rule
- 1.06% ✓
- Cap rate
- 7.75%
- Cash-on-cash
- 5.21%
- DSCR
- 1.23
- GRM
- 7.9
CMA / ARV
No comps found within radius.
Projected returns pro-forma
-3.0% appreciation · 3.0% rent growth · sell at horizon
- IRR
- -8.2%
- Equity multiple
- 0.70×
- Total profit
- $-17,289
- Equity at exit
- $30,566
- IRR
- 1.4%
- Equity multiple
- 1.10×
- Total profit
- $5,623
- Equity at exit
- $17,725
Cash invested: $57,400 (down + closing). Projections, not guarantees.
Landlord ↔ Tenant lean methodology
- Overall (STATE)
- 90 Strongly Landlord-Friendly
- State South Carolina
- 90 Strongly Landlord-Friendly · R+6
- County
- — inherits STATE
- City
- — inherits STATE
ZIP-level market 29061
- Home prices YoY
- -22.8%
- Active inventory
- 328
- Price-to-rent
- 7.9×
Monthly cashflow live
- Estimated rent
- $2,164 medium interval (Pro) →
- Mortgage (P&I)
- −$1,075
- Tax est. 1.5%
- −$256 /mo · $3,075/yr
- Insurance
- −$85
- HOA
- −$44
- Vacancy / Maint / Mgmt
- −$455
- Net cashflow
- $249
Break-even live
Sensitivity live
| Price | -10% $391 | -5% $320 | +0% $249 | +5% $178 | +10% $108 |
|---|---|---|---|---|---|
| Rent | -10% $78 | -5% $164 | +0% $249 | +5% $335 | +10% $420 |
| Rate | -1.0pp $352 | -0.5pp $301 | base $249 | +0.5pp $196 | +1.0pp $142 |
UW: 25.0% down · 7.5% · 30yr · 1.5% tax · 5.0% vac · 8.0% maint · 8.0% mgmt
Financing live
Cash to close
- Down payment
- $51,250
- Closing costs
- $6,150
- Reserves months
- —
- Total cash needed
- —
Loan-product check · same deal, 3 products live
Conventional
25% down · 7.5% · 30yr
- Down + closing
- —
- Monthly P&I
- —
- Monthly cashflow
- —
- DSCR
- —
- Eligible?
- —
Personal DTI + credit; lowest rate.
DSCR
20% down · 8.5% · 30yr
- Down + closing
- —
- Monthly P&I
- —
- Monthly cashflow
- —
- DSCR
- —
- Eligible?
- —
No personal income docs; deal must DSCR.
Hard money
10% down · 12.0% · 12mo
- Down + closing
- —
- Monthly P&I
- —
- Monthly cashflow
- —
- DSCR
- —
- Eligible?
- —
Short-term bridge; refi at stabilization.
Rent comps 2 comps
| Address | Beds | Baths | Sqft | Rent | $/sqft | DOM | Units | Dist |
|---|---|---|---|---|---|---|---|---|
| 345 Bevington Brook Ln Hopkins, SC | 3.0 | 2.0 | 1475 | $2,195 | $1.49 | 24d | 1 | 1.01mi |
| 455 Hunters Crossing Dr Hopkins, SC | 3.0 | 2.0 | 1381 | $1,699 | $1.23 | 14d | 1 | 1.06mi |
HOA detail
- Monthly dues
- $44 · $528/yr
- Likely covers
- electric
Listing history 6 events
-
2026-01-03status Pending
-
2025-12-23status Active
-
2025-12-22status Pending
-
2025-12-13price $205,000
-
2025-11-06price $215,000
-
2025-10-23$224,383 Active
ⓘ Source: listings_history table (triggers on properties + properties_extension) + one-shot
backfill from property_details.listing_events for pre-trigger history.
Nearby sold comps map
Loading sold comps map…
Walkable amenities ~0.75 mi
Loading nearby amenities…
Taxation est. · year 1
- Rental income
- $25,973
- − Mortgage interest
- −$11,483
- − Property taxes
- −$3,075
- − Insurance
- −$1,025
- − Repairs & maintenance
- −$2,078
- − Management
- −$2,078
- − HOA
- −$528
- − Depreciation
- −$5,964
- Taxable loss
- −$258
- Est. tax savings @ 24.0%
- +$62
- After-tax cash flow
- $3,052/yr
For passive investors: Depreciation is non-cash, so a rental often shows a tax loss while cash-flowing — sheltering income. Rental losses are passive: they offset passive income freely, and up to $25,000/yr can offset ordinary (W-2) income if you actively participate and your MAGI is under $100k (phasing out to $0 by $150k); unused losses carry forward. On sale, claimed depreciation is recaptured at up to 25%, and gains may owe capital-gains tax (a 1031 exchange can defer both). Figures are a year-1 estimate at your 24.0% rate — not tax advice; consult a CPA.
Schools (NCES district)
- District
- Richland 01
- NCES district ID
- 4503360
- Math proficiency
- 26% ▼ -7.00%
- Reading proficiency
- 36% ▼ -5.00%
- Median HH income
- $38,931
- Composite
- 25.94/100
- National rank
- #7335
- State rank
- #54 of 80 in SC
Livability — Hopkins
- Score
- 59/100
- State rank
- #238
- US rank
- #19825
Category grades
Schools grade is shown separately in the Schools card above.
Census & demographics
- County
- Richland County · 389,530 people
- City population
- 12,538
- Metro
- Columbia, SC
- Population (ZIP)
- 12,538
- Household income
- $60,307
- Rent vs Own
- Severe rent burden
- 236.0
Population outlook (Richland County) Hauer SSP2
- Today (2025)
- 459,667 people
- By 2030
- 487,524 · +6.1%
- By 2040
- 542,035 · +17.9%
- By 2050
- 595,371 · +29.5%
- By 2075
- 732,998 · +59.5%
- By 2100
- 820,415 · +78.5%
Race, ethnicity, and origin ACS 2023
- Neighborhood character
- Predominantly Black (68%)
- Race & ethnicity
- Black 68% White 23% Two or more races 6% Hispanic / Latino 4%
- Common ancestry
- Italian 1% Lithuanian 1% Romanian 1%
- Foreign-born
- 3% · Canada
- Languages at home
- 96% English-only · Spanish 3%
Political lean MEDSL · Richland
- 2024 margin
- Solid D (+34.6) · D 66.4% · R 31.8% · Other 1.8%
- 2008→2024 swing
- +5.7pp toward D · 2008: 28.9pp · 2024: 34.6pp
- All cycles
- 2024: D+34.6 2020: D+38.3 2016: D+32.9 2012: D+33.3 2008: D+28.9
Not yet ingested
- Civics
- —
Market trends
- HPI YoY
- ▼ -57.44%
- Current HPI
- 194.8986
- Rent YoY
- —
- Metro
- Columbia, SC
- State GDP YoY
- ▲ 4.51%
- F500 in state
- 2
Industry mix (Fortune 500 HQ in SC)
| Industry | F500 HQs | Revenue |
|---|---|---|
| Packaging | 1 | $7B |
|
||
Price history
-8.6% since first listed6 events — show timeline
- 2026-01-03 Pending — Consolidated MLS
- 2025-12-23 Relisted — Consolidated MLS
- 2025-12-22 Pending — Consolidated MLS
- 2025-12-13 Price Changed $205,000 Consolidated MLS
- 2025-11-06 Price Changed $215,000 Consolidated MLS
- 2025-10-23 Listed $224,383 Consolidated MLS
Cash-flow waterfall
monthlySold comps — $/sqft
last 12 mo · ≤1 miLoading sold comps…