7965 State Route 52 Lot 31 · Lake Huntington, NY
Flood risk 1/10 · Minimal
- FEMA flood zone
- X (unshaded)
- Chance of flooding over 30 yrs
- 0.0%
- Est. flood insurance / yr
- $473 – $860
Fire risk 3/10 · Minor
- Est. fire insurance / yr
- $691 – $1,283
Heat risk 2/10 · Minimal
- Hot days now (above 92°F)
- 7 days/yr
- Hot days in 30 yrs
- 15 days/yr
Wind risk 2/10 · Minimal
- Chance of severe wind over 30 yrs
- 2.0%
Air-quality risk 2/10 · Minimal
- Unhealthy air days now
- 1 days/yr
- Unhealthy air days in 30 yrs
- 1 days/yr
Risk factors via First Street. Map © Google.
Why this score? — see what drove the D grade
The composite is a weighted blend of 9 inputs, each scored 0–100. Each bar is that input's sub-score; the figure is the points it added to the 100-point composite (weight × sub-score).
- Appreciation +10.0/10.0
- 1% rule +7.5/10.0
- ARV discount +7.5/15.0
- Schools +4.0/10.0
- Cash flow +3.8/30.0
- Rent growth +2.5/5.0
- Livability +2.5/5.0
- Condition / age +2.2/5.0
- DSCR +0.0/10.0
$89,900
🖨 Deal sheet (PDF) 📄 Offer letter ✓ Due diligence
Listing remarks MLS
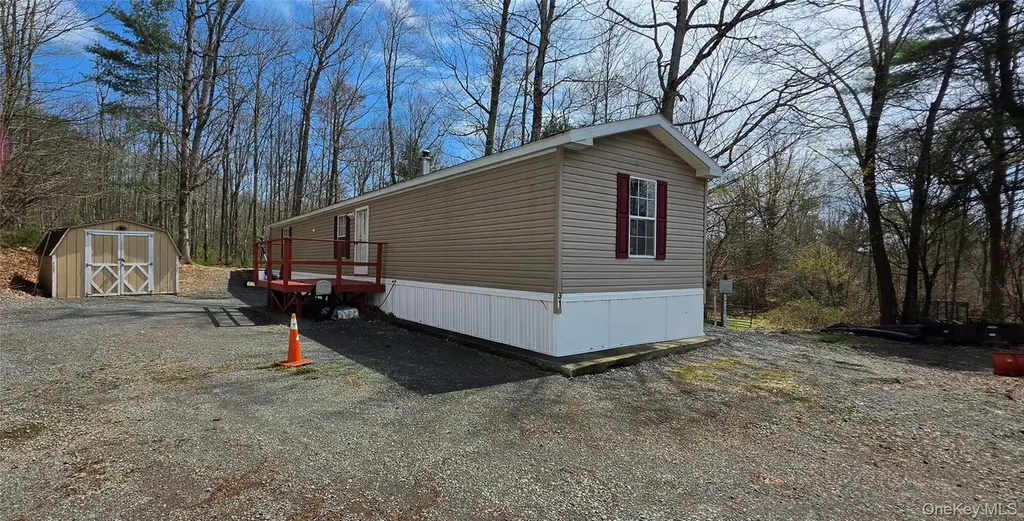
2004 Mobile Home! This well maintained single wide mobile home is set on a cul de sac, in a mobile home park (lot rent at $525 per month). Features include a living room, eat-in kitchen, laundry area, 3 bedrooms and 2 full baths. There is a nice front deck and a rear deck, plus a storage shed and a sea container for keeping all of your toys. This home comes fully furnished, just bring your suitcase and start to enjoy the country setting! Just about 2 miles to the charming town of Narrowsburg and the Delaware River. A great place for a get-a-way or for hunters.
Key facts
- Front deck
- Cul de sac
- Storage shed
Tags
Neighborhood map
What this means for you Summary
Snapshot
- This is a 3-bed/2.0-bath manufactured listed at $90k. Condition is rated fair.
Deal economics
- At list price, monthly cash flow is $-258 ($-3k/yr) — negative.
- To cash-flow at today's rent, offer at most $53k (41.6% below list).
- Meets the 1% rule at list price ($1k rent vs $90k).
- Recommended offer: $53k (41.6% below list) — sets the bar for cash-flow.
- Cap rate 2.8% vs local median 2.1% in Lake Huntington — top-decile yield for the area; either an underpriced asset or a hidden risk that comps aren't pricing in. Stress-test before assuming the spread holds.
Location & tenants
- Location reads: area grade D — affects rentability + tenant quality, not the cash-flow math above.
- Sullivan West Central School District (rural): math 45% / reading 47% proficiency, ranked #436 of 590 in NY (top 74%) — families likely to look elsewhere, expect single-tenant / working-renter base with shorter leases.
- Market conditions: 43 active listings in the ZIP; 739 units permitted in Sullivan County in 2024 (5 in 5+ unit buildings).
Forward outlook
- In year one you build about $10k of equity ($622 loan paydown + $9k appreciation (10.0% local appreciation)).
- Sullivan County population projected at -24% by 2050 — secular population decline; favor cash flow + early exit over multi-decade hold.
- By year 4, paydown + projected appreciation supports a ~$34k cash-out refi (75% LTV) — recoverable capital for the next deal without selling this one.
Negotiation context
- It's been on market 159 days — a 12% lower offer ($79k) is reasonable based on typical stale-listing flexibility.
Risks & watch-outs
- Watch-outs: HOA is 47% of rent.
Questions for the listing agent
- What do current leases actually rent for vs. the listed asking? Can we see a recent rent roll and the last 12 months of T-12 income?
- It's been on market 159 days. Have you received any prior offers? Is the seller open to a 42% concession, seller financing, or rate buy-down credit?
- Have any recent inspections been done? Can we get a copy of the seller's disclosures and any deferred-maintenance estimates?
- What does the HOA fee cover, when was the last increase, and are there any pending special assessments or reserve-fund shortfalls?
- Why hasn't it sold? Are there any deal-killer items the seller is aware of (foundation, flood, title, zoning, code violations)?
- Is there a deadline driving the sale (1031 exchange, divorce, estate, relocation)? That informs how much negotiation room exists.
- The area grade is low — what's the realistic commute time and amenity access for the typical tenant pool here? Any planned neighborhood developments (good or bad) we should know about?
- What's the average days-on-market for RENTAL listings here right now (not sales)? A rising rental-DOM trend means longer vacancies and softer asking-rent achievability than the comps imply.
- What's the recent tenant-quality profile in this submarket — average credit score on applications, eviction rate, late-payment / NSF rate, and stable-employment percentage? A property-management company in the area should have these aggregated.
- How much new for-sale + rental construction is in the pipeline within 1–3 miles? Heavy new supply typically softens prices + rents 12–24 months out; constrained supply supports both.
Investment metrics
- 1% rule
- 1.25% ✓
- Cap rate
- 2.85%
- Cash-on-cash
- -12.31%
- DSCR
- 0.45
- GRM
- 6.7
CMA / ARV
No comps found within radius.
Projected returns pro-forma
10.0% appreciation · 3.0% rent growth · sell at horizon
- IRR
- 15.8%
- Equity multiple
- 2.31×
- Total profit
- $32,850
- Equity at exit
- $80,989
- IRR
- 15.4%
- Equity multiple
- 5.38×
- Total profit
- $110,351
- Equity at exit
- $174,656
Cash invested: $25,172 (down + closing). Projections, not guarantees.
Landlord ↔ Tenant lean methodology
- Overall (STATE)
- 15 Strongly Tenant-Friendly
- State New York
- 15 Strongly Tenant-Friendly · D+10
- County
- — inherits STATE
- City
- — inherits STATE
ZIP-level market 12764
- Home prices YoY
- 15.3%
- Active inventory
- 43
- Price-to-rent
- 6.7×
Monthly cashflow live
- Estimated rent
- $1,124 medium interval (Pro) →
- Mortgage (P&I)
- −$471
- Tax est. 1.5%
- −$112 /mo · $1,348/yr
- Insurance
- −$37
- HOA
- −$525
- Vacancy / Maint / Mgmt
- −$236
- Net cashflow
- $-258
Break-even live
Sensitivity live
| Price | -10% $-196 | -5% $-227 | +0% $-258 | +5% $-289 | +10% $-320 |
|---|---|---|---|---|---|
| Rent | -10% $-347 | -5% $-303 | +0% $-258 | +5% $-214 | +10% $-170 |
| Rate | -1.0pp $-213 | -0.5pp $-235 | base $-258 | +0.5pp $-282 | +1.0pp $-305 |
UW: 25.0% down · 7.5% · 30yr · 1.5% tax · 5.0% vac · 8.0% maint · 8.0% mgmt
Financing live
Cash to close
- Down payment
- $22,475
- Closing costs
- $2,697
- Reserves months
- —
- Total cash needed
- —
Loan-product check · same deal, 3 products live
Conventional
25% down · 7.5% · 30yr
- Down + closing
- —
- Monthly P&I
- —
- Monthly cashflow
- —
- DSCR
- —
- Eligible?
- —
Personal DTI + credit; lowest rate.
DSCR
20% down · 8.5% · 30yr
- Down + closing
- —
- Monthly P&I
- —
- Monthly cashflow
- —
- DSCR
- —
- Eligible?
- —
No personal income docs; deal must DSCR.
Hard money
10% down · 12.0% · 12mo
- Down + closing
- —
- Monthly P&I
- —
- Monthly cashflow
- —
- DSCR
- —
- Eligible?
- —
Short-term bridge; refi at stabilization.
HOA detail
- Monthly dues
- $525 · $6,300/yr
Listing history 16 events
-
2026-06-21days on market $89,900 Active 159 DOM
-
2026-06-18days on market $89,900 Active 157 DOM
-
2026-06-17days on market $89,900 Active 156 DOM
-
2026-06-16days on market $89,900 Active 155 DOM
-
2026-06-15days on market $89,900 Active 154 DOM
-
2026-06-13days on market $89,900 Active 152 DOM
-
2026-06-12days on market $89,900 Active 151 DOM
-
2026-06-09days on market $89,900 Active 148 DOM
-
2026-06-08days on market $89,900 Active 147 DOM
-
2026-06-07days on market $89,900 Active 146 DOM
-
2026-06-07days on market $89,900 Active 145 DOM
-
2026-06-04days on market $89,900 Active 142 DOM
-
2026-06-02days on market $89,900 Active 141 DOM
-
2026-06-01days on market $89,900 Active 140 DOM
-
2026-05-31days on market $89,900 Active 139 DOM
-
2026-01-12$89,900 Active 566-char remark
Show marketing remark (566 chars)
2004 Mobile Home! This well maintained single wide mobile home is set on a cul de sac, in a mobile home park (lot rent at $525 per month). Features include a living room, eat-in kitchen, laundry area, 3 bedrooms and 2 full baths. There is a nice front deck and a rear deck, plus a storage shed and a sea container for keeping all of your toys. This home comes fully furnished, just bring your suitcase and start to enjoy the country setting! Just about 2 miles to the charming town of Narrowsburg and the Delaware River. A great place for a get-a-way or for hunters.
ⓘ Source: listings_history table (triggers on properties + properties_extension) + one-shot
backfill from property_details.listing_events for pre-trigger history.
Climate risk First Street
- Flood 1/10 Low FEMA zone X (unshaded) · 0% chance over 30 yrs
- Wildfire 3/10 Moderate
- Heat 2/10 Low 7 d/yr ≥92°F today · 15 d/yr by 30 yrs out
- Wind 2/10 Low 2% chance of damaging wind over 30 yrs
- Air quality 2/10 Low 1 unhealthy d/yr today · 1 by 30 yrs out
Nearby sold comps map
Loading sold comps map…
Walkable amenities ~0.75 mi
Loading nearby amenities…
Taxation est. · year 1
- Rental income
- $13,488
- − Mortgage interest
- −$5,036
- − Property taxes
- −$1,348
- − Insurance
- −$450
- − Repairs & maintenance
- −$1,079
- − Management
- −$1,079
- − HOA
- −$6,300
- − Depreciation
- −$2,615
- Taxable loss
- −$4,419
- Est. tax savings @ 24.0%
- +$1,061
- After-tax cash flow
- $-2,039/yr
For passive investors: Depreciation is non-cash, so a rental often shows a tax loss while cash-flowing — sheltering income. Rental losses are passive: they offset passive income freely, and up to $25,000/yr can offset ordinary (W-2) income if you actively participate and your MAGI is under $100k (phasing out to $0 by $150k); unused losses carry forward. On sale, claimed depreciation is recaptured at up to 25%, and gains may owe capital-gains tax (a 1031 exchange can defer both). Figures are a year-1 estimate at your 24.0% rate — not tax advice; consult a CPA.
Condition & rehab AI · 12 photos
This 2004 single-wide mobile home requires moderate repairs and maintenance to improve its condition and value. Key updates include painting, replacing worn cabinets and sink, and landscaping the front yard.
Repairs flagged
- Minor Kitchen cabinets — Worn appearance
- Minor Bathroom sink — Appears functional but dated
- Minor Exterior siding — Could use cleaning
Value-add opportunities
- Both Paint interior walls — Fresh paint enhances curb appeal and interior aesthetics
- Both Replace kitchen cabinets — New cabinets improve functionality and aesthetics
- Both Replace bathroom sink — A new sink enhances functionality and aesthetics
- Both Landscaping front yard — Landscaping enhances curb appeal and property value
Renovation cost estimate screening
| Repair item | Severity | Est. cost |
|---|---|---|
| Kitchen cabinets · Worn appearance | Minor | $500–3,000 |
| Bathroom sink · Appears functional but dated | Minor | $500–3,000 |
| Exterior siding · Could use cleaning | Minor | $500–3,000 |
| Total estimated repair cost · 3 items | $1,500–9,000 |
Value-add ROI direction
- Both Paint interior walls — Fresh paint enhances curb appeal and interior aesthetics ↑
- Both Replace kitchen cabinets — New cabinets improve functionality and aesthetics ↑
- Both Replace bathroom sink — A new sink enhances functionality and aesthetics ↑
- Both Landscaping front yard — Landscaping enhances curb appeal and property value ↑
ⓘ Cost ranges are severity-bucket heuristics (US national rule-of-thumb). Get contractor quotes + a written scope before underwriting a rehab budget.
Schools (NCES district)
- District
- Sullivan West Central School District
- NCES district ID
- 3600023
- Math proficiency
- 45% ▼ -7.00%
- Reading proficiency
- 47% ▼ -2.00%
- Median HH income
- $56,078
- Composite
- 40.05/100
- National rank
- #3817
- State rank
- #436 of 590 in NY
Livability — Lake Huntington
No livability data for this city. (Only ~50 U.S. cities are tracked.)
Census & demographics
- City population
- 301
- Population (ZIP)
- 1,827
Population outlook (Sullivan County) Hauer SSP2
- Today (2025)
- 68,974 people
- By 2030
- 65,609 · -4.9%
- By 2040
- 58,878 · -14.6%
- By 2050
- 52,500 · -23.9%
- By 2075
- 39,941 · -42.1%
- By 2100
- 28,880 · -58.1%
Race, ethnicity, and origin ACS 2023
- Neighborhood character
- Predominantly White (76%)
- Race & ethnicity
- White 76% Black 14% Hispanic / Latino 6% Two or more races 3%
- Hispanic origin (detail)
- Common ancestry
- Danish 4% Iranian 3% Slovak 2%
- Foreign-born
- 5% · Canada, Mexico
- Languages at home
- 93% English-only · Spanish 3% German/W. Germanic 2% Other Indo-European 1%
Political lean MEDSL · Sullivan
- 2024 margin
- R (+16.7) · D 41.6% · R 58.4%
- 2008→2024 swing
- -26.2pp toward R · 2008: 9.5pp · 2024: -16.7pp
- All cycles
- 2024: R+16.7 2020: R+9.2 2016: R+13.7 2012: D+10.4 2008: D+9.5
Not yet ingested
- Civics
- —
Market trends
- HPI YoY
- ▲ 55.78%
- Current HPI
- 420.1391
- Rent YoY
- —
- Metro
- —
- State GDP YoY
- ▲ 2.60%
- F500 in state
- 92
Industry mix (Fortune 500 HQ in NY)
| Industry | F500 HQs | Revenue |
|---|---|---|
| Financial Services | 10 | $950B |
|
||
| Consumer Goods | 9 | $162B |
|
||
| Insurance | 4 | $225B |
|
||
| Telecommunications | 2 | $144B |
|
||
| Pharmaceuticals | 2 | $112B |
|
||
| Media / Entertainment | 2 | $69B |
|
||
Price history
1 event — show timeline
- 2026-01-12 Listed $89,900 OneKey® MLS as Distributed by MLS Grid
Cash-flow waterfall
monthlySold comps — $/sqft
last 12 mo · ≤1 miLoading sold comps…