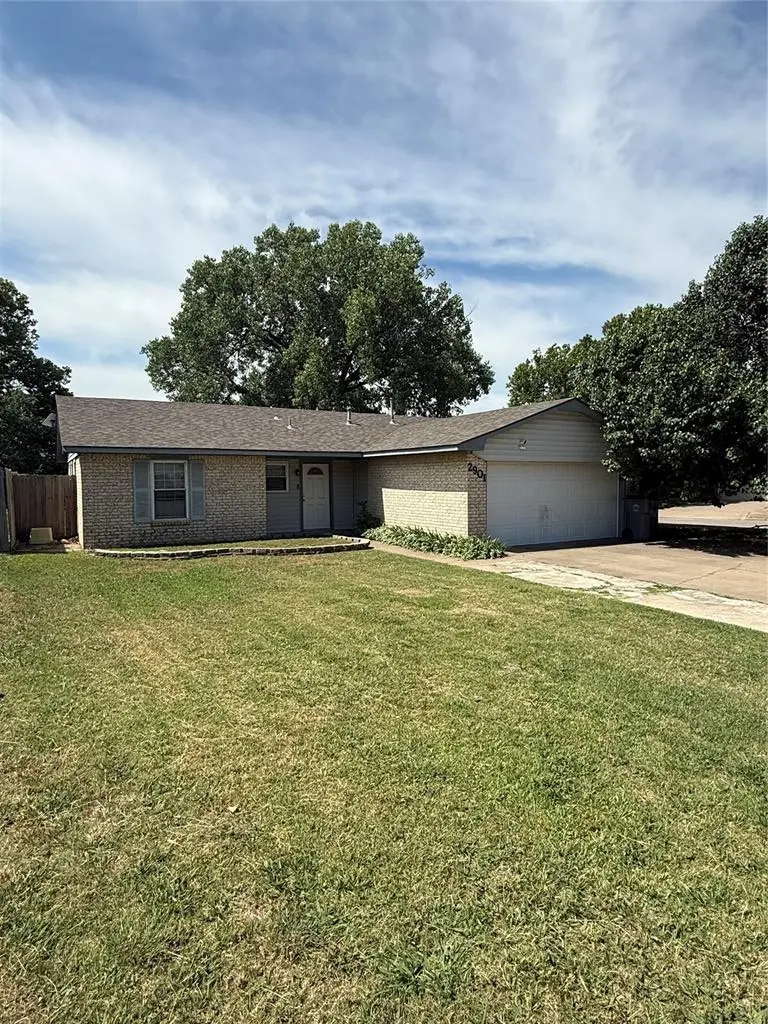
2901 NE Lakeview Cir · Lawton, OK
Flood risk 3/10 · Minor
- FEMA flood zone
- X (unshaded)
- Chance of flooding over 30 yrs
- 0.2%
- Est. flood insurance / yr
- $507 – $1,088
Fire risk 7/10 · Major
- Est. fire insurance / yr
- $2,463 – $4,575
Heat risk 6/10 · Moderate
- Hot days now (above 108°F)
- 7 days/yr
- Hot days in 30 yrs
- 19 days/yr
Wind risk 3/10 · Minor
- Chance of severe wind over 30 yrs
- 5.0%
Air-quality risk 1/10 · Minimal
- Unhealthy air days now
- 0 days/yr
- Unhealthy air days in 30 yrs
- 0 days/yr
Risk factors via First Street. Map © Google.
Why this score? — see what drove the D- grade
The composite is a weighted blend of 9 inputs, each scored 0–100. Each bar is that input's sub-score; the figure is the points it added to the 100-point composite (weight × sub-score).
- Cash flow +16.4/30.0
- DSCR +5.1/10.0
- 1% rule +3.8/10.0
- Livability +3.2/5.0
- Rent growth +2.6/5.0
- Condition / age +2.5/5.0
- Schools +2.0/10.0
- ARV discount +1.1/15.0
- Appreciation +0.0/10.0
$134,000
🖨 Deal sheet (PDF) 📄 Offer letter ✓ Due diligence
Listing remarks MLS
This home is located on the east side of Lawton with easy access to all of Lawton and Fort Sill. The neighborhood offers quiet neighbors and a park and pond within walking distance. It has 3 bedrooms, 1.75 bath and 2 car garage and is located on a cul-de-sac street. The family room is cozy and has a fireplace. The master bed has a ample closet space and . 75 bath. The owner has recently renovated both baths, fresh paint, new carpet, new roof, new appliances, fixtures, and more. You will love the location of the home and all it has to offer. For more information or private showing call 580 248 2600.
Key facts
- 8,712 sq ft lot
- 2 garage spots
- Built 1978
Tags
Property features AI
Finance
- Other: Homestead eligible
- Financial info: Loan qualification allowed; Not assumable
- HOA & community: No mandatory association dues
Exterior
- Parking: Concrete driveway; 2-car garage
- Utilities: Flood insurance required
- Home design: Single family residence; One story; North-facing; Existing property
- Construction: Brick and frame construction; Shingle roof (replaced/installed in 2020); Slab foundation
- Exterior features: Open patio; Wood fencing; Corner lot, cul-de-sac, interior lot
Interior
- Kitchen: Electric range/oven
- Bedrooms: 3 bedrooms
- Flooring: Carpet; Tile
- Bathrooms: 2 full bathrooms
- Heating & cooling: Electric heating
- Interior features: One living area; Wood-burning fireplace; Open patio
- Laundry & utility: No study indicated
Neighborhood map
What this means for you Summary
Snapshot
- This is a 3-bed/1.0-bath single-family listed at $134k.
Deal economics
- At list price, monthly cash flow is $77 ($925/yr) — positive.
- The deal already cash-flows at list — no discount required.
- To meet the 1% rule (rent ≥ 1% of price), the offer needs to be $119k (11.6% below list).
- Recommended offer: $119k (11.6% below list) — sets the bar for 1% rule.
Location & tenants
- Location reads 63/100 on livability (#206 in OK) — a middle-class / working-renter tenant base. Strengths: cost of living A+, housing A+; Watch: employment D, crime F, commute F.
- Lawton (urban): math 20% / reading 26% proficiency, ranked #137 of 270 in OK (top 51%) — low school quality limits family demand, transient renter base, plan for 1-2y turnover.
- Zoned schools: Carriage Hills Es (math 27% / reading 17%, grade F, #413 of 845 statewide, top 54%, 311 students, 0% FRL); Macarthur Hs (math 19% / reading 34%, grade F, #139 of 447 statewide, top 31%, 1,163 students, 0% FRL) — zoned schools average 0% FRL vs 54% district-wide (54 pts lower); this property's tenant base skews higher-income than the district average.
- Market conditions: Rents flat; 209 active listings in the ZIP; 133 units permitted in Comanche County in 2024 (0 in 5+ unit buildings).
Forward outlook
- Local home prices are declining (-3.0%/yr); year-one equity from $926 of loan paydown is wiped out by about $4k of value loss. Plan a longer hold.
- Comanche County population projected to shrink 3% by 2050 — rents likely to lag national; underwrite the cash flow, not the appreciation.
Negotiation context
- Only 11 days on market — expect competitive offers; lowballing is unlikely to land.
- 3 sale attempts since 6y ago with the ask held roughly flat each time — persistent listings suggest the price (not the market) is what's stuck; bring a comps-based counter.
- Current owner paid $91k; 47% above their basis — modest negotiation headroom, anchor on the comps not their cost.
Risks & watch-outs
- Climate carrying-cost: major wildfire risk; extreme-heat days projected 7→19/yr by 2055 (HVAC capex compounding) — expect insurance premiums to compound above CPI over the hold.
Questions for the listing agent
- Built in 1978 — when were the roof, HVAC, electrical panel, plumbing, and water heater last replaced?
- Is there a deadline driving the sale (1031 exchange, divorce, estate, relocation)? That informs how much negotiation room exists.
- Schools are D-rated, which usually means shorter tenancies and higher turnover. Who's the typical renter profile here, and what's been the actual vacancy rate?
- Crime grade is F in this area — have there been break-ins, vandalism, or insurance claims at this property in the last 3 years? What carrier currently insures it and at what premium?
- The area grade is low — what's the realistic commute time and amenity access for the typical tenant pool here? Any planned neighborhood developments (good or bad) we should know about?
- What's the average days-on-market for RENTAL listings here right now (not sales)? A rising rental-DOM trend means longer vacancies and softer asking-rent achievability than the comps imply.
- What's the recent tenant-quality profile in this submarket — average credit score on applications, eviction rate, late-payment / NSF rate, and stable-employment percentage? A property-management company in the area should have these aggregated.
- How much new for-sale + rental construction is in the pipeline within 1–3 miles? Heavy new supply typically softens prices + rents 12–24 months out; constrained supply supports both.
Investment metrics
- 1% rule
- 0.88% ✗
- Cap rate
- 6.98%
- Cash-on-cash
- 2.47%
- DSCR
- 1.11
- GRM
- 9.4
CMA / ARV
- ARV (on-the-fly)
- $117,300
- Comps found
- 11
Show comp detail 11 sales within ~0.75 mi
| Address | Dist | Beds/Ba | Sqft | Sold | Price | $/sf | Match |
|---|---|---|---|---|---|---|---|
| 409 NE 27th St | 0.18mi | 3/1.5 | 1,100 (-4%) | 3mo | $107,000 | $97 | 80 |
| 2711 NE Euclid | 0.25mi | 3/2.0 | 1,200 (+4%) | 6mo | $122,000 | $102 | 72 |
| 2626 NE Euclid Ave | 0.29mi | 2/2.0 (-1) | 1,100 (-4%) | 2mo | $105,000 | $95 | 69 |
| 2628 NE Euclid Ave | 0.28mi | 2/2.0 (-1) | 1,100 (-4%) | 11mo | $99,500 | $90 | 62 |
| 2609 NE Euclid | 0.29mi | 3/2.0 | 1,290 (+12%) | 2mo | $145,000 | $112 | 61 |
| 2905 NE Lakeview Cir | 0.03mi | 3/2.0 | 1,300 (+13%) | 17mo | $164,900 | $127 | 59 |
| 119 SE Surrey Ln | 0.39mi | 3/2.0 | 1,100 (-4%) | 19mo | $130,000 | $118 | 55 |
| 2620 NE Euclid Ave | 0.29mi | 3/2.0 | 1,311 (+14%) | 7mo | $171,000 | $130 | 53 |
| 2508 NE Dearborn Ave | 0.30mi | 2/2.0 (-1) | 1,000 (-13%) | 4mo | $73,000 | $73 | 52 |
| 115 SE Coachman | 0.45mi | 3/2.0 | 1,000 (-13%) | 3mo | $131,500 | $132 | 51 |
| 210 SE Coachman Dr | 0.52mi | 3/1.5 | 1,100 (-4%) | 19mo | $90,000 | $82 | 50 |
Match score weights: distance 35% · size 25% · config 20% · recency 20%. Top-matched comps best support the ARV.
Projected returns pro-forma
-3.0% appreciation · 0.25% rent growth · sell at horizon
- IRR
- -15.3%
- Equity multiple
- 0.47×
- Total profit
- $-20,017
- Equity at exit
- $19,980
- IRR
- -12.0%
- Equity multiple
- 0.37×
- Total profit
- $-23,597
- Equity at exit
- $11,586
Cash invested: $37,520 (down + closing). Projections, not guarantees.
Landlord ↔ Tenant lean methodology
- Overall (STATE)
- 83 Strongly Landlord-Friendly
- State Oklahoma
- 83 Strongly Landlord-Friendly · R+20
- County
- — inherits STATE
- City
- — inherits STATE
ZIP-level market 73507
- Home prices YoY
- -23.2%
- Rents YoY
- 0.2%
- Active inventory
- 209
- Price-to-rent
- 9.4×
Monthly cashflow live
- Estimated rent
- $1,185 medium interval (Pro) →
- Mortgage (P&I)
- −$703
- Tax from tax record
- −$101 /mo · $1,208/yr
- Insurance
- −$56
- HOA
- −$0
- Vacancy / Maint / Mgmt
- −$249
- Net cashflow
- $77
Break-even live
Sensitivity live
| Price | -10% $153 | -5% $115 | +0% $77 | +5% $39 | +10% $1 |
|---|---|---|---|---|---|
| Rent | -10% $-17 | -5% $30 | +0% $77 | +5% $124 | +10% $171 |
| Rate | -1.0pp $145 | -0.5pp $111 | base $77 | +0.5pp $42 | +1.0pp $7 |
UW: 25.0% down · 7.5% · 30yr · 1.5% tax · 5.0% vac · 8.0% maint · 8.0% mgmt
Financing live
Cash to close
- Down payment
- $33,500
- Closing costs
- $4,020
- Reserves months
- —
- Total cash needed
- —
Loan-product check · same deal, 3 products live
Conventional
25% down · 7.5% · 30yr
- Down + closing
- —
- Monthly P&I
- —
- Monthly cashflow
- —
- DSCR
- —
- Eligible?
- —
Personal DTI + credit; lowest rate.
DSCR
20% down · 8.5% · 30yr
- Down + closing
- —
- Monthly P&I
- —
- Monthly cashflow
- —
- DSCR
- —
- Eligible?
- —
No personal income docs; deal must DSCR.
Hard money
10% down · 12.0% · 12mo
- Down + closing
- —
- Monthly P&I
- —
- Monthly cashflow
- —
- DSCR
- —
- Eligible?
- —
Short-term bridge; refi at stabilization.
Listing history 9 events
-
2026-06-21days on market $134,000 Active 11 DOM
-
2026-06-19days on market $134,000 Active 9 DOM
-
2026-06-18days on market $134,000 Active 8 DOM
-
2026-06-17days on market $134,000 Active 7 DOM
-
2026-06-16days on market $134,000 Active 6 DOM
-
2026-06-15days on market $134,000 Active 5 DOM
-
2026-06-14days on market $134,000 Active 3 DOM
-
2026-06-13remarks 498-char remark
-
2026-06-13$134,000 Active 2 DOM
ⓘ Source: listings_history table (triggers on properties + properties_extension) + one-shot
backfill from property_details.listing_events for pre-trigger history.
Tax reassessment forecast OK · Resets to sale price
- Current annual tax
- $1,208 · $101/mo
- Projected year-2 tax
- $1,208 · $101/mo
- Expected delta
- $0/yr ($0/mo · 0.0%)
ⓘ Screening estimate from a state-policy table — verify with the county assessor before closing.
Climate risk First Street
- Flood 3/10 Moderate FEMA zone X (unshaded) · 20% chance over 30 yrs
- Wildfire 7/10 Severe
- Heat 6/10 Major 7 d/yr ≥108°F today · 19 d/yr by 30 yrs out
- Wind 3/10 Moderate 5% chance of damaging wind over 30 yrs
- Air quality 1/10 Low 0 unhealthy d/yr today · 0 by 30 yrs out
Nearby sold comps map
Loading sold comps map…
Walkable amenities ~0.75 mi
Loading nearby amenities…
Taxation est. · year 1
- Rental income
- $14,223
- − Mortgage interest
- −$7,506
- − Property taxes
- −$1,208
- − Insurance
- −$670
- − Repairs & maintenance
- −$1,138
- − Management
- −$1,138
- − Depreciation
- −$3,898
- Taxable loss
- −$1,335
- Est. tax savings @ 24.0%
- +$320
- After-tax cash flow
- $1,246/yr
For passive investors: Depreciation is non-cash, so a rental often shows a tax loss while cash-flowing — sheltering income. Rental losses are passive: they offset passive income freely, and up to $25,000/yr can offset ordinary (W-2) income if you actively participate and your MAGI is under $100k (phasing out to $0 by $150k); unused losses carry forward. On sale, claimed depreciation is recaptured at up to 25%, and gains may owe capital-gains tax (a 1031 exchange can defer both). Figures are a year-1 estimate at your 24.0% rate — not tax advice; consult a CPA.
Schools (NCES district)
- District
- Lawton
- NCES district ID
- 4017250
- Math proficiency
- 20% ▼ -12.00%
- Reading proficiency
- 26% ▼ -9.00%
- Median HH income
- $42,618
- Composite
- 19.68/100
- National rank
- #8732
- State rank
- #137 of 270 in OK
Livability — Lawton
- Score
- 63/100
- State rank
- #206
- US rank
- #15131
Category grades
Schools grade is shown separately in the Schools card above.
Census & demographics
- Census place
- Lawton, OK
- County
- Comanche County · 96,361 people
- City population
- 89,233
- Metro
- Lawton, OK
- Population (ZIP)
- 21,046
- Household income
- $62,132
- Rent vs Own
- Severe rent burden
- 979.0
Population outlook (Comanche County) Hauer SSP2
- Today (2025)
- 124,518 people
- By 2030
- 124,231 · -0.2%
- By 2040
- 122,193 · -1.9%
- By 2050
- 120,368 · -3.3%
- By 2075
- 120,492 · -3.2%
- By 2100
- 123,113 · -1.1%
Race, ethnicity, and origin ACS 2023
- Neighborhood character
- Diverse neighborhood (Simpson 0.65)
- Race & ethnicity
- White 56% Hispanic / Latino 14% Two or more races 13% Black 13% Native American 7% Asian 2%
- Hispanic origin (detail)
- Mexican 7% Puerto Rican 4%
- Common ancestry
- Lithuanian 2% Slovak 2% Italian 1%
- Foreign-born
- 5% · Canada, South Korea
- Languages at home
- 89% English-only · Spanish 6% German/W. Germanic 1% Other Asian/Pacific 1%
Political lean MEDSL · Comanche
- 2024 margin
- Strong R (+23.3) · D 37.4% · R 60.7% · Other 1.9%
- 2008→2024 swing
- -5.8pp toward R · 2008: -17.5pp · 2024: -23.3pp
- All cycles
- 2024: R+23.3 2020: R+20.1 2016: R+23.7 2012: R+17.0 2008: R+17.5
Not yet ingested
- Civics
- —
Market trends
- HPI YoY
- ▼ -38.48%
- Current HPI
- 127.057
- Rent YoY
- ▲ 0.25%
- Metro
- Lawton, OK
- State GDP YoY
- ▲ 1.55%
- F500 in state
- 6
Industry mix (Fortune 500 HQ in OK)
| Industry | F500 HQs | Revenue |
|---|---|---|
| Energy | 3 | $48B |
|
||
Price history
+119.7% since first listed9 events — show timeline
- 2026-06-10 Listed $134,000 MLSOK
- 2025-12-31 Listing Removed — MLSOK
- 2025-11-19 Price Changed $134,000 MLSOK
- 2025-09-10 Listed $140,000 MLSOK
- 2020-07-17 Sold (Public Records) $91,000 Public Records
- 2020-07-16 Sold (MLS) $90,000 LBRMLS
- 2020-04-27 Listed $90,000 LBRMLS
- 2005-01-05 Sold (Public Records) $90,000 Public Records
- 1998-04-17 Sold (Public Records) $61,000 Public Records
Property tax history
+2.6%/yrLatest (2025): $1,208 · +4.7% YoY. Source: county tax records.
Cash-flow waterfall
monthlySold comps — $/sqft
last 12 mo · ≤1 miLoading sold comps…