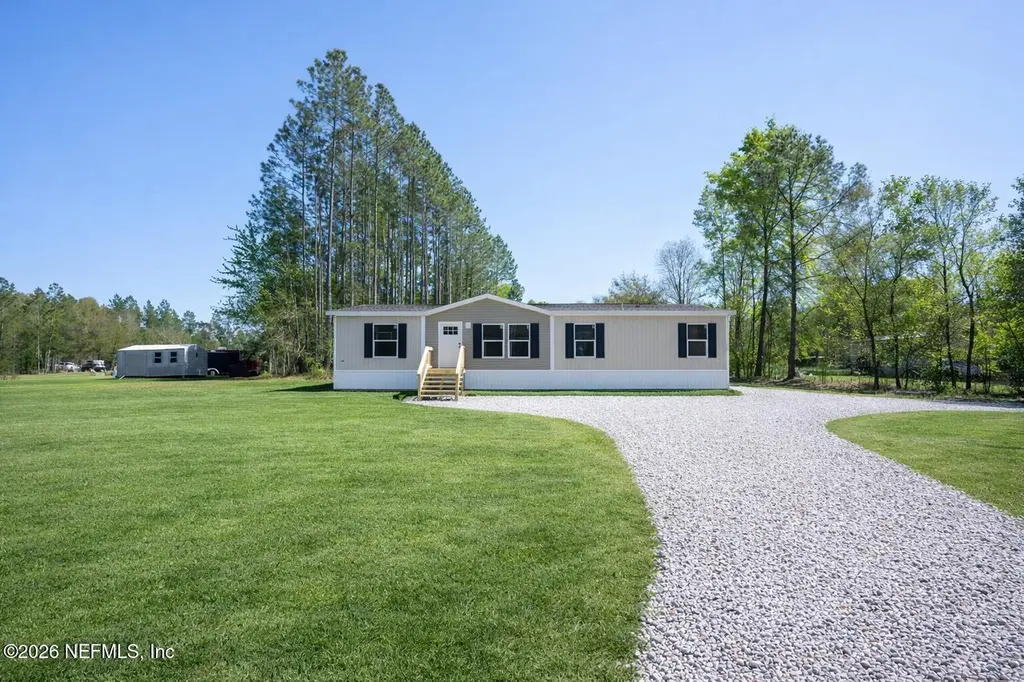
10101 Co Rd 127 · Glen St. Mary, FL
Flood risk No data
- FEMA flood zone
- —
- Chance of flooding over 30 yrs
- —
- Est. flood insurance / yr
- —
Fire risk No data
- Est. fire insurance / yr
- —
Heat risk No data
- Hot days now (above threshold)
- —
- Hot days in 30 yrs
- —
Wind risk No data
- Chance of severe wind over 30 yrs
- —
Air-quality risk No data
- Unhealthy air days now
- —
- Unhealthy air days in 30 yrs
- —
Risk factors via First Street. Map © Google.
Why this score? — see what drove the C- grade
The composite is a weighted blend of 9 inputs, each scored 0–100. Each bar is that input's sub-score; the figure is the points it added to the 100-point composite (weight × sub-score).
- Cash flow +18.4/30.0
- ARV discount +7.5/15.0
- DSCR +5.8/10.0
- 1% rule +4.9/10.0
- Schools +4.4/10.0
- Condition / age +4.2/5.0
- Rent growth +2.5/5.0
- Livability +2.5/5.0
- Appreciation +0.0/10.0
$265,000
🖨 Deal sheet (PDF) 📄 Offer letter ✓ Due diligence
Listing remarks
BACK ON MARKET at no fault of seller! Seller is offering 4.5% TOWARDS BUYERS CLOSING COSTS/FEES. Home does qualify for 100% financing USDA Loan (NO DOWN PAYMENT), a 2-1 BUYDOWN PROGRAM and UP TO $1,000 SELLER CREDIT with preferred lender. Welcome home to this brand new Clayton Homes manufactured home (Boone floor plan), situated on a 1 acre lot and offering a functional layout with room to spread out. Featuring 4 bedrooms, 2 bathrooms, and 1,475 square feet of living space, this home includes an open concept design with a split floor plan for added privacy. The kitchen features a center island and breakfast bar, ideal for everyday living and entertaining. A flex space provides additional ve
Key facts
- Built 2026
- Listed 83 days
Property features AI
Finance
- HOA & community: Not a senior community
Exterior
- Parking: Off-street parking
- Utilities: Septic tank; Electricity connected; Sewer connected; Water connected; Paved road access
- Home design: Double wide manufactured home; Used as a single-family residence
- Exterior features: Deck
Interior
- Kitchen: Dishwasher; Electric oven; Refrigerator
- Bedrooms: 4 bedrooms
- Bathrooms: 2 full bathrooms
- Heating & cooling: Central heating; Central air conditioning
- Interior features: Breakfast bar; Kitchen island; Open floor plan; Primary bathroom with shower (no tub); Split bedroom layout; Walk-in closets
- Laundry & utility: In-unit laundry
Neighborhood map
What this means for you Summary
Snapshot
- This is a 4-bed/2.0-bath manufactured listed at $265k. Condition is rated good.
Deal economics
- At list price, monthly cash flow is $245 ($3k/yr) — positive.
- The deal already cash-flows at list — no discount required.
- To meet the 1% rule (rent ≥ 1% of price), the offer needs to be $263k (0.8% below list).
- Recommended offer: $249k (6.0% below list) — sets the bar for market timing.
- Cap rate 7.4% vs local median 3.5% in Glen St. Mary — top-decile yield for the area; either an underpriced asset or a hidden risk that comps aren't pricing in. Stress-test before assuming the spread holds.
Location & tenants
- Location reads: area grade C — affects rentability + tenant quality, not the cash-flow math above.
- Baker (town): math 53% / reading 49% proficiency, ranked #28 of 73 in FL (top 38%) — acceptable for families but not a draw, mixed tenant base, ~2y average lease.
- Zoned schools: Prek/Kindergarten Center (592 students, 58% FRL); Baker County Middle School (math 47% / reading 42%, grade D, #320 of 571 statewide, top 57%, 1,102 students, 52% FRL); Baker County Senior High School (math 41% / reading 48%, grade F, #237 of 667 statewide, top 36%, 1,425 students, 40% FRL) — zoned schools at 50% FRL track the district average.
- Market conditions: 64 active listings in the ZIP; 99 units permitted in Baker County in 2024 (0 in 5+ unit buildings).
Forward outlook
- Local home prices are declining (-3.0%/yr); year-one equity from $2k of loan paydown is wiped out by about $8k of value loss. Plan a longer hold.
- Baker County population projected to shrink 9% by 2050 — rents likely to lag national; underwrite the cash flow, not the appreciation.
Negotiation context
- It's been on market 84 days — a 6% lower offer ($249k) is reasonable based on typical stale-listing flexibility.
- 2 sale attempts; this cycle's ask has dropped $20k (7%) from the opening price — seller is motivated, your offer sets the floor, not the list.
Questions for the listing agent
- It's been on market 84 days. Have you received any prior offers? Is the seller open to a 6% concession, seller financing, or rate buy-down credit?
- Why hasn't it sold? Are there any deal-killer items the seller is aware of (foundation, flood, title, zoning, code violations)?
- Is there a deadline driving the sale (1031 exchange, divorce, estate, relocation)? That informs how much negotiation room exists.
- What's the average days-on-market for RENTAL listings here right now (not sales)? A rising rental-DOM trend means longer vacancies and softer asking-rent achievability than the comps imply.
- What's the recent tenant-quality profile in this submarket — average credit score on applications, eviction rate, late-payment / NSF rate, and stable-employment percentage? A property-management company in the area should have these aggregated.
- How much new for-sale + rental construction is in the pipeline within 1–3 miles? Heavy new supply typically softens prices + rents 12–24 months out; constrained supply supports both.
Investment metrics
- 1% rule
- 0.99% ✗
- Cap rate
- 7.40%
- Cash-on-cash
- 3.97%
- DSCR
- 1.18
- GRM
- 8.4
CMA / ARV
No comps found within radius.
Projected returns pro-forma
-3.0% appreciation · 3.0% rent growth · sell at horizon
- IRR
- -10.1%
- Equity multiple
- 0.63×
- Total profit
- $-27,272
- Equity at exit
- $39,512
- IRR
- -0.7%
- Equity multiple
- 0.95×
- Total profit
- $-3,462
- Equity at exit
- $22,912
Cash invested: $74,200 (down + closing). Projections, not guarantees.
Landlord ↔ Tenant lean methodology
- Overall (STATE)
- 87 Strongly Landlord-Friendly
- State Florida
- 87 Strongly Landlord-Friendly · R+3
- County
- — inherits STATE
- City
- — inherits STATE
ZIP-level market 32040
- Home prices YoY
- -10.6%
- Active inventory
- 64
- Price-to-rent
- 8.4×
Monthly cashflow live
- Estimated rent
- $2,629 medium interval (Pro) →
- Mortgage (P&I)
- −$1,390
- Tax est. 1.5%
- −$331 /mo · $3,975/yr
- Insurance
- −$110
- HOA
- −$0
- Vacancy / Maint / Mgmt
- −$552
- Net cashflow
- $245
Break-even live
Sensitivity live
| Price | -10% $429 | -5% $337 | +0% $245 | +5% $154 | +10% $62 |
|---|---|---|---|---|---|
| Rent | -10% $38 | -5% $142 | +0% $245 | +5% $349 | +10% $453 |
| Rate | -1.0pp $379 | -0.5pp $313 | base $245 | +0.5pp $177 | +1.0pp $107 |
UW: 25.0% down · 7.5% · 30yr · 1.5% tax · 5.0% vac · 8.0% maint · 8.0% mgmt
Financing live
Cash to close
- Down payment
- $66,250
- Closing costs
- $7,950
- Reserves months
- —
- Total cash needed
- —
Loan-product check · same deal, 3 products live
Conventional
25% down · 7.5% · 30yr
- Down + closing
- —
- Monthly P&I
- —
- Monthly cashflow
- —
- DSCR
- —
- Eligible?
- —
Personal DTI + credit; lowest rate.
DSCR
20% down · 8.5% · 30yr
- Down + closing
- —
- Monthly P&I
- —
- Monthly cashflow
- —
- DSCR
- —
- Eligible?
- —
No personal income docs; deal must DSCR.
Hard money
10% down · 12.0% · 12mo
- Down + closing
- —
- Monthly P&I
- —
- Monthly cashflow
- —
- DSCR
- —
- Eligible?
- —
Short-term bridge; refi at stabilization.
Listing history 23 events
-
2026-06-22days on market $265,000 Active 84 DOM
-
2026-06-21days on market $265,000 Active 83 DOM
-
2026-06-19days on market $265,000 Active 81 DOM
-
2026-06-18days on market $265,000 Active 80 DOM
-
2026-06-17days on market $265,000 Active 79 DOM
-
2026-06-16days on market $265,000 Active 78 DOM
-
2026-06-15days on market $265,000 Active 77 DOM
-
2026-06-14days on market $265,000 Active 75 DOM
-
2026-06-12days on market $265,000 Active 74 DOM
-
2026-06-09days on market $265,000 Active 71 DOM
-
2026-06-08days on market $265,000 Active 70 DOM
-
2026-06-07days on market $265,000 Active 69 DOM
-
2026-06-05days on market $265,000 Active 66 DOM
-
2026-06-02days on market $265,000 Active 64 DOM
-
2026-06-01days on market $265,000 Active 63 DOM
-
2026-05-31days on market $265,000 Active 62 DOM
-
2026-05-30days on market $265,000 Active 61 DOM
-
2026-05-21price $265,000
-
2026-05-14price $270,000
-
2026-05-11status Active
-
2026-05-07status Pending
-
2026-04-24price $275,000
-
2026-03-27$285,000 Active
ⓘ Source: listings_history table (triggers on properties + properties_extension) + one-shot
backfill from property_details.listing_events for pre-trigger history.
Nearby sold comps map
Loading sold comps map…
Walkable amenities ~0.75 mi
Loading nearby amenities…
Taxation est. · year 1
- Rental income
- $31,546
- − Mortgage interest
- −$14,844
- − Property taxes
- −$3,975
- − Insurance
- −$1,325
- − Repairs & maintenance
- −$2,524
- − Management
- −$2,524
- − Depreciation
- −$7,709
- Taxable loss
- −$1,355
- Est. tax savings @ 24.0%
- +$325
- After-tax cash flow
- $3,270/yr
For passive investors: Depreciation is non-cash, so a rental often shows a tax loss while cash-flowing — sheltering income. Rental losses are passive: they offset passive income freely, and up to $25,000/yr can offset ordinary (W-2) income if you actively participate and your MAGI is under $100k (phasing out to $0 by $150k); unused losses carry forward. On sale, claimed depreciation is recaptured at up to 25%, and gains may owe capital-gains tax (a 1031 exchange can defer both). Figures are a year-1 estimate at your 24.0% rate — not tax advice; consult a CPA.
Condition & rehab AI · 11 photos
This manufactured home is in good condition with recent updates, and has a good curb appeal. It is move-in ready and would benefit from some exterior painting and landscaping to further enhance its value.
Value-add opportunities
- Resale Painting the exterior siding and trim — Fresh paint can enhance the home's curb appeal and make it more attractive to potential buyers.
- Resale Landscaping the front yard — A well-maintained front yard can improve the home's curb appeal and make it more attractive to potential buyers.
- Resale Upgrading the kitchen appliances — Modern appliances can make the kitchen more functional and attractive to potential buyers.
- Both Adding a deck or patio — A deck or patio can increase the home's livable space and add value for both resale and rental.
Renovation cost estimate screening
Value-add ROI direction
- Resale Painting the exterior siding and trim — Fresh paint can enhance the home's curb appeal and make it more attractive to potential buyers. ↑
- Resale Landscaping the front yard — A well-maintained front yard can improve the home's curb appeal and make it more attractive to potential buyers. ↑
- Resale Upgrading the kitchen appliances — Modern appliances can make the kitchen more functional and attractive to potential buyers. ↑
- Both Adding a deck or patio — A deck or patio can increase the home's livable space and add value for both resale and rental. ↑
ⓘ Cost ranges are severity-bucket heuristics (US national rule-of-thumb). Get contractor quotes + a written scope before underwriting a rehab budget.
Schools (NCES district)
- District
- Baker
- NCES district ID
- 1200060
- Math proficiency
- 53% ▼ -6.00%
- Reading proficiency
- 49% ▼ -3.00%
- Median HH income
- $50,301
- Composite
- 43.67/100
- National rank
- #2958
- State rank
- #28 of 73 in FL
Livability — Glen St. Mary
No livability data for this city. (Only ~50 U.S. cities are tracked.)
Census & demographics
- Population (ZIP)
- 8,754
Population outlook (Baker County) Hauer SSP2
- Today (2025)
- 27,607 people
- By 2030
- 27,452 · -0.6%
- By 2040
- 26,637 · -3.5%
- By 2050
- 25,103 · -9.1%
- By 2075
- 19,576 · -29.1%
- By 2100
- 11,664 · -57.7%
Race, ethnicity, and origin ACS 2023
- Neighborhood character
- Predominantly White (88%)
- Race & ethnicity
- White 88% Two or more races 8% Hispanic / Latino 3% Black 3%
- Common ancestry
- Serbian 3% Slovak 2% Lithuanian 1%
- Foreign-born
- 1% · Canada
- Languages at home
- 98% English-only · Spanish 1% French/Haitian/Cajun 1%
Political lean MEDSL · Baker
- 2024 margin
- Solid R (+73.1) · D 13.2% · R 86.3%
- 2008→2024 swing
- -15.7pp toward R · 2008: -57.4pp · 2024: -73.1pp
- All cycles
- 2024: R+73.1 2020: R+70.2 2016: R+64.8 2012: R+58.6 2008: R+57.4
Not yet ingested
- Civics
- —
Market trends
- HPI YoY
- ▼ -25.72%
- Current HPI
- 216.151
- Rent YoY
- —
- Metro
- —
- State GDP YoY
- ▲ 3.28%
- F500 in state
- 36
Industry mix (Fortune 500 HQ in FL)
| Industry | F500 HQs | Revenue |
|---|---|---|
| Industrial Technology | 2 | $29B |
|
||
| Insurance | 2 | $17B |
|
||
| Retail | 1 | $60B |
|
||
| Technology Distribution | 1 | $58B |
|
||
| Homebuilding | 1 | $35B |
|
||
| Technology Manufacturing | 1 | $35B |
|
||
Price history
-7.0% since first listed6 events — show timeline
- 2026-05-21 Price Changed $265,000 realMLS
- 2026-05-14 Price Changed $270,000 realMLS
- 2026-05-11 Relisted — realMLS
- 2026-05-07 Pending — realMLS
- 2026-04-24 Price Changed $275,000 realMLS
- 2026-03-27 Listed $285,000 realMLS
Cash-flow waterfall
monthlySold comps — $/sqft
last 12 mo · ≤1 miLoading sold comps…