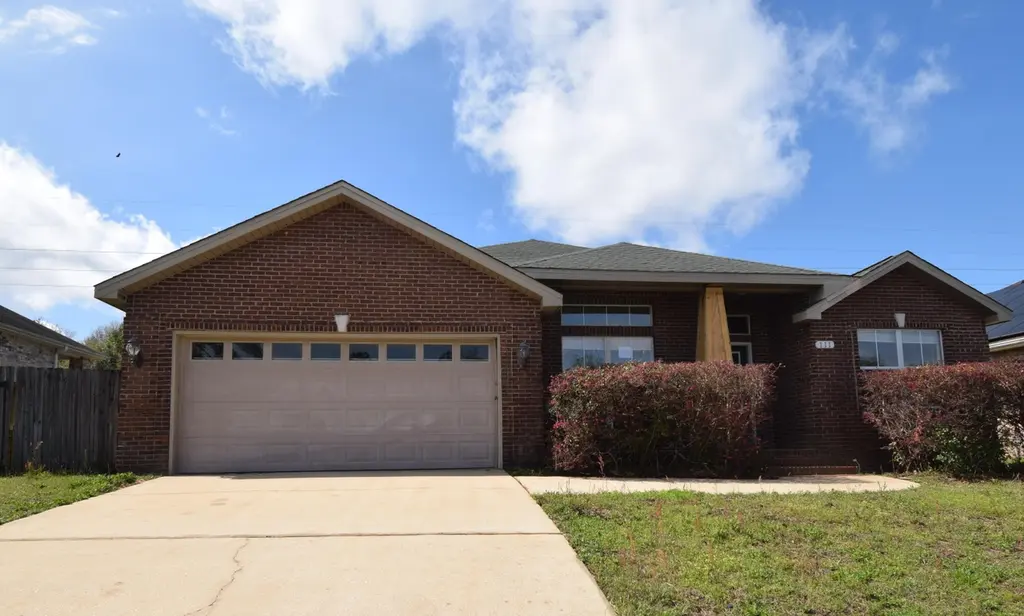
111 Trailwood Ln · Crestview, FL
Flood risk 1/10 · Minimal
- FEMA flood zone
- X (unshaded)
- Chance of flooding over 30 yrs
- 0.0%
- Est. flood insurance / yr
- $507 – $1,088
Fire risk 4/10 · Minor
- Est. fire insurance / yr
- $947 – $1,759
Heat risk 9/10 · Severe
- Hot days now (above 107°F)
- 7 days/yr
- Hot days in 30 yrs
- 21 days/yr
Wind risk 9/10 · Severe
- Chance of severe wind over 30 yrs
- 99.0%
Air-quality risk 2/10 · Minimal
- Unhealthy air days now
- 1 days/yr
- Unhealthy air days in 30 yrs
- 1 days/yr
Risk factors via First Street. Map © Google.
Why this score? — see what drove the D grade
The composite is a weighted blend of 9 inputs, each scored 0–100. Each bar is that input's sub-score; the figure is the points it added to the 100-point composite (weight × sub-score).
- ARV discount +15.0/15.0
- Cash flow +8.4/30.0
- Schools +5.2/10.0
- Livability +3.8/5.0
- 1% rule +3.0/10.0
- Rent growth +2.5/5.0
- Condition / age +2.5/5.0
- DSCR +2.3/10.0
- Appreciation +0.0/10.0
$254,900
🖨 Deal sheet 📄 Offer letter ✓ Due diligence
Listing remarks MLS
REO All brick 3ed /2 bath home with 2 car garage and level backyard in Trailwood Estates. Originally built as a model home by quality builder Tracy Acree, this well designed floor plan offers just under 2,000 sq ft on a quarter acre lot in the heart of Crestview with easy access to shopping, dining, medical facilities, and Duke Field. Features include granite countertops, maple cabinets with cherry finish, stainless appliances, breakfast bar, fireplace, crown molding, and 10' ceilings in main living areas. Spacious master suite with tray ceiling, walk in closet, jacuzzi tub, and separate shower. Split bedroom layout for privacy. Bank recently installed brand new carpet in all bedrooms and the front living room. Covered lanai and oversized garage with attic storage. Call to take a look.
Key facts
- Level backyard
- Stainless appliances
- Maple cabinets
Tags
Neighborhood map
What this means for you Summary
Snapshot
- This is a 4-bed/2.0-bath single-family listed at $255k.
Deal economics
- At list price, monthly cash flow is $-228 ($-3k/yr) — negative.
- To cash-flow at today's rent, offer at most $215k (15.8% below list).
- To meet the 1% rule (rent ≥ 1% of price), the offer needs to be $203k (20.5% below list).
- Recommended offer: $203k (20.5% below list) — sets the bar for 1% rule.
Location & tenants
- Location reads 75/100 on livability (#252 in FL, #3,858 nationally) — a middle-class / working-renter tenant base. Strengths: cost of living A+, housing A+, health & safety A+; Watch: employment D, amenities F, commute F.
- Okaloosa (other): math 60% / reading 60% proficiency, ranked #12 of 73 in FL (top 16%) — acceptable for families but not a draw, mixed tenant base, ~2y average lease.
- Market conditions: Rents flat; 521 active listings in the ZIP; 13 comparable units currently listed for rent nearby; rentals lingering (median 44d on market — plan ~5-8 weeks vacancy on turnover, expect pricing pressure); 54% of comp listings sitting > 30 days — soft ceiling on asking rent; 1,268 units permitted in Okaloosa County in 2024 (175 in 5+ unit buildings).
- This rent runs 33% of the median local income ($74k/yr) — at the standard rent-burdened threshold; future hikes will face affordability resistance.
Forward outlook
- Local home prices are declining (-3.0%/yr); year-one equity from $2k of loan paydown is wiped out by about $8k of value loss. Plan a longer hold.
- Okaloosa County population projected at +37% by 2050 — long-run rental-demand tailwind backs the buy-and-hold thesis.
Negotiation context
- It's been on market 73 days — a 6% lower offer ($240k) is reasonable based on typical stale-listing flexibility.
- 6 sale attempts since 20y ago with the ask held roughly flat each time — persistent listings suggest the price (not the market) is what's stuck; bring a comps-based counter.
- Current owner paid $185k; 38% above their basis — modest negotiation headroom, anchor on the comps not their cost.
Risks & watch-outs
- Climate carrying-cost: severe wind risk, 99% chance of damaging wind over 30y; extreme-heat days projected 7→21/yr by 2055 (HVAC capex compounding) — expect insurance premiums to compound above CPI over the hold.
Questions for the listing agent
- What do current leases actually rent for vs. the listed asking? Can we see a recent rent roll and the last 12 months of T-12 income?
- It's been on market 73 days. Have you received any prior offers? Is the seller open to a 20% concession, seller financing, or rate buy-down credit?
- Why hasn't it sold? Are there any deal-killer items the seller is aware of (foundation, flood, title, zoning, code violations)?
- Is there a deadline driving the sale (1031 exchange, divorce, estate, relocation)? That informs how much negotiation room exists.
- Schools are B-rated — typically a magnet for longer-tenancy family renters. What's the average tenant stay here, and is there a school-zone premium baked into asking?
- The area grade is low — what's the realistic commute time and amenity access for the typical tenant pool here? Any planned neighborhood developments (good or bad) we should know about?
- What's the average days-on-market for RENTAL listings here right now (not sales)? A rising rental-DOM trend means longer vacancies and softer asking-rent achievability than the comps imply.
- What's the recent tenant-quality profile in this submarket — average credit score on applications, eviction rate, late-payment / NSF rate, and stable-employment percentage? A property-management company in the area should have these aggregated.
- How much new for-sale + rental construction is in the pipeline within 1–3 miles? Heavy new supply typically softens prices + rents 12–24 months out; constrained supply supports both.
Investment metrics
- 1% rule
- 0.80% ✗
- Cap rate
- 5.22%
- Cash-on-cash
- -3.84%
- DSCR
- 0.83
- GRM
- 10.5
CMA / ARV
- ARV (median comp)
- $330,744
- List price
- $254,900
- Delta
- -22.93%
- Verdict
- UNDERPRICED
- Comps
- 20 within 1.0 mi
Show comp detail 12 sales within ~0.75 mi
| Address | Dist | Beds/Ba | Sqft | Sold | Price | $/sf | Match |
|---|---|---|---|---|---|---|---|
| 409 Serene Ct | 0.16mi | 3/2.0 (-1) | 1,905 (-3%) | 3mo | $306,000 | $161 | 80 |
| 212 Eleases Xing | 0.07mi | 3/2.0 (-1) | 2,205 (+13%) | 4mo | $330,000 | $150 | 67 |
| 5370 Wyndell Cir | 0.47mi | 4/2.0 | 1,830 (-6%) | 2mo | $340,000 | $186 | 66 |
| 201 Wainwright Dr | 0.64mi | 4/2.5 | 2,003 (+2%) | 1mo | $214,000 | $107 | 63 |
| 499 Eisenhower Dr | 0.56mi | 5/2.5 (+1) | 1,980 (+1%) | 2mo | $279,000 | $141 | 63 |
| 498 Eisenhower Dr | 0.57mi | 5/3.0 (+1) | 1,962 (+0%) | 3mo | $240,000 | $122 | 62 |
| 104 Lear Ct | 0.54mi | 3/2.5 (-1) | 1,818 (-7%) | 2mo | $274,900 | $151 | 54 |
| 5362 WYNDELL Cir | 0.39mi | 4/2.0 | 2,247 (+15%) | 6mo | $455,000 | $202 | 52 |
| 5613 Thatcher Rd | 0.73mi | 4/2.0 | 1,799 (-8%) | 2mo | $309,900 | $172 | 51 |
| 3066 Craig Ter | 0.67mi | 3/2.0 (-1) | 2,130 (+9%) | 3mo | $450,000 | $211 | 47 |
| 113 Palmetto Dr | 0.56mi | 3/2.5 (-1) | 2,224 (+14%) | 4mo | $279,000 | $125 | 41 |
| 308 Brannon Ct | 0.75mi | 3/2.5 (-1) | 1,672 (-15%) | 3mo | $287,000 | $172 | 31 |
Match score weights: distance 35% · size 25% · config 20% · recency 20%. Top-matched comps best support the ARV.
Projected returns pro-forma
-3.0% appreciation · 0.12% rent growth · sell at horizon
- IRR
- -26.1%
- Equity multiple
- 0.14×
- Total profit
- $-61,470
- Equity at exit
- $38,006
- IRR
- -37.0%
- Equity multiple
- -0.32×
- Total profit
- $-94,056
- Equity at exit
- $22,039
Cash invested: $71,372 (down + closing). Projections, not guarantees.
Landlord ↔ Tenant lean methodology
- Overall (STATE)
- 87 Strongly Landlord-Friendly
- State Florida
- 87 Strongly Landlord-Friendly · R+3
- County
- — inherits STATE
- City
- — inherits STATE
ZIP-level market 32539
- Home prices YoY
- -17.8%
- Rents YoY
- 0.1%
- Active inventory
- 521
- Price-to-rent
- 10.5×
Monthly cashflow live
- Estimated rent
- $2,027 high interval (Pro) →
- Mortgage (P&I)
- −$1,337
- Tax from tax record
- −$386 /mo · $4,636/yr
- Insurance
- −$106
- HOA
- −$0
- Vacancy / Maint / Mgmt
- −$426
- Net cashflow
- $-228
Break-even live
UW: 25.0% down · 7.5% · 30yr · 1.5% tax · 5.0% vac · 8.0% maint · 8.0% mgmt
Financing live
Cash to close
- Down payment
- $63,725
- Closing costs
- $7,647
- Reserves months
- —
- Total cash needed
- —
Loan-product check · same deal, 3 products live
Conventional
25% down · 7.5% · 30yr
- Down + closing
- —
- Monthly P&I
- —
- Monthly cashflow
- —
- DSCR
- —
- Eligible?
- —
Personal DTI + credit; lowest rate.
DSCR
20% down · 8.5% · 30yr
- Down + closing
- —
- Monthly P&I
- —
- Monthly cashflow
- —
- DSCR
- —
- Eligible?
- —
No personal income docs; deal must DSCR.
Hard money
10% down · 12.0% · 12mo
- Down + closing
- —
- Monthly P&I
- —
- Monthly cashflow
- —
- DSCR
- —
- Eligible?
- —
Short-term bridge; refi at stabilization.
Rent comps 13 comps
| Address | Beds | Baths | Sqft | Rent | $/sqft | DOM | Units | Dist |
|---|---|---|---|---|---|---|---|---|
| 815 Valley Rd Crestview, FL | 3.0 | 2.5 | 1373 | $1,550 | $1.13 | 43d | 1 | 0.14mi |
| 2942 Sholtz Ave Crestview, FL | 3.0 | 2.0 | 1266 | $1,600 | $1.26 | 43d | 1 | 0.23mi |
| 502 Hyde Park Dr Crestview, FL | 3.0 | 2.0 | 1302 | $1,795 | $1.38 | 13d | 1 | 0.28mi |
| 304 Strawbridge Dr Crestview, FL | 4.0 | 2.0 | 1650 | $1,850 | $1.12 | 13d | 1 | 0.56mi |
| 507 Eisenhower Dr Crestview, FL | 3.0 | 2.0 | 1809 | $2,200 | $1.22 | 43d | 1 | 0.56mi |
| 311 Dahlquist Dr Crestview, FL | 4.0 | 2.5 | 1770 | $2,050 | $1.16 | 21d | 1 | 0.58mi |
| 448 Eisenhower Dr Crestview, FL | 5.0 | 3.0 | 2019 | $2,550 | $1.26 | 43d | 1 | 0.61mi |
| 489 Eisenhower Dr Crestview, FL | 4.0 | 2.5 | 1919 | $2,095 | $1.09 | 43d | 1 | 0.64mi |
| 202 Wainwright Dr Crestview, FL | 4.0 | 2.5 | 2002 | $1,890 | $0.94 | 21d | 1 | 0.64mi |
| 812 Carlton St Crestview, FL | 3.0 | 2.5 | 1393 | $1,495 | $1.07 | 21d | 1 | 1.11mi |
| 149 Shady Ln Crestview, FL | 3.0 | 2.0 | 1680 | $2,000 | $1.19 | 43d | 1 | 1.24mi |
| 326 Dixie St Crestview, FL | 3.0 | 1.0 | 1386 | $1,400 | $1.01 | 43d | 1 | 1.46mi |
| 751 Amos St Unit B Crestview, FL | 3.0 | 2.5 | 2163 | $1,695 | $0.78 | 13d | 1 | 1.49mi |
Listing history 12 events
-
2026-04-23price $254,900 796-char remark
Show marketing remark (796 chars)
REO All brick 3ed /2 bath home with 2 car garage and level backyard in Trailwood Estates. Originally built as a model home by quality builder Tracy Acree, this well designed floor plan offers just under 2,000 sq ft on a quarter acre lot in the heart of Crestview with easy access to shopping, dining, medical facilities, and Duke Field. Features include granite countertops, maple cabinets with cherry finish, stainless appliances, breakfast bar, fireplace, crown molding, and 10' ceilings in main living areas. Spacious master suite with tray ceiling, walk in closet, jacuzzi tub, and separate shower. Split bedroom layout for privacy. Bank recently installed brand new carpet in all bedrooms and the front living room. Covered lanai and oversized garage with attic storage. Call to take a look.
-
2026-03-13$259,900 Active 796-char remark
Show marketing remark (796 chars)
REO All brick 3ed /2 bath home with 2 car garage and level backyard in Trailwood Estates. Originally built as a model home by quality builder Tracy Acree, this well designed floor plan offers just under 2,000 sq ft on a quarter acre lot in the heart of Crestview with easy access to shopping, dining, medical facilities, and Duke Field. Features include granite countertops, maple cabinets with cherry finish, stainless appliances, breakfast bar, fireplace, crown molding, and 10' ceilings in main living areas. Spacious master suite with tray ceiling, walk in closet, jacuzzi tub, and separate shower. Split bedroom layout for privacy. Bank recently installed brand new carpet in all bedrooms and the front living room. Covered lanai and oversized garage with attic storage. Call to take a look.
-
2012-10-25soldstatus $184,900
-
2012-10-25soldstatus $184,900
-
2012-01-01historical
-
2011-12-18$199,900
-
2011-12-18$199,900
-
2011-11-18$184,900
-
2007-10-31soldstatus $215,000
-
2007-10-31soldstatus $215,000
-
2006-09-12$229,900
-
2006-09-12$229,900
ⓘ Source: listings_history table (triggers on properties + properties_extension) + one-shot
backfill from property_details.listing_events for pre-trigger history.
Tax reassessment forecast FL · Resets to sale price
- Current annual tax
- $4,636 · $386/mo
- Projected year-2 tax
- $4,636 · $386/mo
- Expected delta
- $0/yr ($0/mo · 0.0%)
ⓘ Screening estimate from a state-policy table — verify with the county assessor before closing.
Climate risk First Street
- Flood 1/10 Low FEMA zone X (unshaded) · 0% chance over 30 yrs
- Wildfire 4/10 Moderate
- Heat 9/10 Extreme 7 d/yr ≥107°F today · 21 d/yr by 30 yrs out
- Wind 9/10 Extreme 99% chance of damaging wind over 30 yrs
- Air quality 2/10 Low 1 unhealthy d/yr today · 1 by 30 yrs out
Nearby sold comps map
Loading sold comps map…
Walkable amenities ~0.75 mi
Loading nearby amenities…
Taxation est. · year 1
- Rental income
- $24,322
- − Mortgage interest
- −$14,278
- − Property taxes
- −$4,636
- − Insurance
- −$1,274
- − Repairs & maintenance
- −$1,946
- − Management
- −$1,946
- − Depreciation
- −$7,415
- Taxable loss
- −$7,174
- Est. tax savings @ 24.0%
- +$1,722
- After-tax cash flow
- $-1,015/yr
For passive investors: Depreciation is non-cash, so a rental often shows a tax loss while cash-flowing — sheltering income. Rental losses are passive: they offset passive income freely, and up to $25,000/yr can offset ordinary (W-2) income if you actively participate and your MAGI is under $100k (phasing out to $0 by $150k); unused losses carry forward. On sale, claimed depreciation is recaptured at up to 25%, and gains may owe capital-gains tax (a 1031 exchange can defer both). Figures are a year-1 estimate at your 24.0% rate — not tax advice; consult a CPA.
Schools (NCES district)
- District
- Okaloosa
- NCES district ID
- 1201380
- Math proficiency
- 60% ▼ -12.00%
- Reading proficiency
- 60% ▼ -4.00%
- Median HH income
- $55,601
- Composite
- 51.62/100
- National rank
- #1705
- State rank
- #12 of 73 in FL
Livability — Crestview
- Score
- 75/100
- State rank
- #252
- US rank
- #3858
Category grades
Schools grade is shown separately in the Schools card above.
Census & demographics
- Census place
- Crestview, FL
- County
- Okaloosa County · 194,352 people
- City population
- 58,889
- Metro
- Crestview-Fort Walton Beach-Destin, FL
- Population (ZIP)
- 33,290
- Household income
- $74,369
- Rent vs Own
- Severe rent burden
- 371.0
Population outlook (Okaloosa County) Hauer SSP2
- Today (2025)
- 235,133 people
- By 2030
- 253,483 · +7.8%
- By 2040
- 289,537 · +23.1%
- By 2050
- 322,954 · +37.3%
- By 2075
- 399,624 · +70.0%
- By 2100
- 425,311 · +80.9%
Race, ethnicity, and origin ACS 2023
- Neighborhood character
- Predominantly White (73%)
- Race & ethnicity
- White 73% Black 12% Two or more races 8% Hispanic / Latino 7% Asian 1%
- Hispanic origin (detail)
- Mexican 3% Puerto Rican 2%
- Common ancestry
- Lithuanian 4% Iranian 2% Romanian 2%
- Foreign-born
- 3% · Canada
- Languages at home
- 94% English-only · Spanish 3% Russian/Polish/Slavic 1% Other Asian/Pacific 1%
Political lean MEDSL · Okaloosa
- 2024 margin
- Solid R (+42.4) · D 28.2% · R 70.7% · Other 1.1%
- 2008→2024 swing
- +2.5pp toward D · 2008: -44.9pp · 2024: -42.4pp
- All cycles
- 2024: R+42.4 2020: R+39.1 2016: R+47.8 2012: R+49.4 2008: R+44.9
Not yet ingested
- Civics
- —
Market trends
- HPI YoY
- ▼ -56.52%
- Current HPI
- 261.1557
- Rent YoY
- ▲ 0.12%
- Metro
- Crestview-Fort Walton Beach-Destin, FL
- State GDP YoY
- ▲ 3.28%
- F500 in state
- 36
Industry mix (Fortune 500 HQ in FL)
| Industry | F500 HQs | Revenue |
|---|---|---|
| Industrial Technology | 2 | $29B |
|
||
| Insurance | 2 | $17B |
|
||
| Retail | 1 | $60B |
|
||
| Technology Distribution | 1 | $58B |
|
||
| Homebuilding | 1 | $35B |
|
||
| Technology Manufacturing | 1 | $35B |
|
||
Price history
+10.9% since first listed12 events — show timeline
- 2026-04-23 Price Changed $254,900 ECAR
- 2026-03-13 Listed $259,900 ECAR
- 2012-10-25 Sold (MLS) $184,900 NAMLS
- 2012-10-25 Sold (MLS) $184,900 ECAR
- 2012-01-01 Listing Removed — NAMLS
- 2011-12-18 Listed $199,900 NAMLS
- 2011-12-18 Listed $199,900 ECAR
- 2011-11-18 Listed $184,900 NAMLS
- 2007-10-31 Sold (MLS) $215,000 ECAR
- 2007-10-31 Sold (MLS) $215,000 NAMLS
- 2006-09-12 Listed $229,900 ECAR
- 2006-09-12 Listed $229,900 NAMLS
Property tax history
+13.1%/yrLatest (2025): $4,636 · +3.2% YoY. Source: county tax records.
Cash-flow waterfall
monthlySold comps — $/sqft
last 12 mo · ≤1 miLoading sold comps…