17537 Northview Dr · Urbandale, IA
Flood risk No data
- FEMA flood zone
- —
- Chance of flooding over 30 yrs
- —
- Est. flood insurance / yr
- —
Fire risk No data
- Est. fire insurance / yr
- —
Heat risk No data
- Hot days now (above threshold)
- —
- Hot days in 30 yrs
- —
Wind risk No data
- Chance of severe wind over 30 yrs
- —
Air-quality risk No data
- Unhealthy air days now
- —
- Unhealthy air days in 30 yrs
- —
Risk factors via First Street. Map © Google.
Why this score? — see what drove the D- grade
The composite is a weighted blend of 9 inputs, each scored 0–100. Each bar is that input's sub-score; the figure is the points it added to the 100-point composite (weight × sub-score).
- ARV discount +13.1/15.0
- Appreciation +7.4/10.0
- Schools +7.1/10.0
- Livability +4.5/5.0
- Rent growth +2.5/5.0
- Condition / age +2.5/5.0
- Cash flow +1.1/30.0
- 1% rule +0.0/10.0
- DSCR +0.0/10.0
$674,900
🖨 Deal sheet 📄 Offer letter ✓ Due diligence
Listing remarks
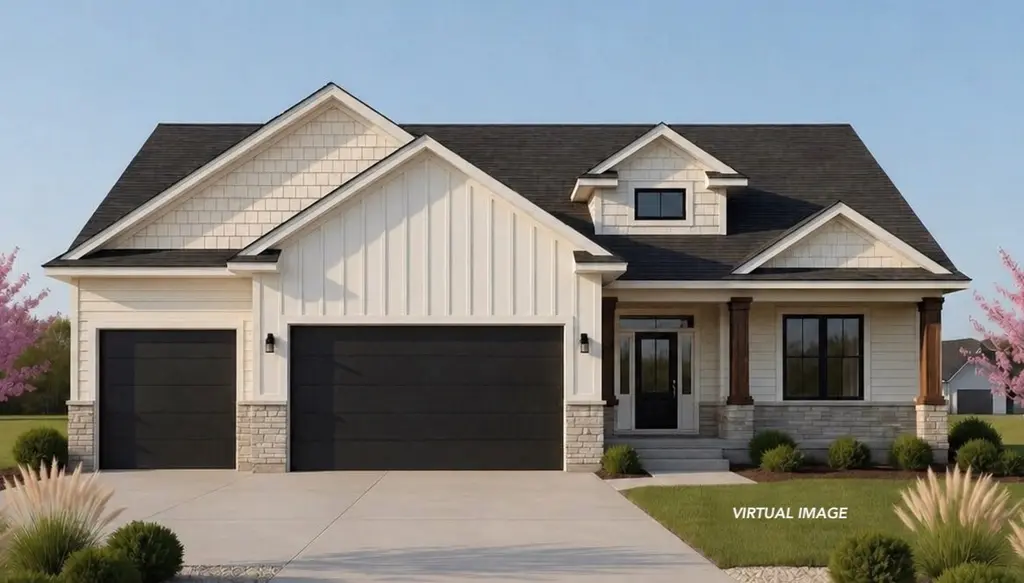
FB Homes continues to build upon their reputation for beautiful homes! Situated in the popular Bentley Ridge development, this classic ranch home has over 3,200sf of quality finish with nearly 1,900sf on the main floor! This spacious property includes 5 bedrooms and 3 full bathrooms. The main floor is appointed with quality LVP flooring, large windows in every room, a bright great room with a stone fireplace feature wall, super kitchen with high-quality cabinetry and quartz counter tops, walk-in pantry with garage pass-through door, and a dining area that opens to your large, maintenance-free covered deck, with steps down to an additional open patio. The main floor has an awesome entertainm
Key facts
- Quality lvp flooring
- Quartz counter tops
- Walk-in pantry
Tags
Property features AI
Finance
- HOA & community: Homeowners association (Bentley Ridge HOA / Accurate Development); HOA fee $150 annually
Exterior
- Parking: Attached three-car garage
- Security: Smoke detectors
- Utilities: Public water; Public sewer
- Home design: Single-story home; New construction; Cement siding with stone accents; Asphalt shingle roof; Built by FB Homes LLC; Rectangular lot on concrete road; Property zoned R
- Construction: Poured foundation; Below-grade finished area included
- Exterior features: Deck; Covered and open patios; Sprinkler/irrigation system
Interior
- Kitchen: Dishwasher; Microwave; Refrigerator; Stove
- Bedrooms: 3 main-level bedrooms
- Flooring: Carpet; Tile
- Bathrooms: 3 full bathrooms
- Heating & cooling: Forced air heating (natural gas); Central air conditioning
- Interior features: Wet bar; Dining area; Finished basement with egress windows; 2 fireplaces (electric and gas, vented)
- Laundry & utility: Main-level laundry
Neighborhood map
What this means for you Summary
Snapshot
- This is a 5-bed/3.0-bath single-family listed at $675k.
Deal economics
- At list price, monthly cash flow is $-3k ($-33k/yr) — negative.
- To cash-flow at today's rent, offer at most $278k (58.9% below list).
- To meet the 1% rule (rent ≥ 1% of price), the offer needs to be $244k (63.8% below list).
- Recommended offer: $244k (63.8% below list) — sets the bar for 1% rule.
- Cap rate 1.4% vs local median 2.4% in Urbandale — below-typical yield; the buyer is paying a premium for something (appreciation thesis, condition, location) that the cap rate doesn't capture.
Location & tenants
- Location reads 90/100 on livability (#4 in IA, #69 nationally) — a professional / high-income tenant draw. Strengths: schools A+, crime A+, amenities A+; Watch: commute F.
- Waukee Community School District (suburban): math 80% / reading 79% proficiency, ranked #14 of 289 in IA (top 5%) — strong family-tenant draw, lease renewals of 3-5y typical; only 11% free/reduced lunch — higher-income household profile.
- Market conditions: 378 active listings in the ZIP; 1 comparable units currently listed for rent nearby; high-income renter base; 1,503 units permitted in Dallas County in 2024 (630 in 5+ unit buildings).
- This rent is only 17% of the median local income ($176k/yr) — well below the 30% rent-burden line; pricing power to push rent on renewal without tenant pushback.
Forward outlook
- In year one you build about $37k of equity ($5k loan paydown + $32k appreciation (4.8% local appreciation)).
- Dallas County population projected at +74% by 2050 — long-run rental-demand tailwind backs the buy-and-hold thesis.
- By year 2, paydown + projected appreciation supports a ~$60k cash-out refi (75% LTV) — recoverable capital for the next deal without selling this one.
Negotiation context
- It's been on market 52 days — a 3% lower offer ($655k) is reasonable based on typical stale-listing flexibility.
Questions for the listing agent
- What do current leases actually rent for vs. the listed asking? Can we see a recent rent roll and the last 12 months of T-12 income?
- It's been on market 52 days. Have you received any prior offers? Is the seller open to a 64% concession, seller financing, or rate buy-down credit?
- What does the HOA fee cover, when was the last increase, and are there any pending special assessments or reserve-fund shortfalls?
- Is there a deadline driving the sale (1031 exchange, divorce, estate, relocation)? That informs how much negotiation room exists.
- Schools are A-rated — typically a magnet for longer-tenancy family renters. What's the average tenant stay here, and is there a school-zone premium baked into asking?
- The area grade is low — what's the realistic commute time and amenity access for the typical tenant pool here? Any planned neighborhood developments (good or bad) we should know about?
- What's the average days-on-market for RENTAL listings here right now (not sales)? A rising rental-DOM trend means longer vacancies and softer asking-rent achievability than the comps imply.
- What's the recent tenant-quality profile in this submarket — average credit score on applications, eviction rate, late-payment / NSF rate, and stable-employment percentage? A property-management company in the area should have these aggregated.
- How much new for-sale + rental construction is in the pipeline within 1–3 miles? Heavy new supply typically softens prices + rents 12–24 months out; constrained supply supports both.
Investment metrics
- 1% rule
- 0.36% ✗
- Cap rate
- 1.41%
- Cash-on-cash
- -17.44%
- DSCR
- 0.22
- GRM
- 23.0
CMA / ARV
- ARV (median comp)
- $770,200
- List price
- $674,900
- Delta
- -12.37%
- Verdict
- UNDERPRICED
- Comps
- 20 within 1.0 mi
Show comp detail 12 sales within ~0.75 mi
| Address | Dist | Beds/Ba | Sqft | Sold | Price | $/sf | Match |
|---|---|---|---|---|---|---|---|
| 17400 North Valley Dr | 0.18mi | 5/3.0 | 1,864 (-2%) | 4mo | $687,500 | $369 | 86 |
| 17418 North Valley Dr | 0.15mi | 4/4.0 (-1) | 1,896 (+0%) | 2mo | $699,900 | $369 | 83 |
| 17511 N Valley Dr | 0.09mi | 5/3.5 | 2,075 (+10%) | 2mo | $961,352 | $463 | 76 |
| 17308 Northview Dr | 0.11mi | 4/3.5 (-1) | 1,719 (-9%) | 2mo | $630,000 | $366 | 71 |
| 4664 177th St | 0.34mi | 4/3.0 (-1) | 1,800 (-5%) | 2mo | $534,990 | $297 | 70 |
| 17151 Plum Dr | 0.25mi | 4/3.5 (-1) | 1,762 (-7%) | 1mo | $479,500 | $272 | 69 |
| 5114 168th St | 0.52mi | 4/3.0 (-1) | 2,053 (+8%) | 1mo | $358,990 | $175 | 56 |
| 5104 168th St | 0.53mi | 5/4.0 | 2,053 (+8%) | 3mo | $413,990 | $202 | 55 |
| 4650 178th St | 0.41mi | 4/3.0 (-1) | 1,617 (-15%) | 2mo | $599,900 | $371 | 50 |
| 16804 Plum Dr | 0.52mi | 4/3.0 (-1) | 1,635 (-14%) | 2mo | $369,990 | $226 | 46 |
| 5101 169th St | 0.50mi | 4/3.0 (-1) | 1,635 (-14%) | 3mo | $359,990 | $220 | 46 |
| 4601 178th St | 0.60mi | 4/3.0 (-1) | 1,659 (-12%) | 2mo | $639,000 | $385 | 45 |
Match score weights: distance 35% · size 25% · config 20% · recency 20%. Top-matched comps best support the ARV.
Projected returns pro-forma
4.81% appreciation · 3.0% rent growth · sell at horizon
- IRR
- -2.2%
- Equity multiple
- 0.86×
- Total profit
- $-26,710
- Equity at exit
- $374,586
- IRR
- 2.1%
- Equity multiple
- 1.39×
- Total profit
- $74,267
- Equity at exit
- $640,069
Cash invested: $188,972 (down + closing). Projections, not guarantees.
Landlord ↔ Tenant lean methodology
- Overall (STATE)
- 83 Strongly Landlord-Friendly
- State Iowa
- 83 Strongly Landlord-Friendly · R+6
- County
- — inherits STATE
- City
- — inherits STATE
ZIP-level market 50323
- Home prices YoY
- 2.5%
- Active inventory
- 378
- Price-to-rent
- 23.0×
Monthly cashflow live
- Estimated rent
- $2,444 medium interval (Pro) →
- Mortgage (P&I)
- −$3,539
- Tax est. 1.5%
- −$844 /mo · $10,124/yr
- Insurance
- −$281
- HOA
- −$13
- Vacancy / Maint / Mgmt
- −$513
- Net cashflow
- $-2,746
Break-even live
UW: 25.0% down · 7.5% · 30yr · 1.5% tax · 5.0% vac · 8.0% maint · 8.0% mgmt
Financing live
Cash to close
- Down payment
- $168,725
- Closing costs
- $20,247
- Reserves months
- —
- Total cash needed
- —
Loan-product check · same deal, 3 products live
Conventional
25% down · 7.5% · 30yr
- Down + closing
- —
- Monthly P&I
- —
- Monthly cashflow
- —
- DSCR
- —
- Eligible?
- —
Personal DTI + credit; lowest rate.
DSCR
20% down · 8.5% · 30yr
- Down + closing
- —
- Monthly P&I
- —
- Monthly cashflow
- —
- DSCR
- —
- Eligible?
- —
No personal income docs; deal must DSCR.
Hard money
10% down · 12.0% · 12mo
- Down + closing
- —
- Monthly P&I
- —
- Monthly cashflow
- —
- DSCR
- —
- Eligible?
- —
Short-term bridge; refi at stabilization.
Rent comps 1 comps
| Address | Beds | Baths | Sqft | Rent | $/sqft | DOM | Units | Dist |
|---|---|---|---|---|---|---|---|---|
| 16008 Springbrook Trl Urbandale, IA | 5.0 | 3.0 | 1670 | $2,900 | $1.74 | 43d | 1 | 1.16mi |
HOA detail
- Monthly dues
- $13 · $156/yr
Listing history 17 events
-
2026-06-18days on market $674,900 Active 52 DOM
-
2026-06-17days on market $674,900 Active 51 DOM
-
2026-06-16days on market $674,900 Active 50 DOM
-
2026-06-15days on market $674,900 Active 49 DOM
-
2026-06-14days on market $674,900 Active 47 DOM
-
2026-06-13days on market $674,900 Active 46 DOM
-
2026-06-10days on market $674,900 Active 44 DOM
-
2026-06-09days on market $674,900 Active 43 DOM
-
2026-06-08days on market $674,900 Active 42 DOM
-
2026-06-07days on market $674,900 Active 41 DOM
-
2026-06-05days on market $674,900 Active 38 DOM
-
2026-06-03days on market $674,900 Active 37 DOM
-
2026-06-02days on market $674,900 Active 36 DOM
-
2026-06-01days on market $674,900 Active 35 DOM
-
2026-05-31days on market $674,900 Active 34 DOM
-
2026-05-31days on market $674,900 Active 33 DOM
-
2026-04-27$674,900 Active 1173-char remark
ⓘ Source: listings_history table (triggers on properties + properties_extension) + one-shot
backfill from property_details.listing_events for pre-trigger history.
Nearby sold comps map
Loading sold comps map…
Walkable amenities ~0.75 mi
Loading nearby amenities…
Taxation est. · year 1
- Rental income
- $29,329
- − Mortgage interest
- −$37,805
- − Property taxes
- −$10,124
- − Insurance
- −$3,374
- − Repairs & maintenance
- −$2,346
- − Management
- −$2,346
- − HOA
- −$156
- − Depreciation
- −$19,633
- Taxable loss
- −$46,456
- Est. tax savings @ 24.0%
- +$11,149
- After-tax cash flow
- $-21,806/yr
For passive investors: Depreciation is non-cash, so a rental often shows a tax loss while cash-flowing — sheltering income. Rental losses are passive: they offset passive income freely, and up to $25,000/yr can offset ordinary (W-2) income if you actively participate and your MAGI is under $100k (phasing out to $0 by $150k); unused losses carry forward. On sale, claimed depreciation is recaptured at up to 25%, and gains may owe capital-gains tax (a 1031 exchange can defer both). Figures are a year-1 estimate at your 24.0% rate — not tax advice; consult a CPA.
Schools (NCES district)
- District
- Waukee Community School District
- NCES district ID
- 1930510
- Math proficiency
- 80% ▼ -6.00%
- Reading proficiency
- 79% ▼ -5.00%
- Median HH income
- $88,580
- Composite
- 70.94/100
- National rank
- #245
- State rank
- #14 of 289 in IA
Livability — Urbandale
- Score
- 90/100
- State rank
- #4
- US rank
- #69
Category grades
Schools grade is shown separately in the Schools card above.
Census & demographics
- Census place
- Urbandale, IA
- County
- Polk County · 453,298 people
- City population
- 49,196
- Metro
- Des Moines-West Des Moines, IA
- Population (ZIP)
- 17,265
- Household income
- $175,944
- Rent vs Own
- Severe rent burden
- 63.0
Population outlook (Dallas County) Hauer SSP2
- Today (2025)
- 111,904 people
- By 2030
- 127,807 · +14.2%
- By 2040
- 160,576 · +43.5%
- By 2050
- 194,154 · +73.5%
- By 2075
- 271,895 · +143.0%
- By 2100
- 326,525 · +191.8%
Race, ethnicity, and origin ACS 2023
- Neighborhood character
- Predominantly White (86%)
- Race & ethnicity
- White 86% Asian 6% Two or more races 4% Hispanic / Latino 3% Black 2%
- Common ancestry
- Portuguese 6% Iranian 5% Lithuanian 2%
- Foreign-born
- 7% · Canada, China, Philippines
- Languages at home
- 92% English-only · Russian/Polish/Slavic 2% Chinese 1% Spanish 1%
Political lean MEDSL · Dallas
- 2024 margin
- Toss-up / Even · D 46.9% · R 51.7% · Other 1.4%
- 2008→2024 swing
- +0.8pp no change · 2008: -5.5pp · 2024: -4.8pp
- All cycles
- 2024: R+4.8 2020: R+2.0 2016: R+9.6 2012: R+11.8 2008: R+5.5
Not yet ingested
- Civics
- —
Market trends
- HPI YoY
- ▲ 4.81%
- Current HPI
- 199.789
- Rent YoY
- —
- Metro
- Des Moines-West Des Moines, IA
- State GDP YoY
- ▲ 2.48%
- F500 in state
- 4
Industry mix (Fortune 500 HQ in IA)
| Industry | F500 HQs | Revenue |
|---|---|---|
| Financial Services | 1 | $16B |
|
||
| Retail / Convenience | 1 | $15B |
|
||
Price history
1 event — show timeline
- 2026-04-27 Listed $674,900 DMMLS
Cash-flow waterfall
monthlySold comps — $/sqft
last 12 mo · ≤1 miLoading sold comps…