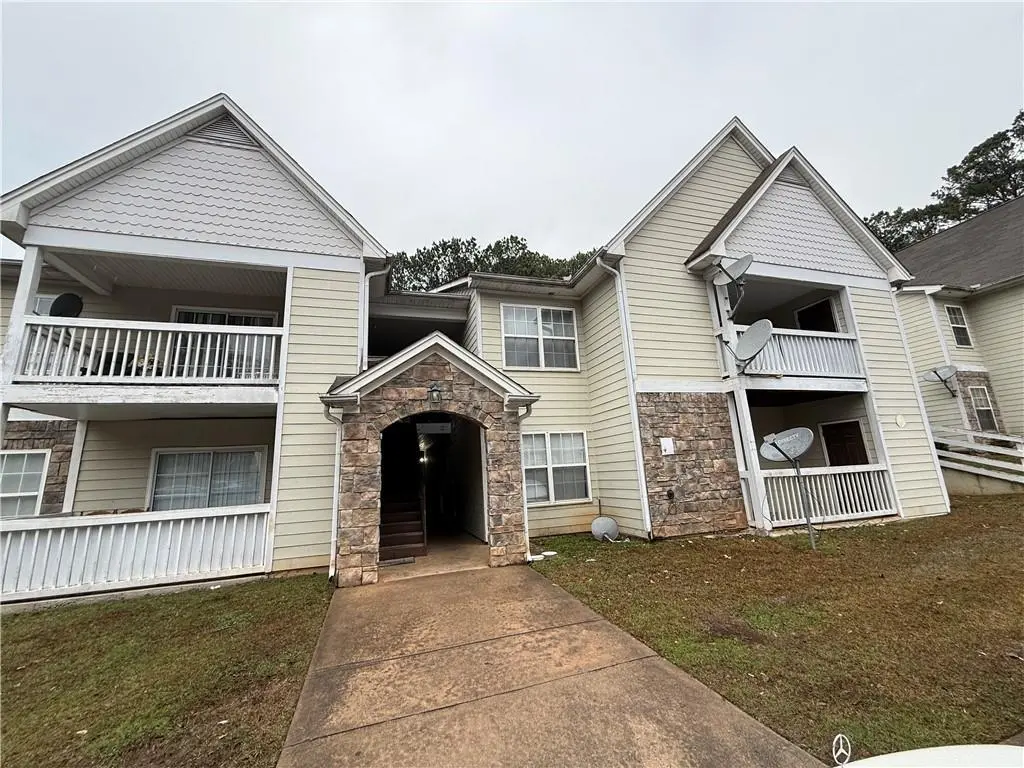
312 Ridge Creek Dr · Clarkston, GA
Flood risk 1/10 · Minimal
- FEMA flood zone
- X (unshaded)
- Chance of flooding over 30 yrs
- 0.0%
- Est. flood insurance / yr
- $507 – $1,088
Fire risk 1/10 · Minimal
- Est. fire insurance / yr
- $963 – $1,789
Heat risk 6/10 · Moderate
- Hot days now (above 104°F)
- 7 days/yr
- Hot days in 30 yrs
- 19 days/yr
Wind risk 4/10 · Minor
- Chance of severe wind over 30 yrs
- 21.0%
Air-quality risk 6/10 · Moderate
- Unhealthy air days now
- 8 days/yr
- Unhealthy air days in 30 yrs
- 11 days/yr
Risk factors via First Street. Map © Google.
Why this score? — see what drove the D- grade
The composite is a weighted blend of 9 inputs, each scored 0–100. Each bar is that input's sub-score; the figure is the points it added to the 100-point composite (weight × sub-score).
- Cash flow +10.0/30.0
- Appreciation +10.0/10.0
- Rent growth +4.0/5.0
- Livability +4.0/5.0
- 1% rule +3.8/10.0
- DSCR +2.8/10.0
- Condition / age +2.5/5.0
- Schools +2.1/10.0
- ARV discount +0.0/15.0
$189,000
🖨 Deal sheet (PDF) 📄 Offer letter ✓ Due diligence
Listing remarks MLS
3 Bedrooms and 2 bathroom currently rented for 1800,00
Key facts
- $157 HOA
- 2 parking spots
- Built 2002
Neighborhood map
What this means for you Summary
Snapshot
- This is a 3-bed/2.0-bath condo listed at $189k.
Deal economics
- At list price, monthly cash flow is $-115 ($-1k/yr) — negative.
- To cash-flow at today's rent, offer at most $169k (10.8% below list).
- To meet the 1% rule (rent ≥ 1% of price), the offer needs to be $166k (12.4% below list).
- Recommended offer: $166k (12.4% below list) — sets the bar for 1% rule.
- Cap rate 5.6% vs local median 3.6% in Clarkston — top-decile yield for the area; either an underpriced asset or a hidden risk that comps aren't pricing in. Stress-test before assuming the spread holds.
Location & tenants
- Location reads 79/100 on livability (#14 in GA, #2,067 nationally) — a middle-class / working-renter tenant base. Strengths: commute A+, cost of living A+, housing A+; Watch: amenities C-, crime D+, schools F.
- Dekalb County (suburban): math 19% / reading 28% proficiency, ranked #125 of 174 in GA (top 72%) — low school quality limits family demand, transient renter base, plan for 1-2y turnover; 68% free/reduced lunch — lower-income household profile, screen leases tightly.
- Market conditions: Rents rising fast (+5.9%/yr); 37 active listings in the ZIP; 31 comparable units currently listed for rent nearby; rentals leasing fast (median 12d on market — plan ~1-2 weeks tenant-placement turnaround); 1,240 units permitted in DeKalb County in 2024 (385 in 5+ unit buildings).
- This rent runs 38% of the median local income ($52k/yr) — at the standard rent-burdened threshold; future hikes will face affordability resistance.
Forward outlook
- In year one you build about $20k of equity ($1k loan paydown + $19k appreciation (10.0% local appreciation)).
- DeKalb County population projected at +28% by 2050 — long-run rental-demand tailwind backs the buy-and-hold thesis.
- By year 2, paydown + projected appreciation supports a ~$32k cash-out refi (75% LTV) — recoverable capital for the next deal without selling this one.
Negotiation context
- It's been on market 149 days — a 12% lower offer ($166k) is reasonable based on typical stale-listing flexibility.
- 4 sale attempts since 14y ago; this cycle's ask is 26% above the opening price — seller raised mid-cycle; expect resistance to lowballs.
- Current owner paid $32k; list at $189k implies a 500% gain — meaningful room to come down on a strong offer.
Risks & watch-outs
- Climate carrying-cost: extreme-heat days projected 7→19/yr by 2055 (HVAC capex compounding) — expect insurance premiums to compound above CPI over the hold.
Questions for the listing agent
- What do current leases actually rent for vs. the listed asking? Can we see a recent rent roll and the last 12 months of T-12 income?
- It's been on market 149 days. Have you received any prior offers? Is the seller open to a 12% concession, seller financing, or rate buy-down credit?
- What does the HOA fee cover, when was the last increase, and are there any pending special assessments or reserve-fund shortfalls?
- Any open or pending special assessments — roof, HVAC, plumbing, elevator, façade? What's the per-unit balance and payoff schedule, and is the seller paying it off at close or rolling it to the buyer?
- Why hasn't it sold? Are there any deal-killer items the seller is aware of (foundation, flood, title, zoning, code violations)?
- Is there a deadline driving the sale (1031 exchange, divorce, estate, relocation)? That informs how much negotiation room exists.
- Schools are F-rated, which usually means shorter tenancies and higher turnover. Who's the typical renter profile here, and what's been the actual vacancy rate?
- Crime grade is D in this area — have there been break-ins, vandalism, or insurance claims at this property in the last 3 years? What carrier currently insures it and at what premium?
- The area grade is low — what's the realistic commute time and amenity access for the typical tenant pool here? Any planned neighborhood developments (good or bad) we should know about?
- What's the average days-on-market for RENTAL listings here right now (not sales)? A rising rental-DOM trend means longer vacancies and softer asking-rent achievability than the comps imply.
- What's the recent tenant-quality profile in this submarket — average credit score on applications, eviction rate, late-payment / NSF rate, and stable-employment percentage? A property-management company in the area should have these aggregated.
- How much new apartment / multifamily construction is in the pipeline within 1–3 miles? Heavy new supply (>2% of stock underway) typically softens rents 12–24 months out; light construction supports rent growth.
Investment metrics
- 1% rule
- 0.88% ✗
- Cap rate
- 5.56%
- Cash-on-cash
- -2.62%
- DSCR
- 0.88
- GRM
- 9.5
CMA / ARV
- ARV (median comp)
- $161,935
- List price
- $189,000
- Delta
- 16.71%
- Verdict
- OVERPRICED
- Comps
- 20 within 1.0 mi
Projected returns pro-forma
10.0% appreciation · 5.88% rent growth · sell at horizon
- IRR
- 23.4%
- Equity multiple
- 2.90×
- Total profit
- $100,624
- Equity at exit
- $170,266
- IRR
- 21.6%
- Equity multiple
- 6.92×
- Total profit
- $313,544
- Equity at exit
- $367,185
Cash invested: $52,920 (down + closing). Projections, not guarantees.
Landlord ↔ Tenant lean methodology
- Overall (STATE)
- 90 Strongly Landlord-Friendly
- State Georgia
- 90 Strongly Landlord-Friendly · R+3
- County
- — inherits STATE
- City
- — inherits STATE
ZIP-level market 30021
- Home prices YoY
- 13.2%
- Rents YoY
- 5.9%
- Active inventory
- 37
- Price-to-rent
- 9.5×
Monthly cashflow live
- Estimated rent
- $1,656 high interval (Pro) →
- Mortgage (P&I)
- −$991
- Tax from tax record
- −$197 /mo · $2,362/yr
- Insurance
- −$79
- HOA
- −$157
- Vacancy / Maint / Mgmt
- −$348
- Net cashflow
- $-115
Break-even live
Sensitivity live
| Price | -10% $-8 | -5% $-62 | +0% $-115 | +5% $-169 | +10% $-222 |
|---|---|---|---|---|---|
| Rent | -10% $-246 | -5% $-181 | +0% $-115 | +5% $-50 | +10% $16 |
| Rate | -1.0pp $-20 | -0.5pp $-67 | base $-115 | +0.5pp $-164 | +1.0pp $-214 |
UW: 25.0% down · 7.5% · 30yr · 1.5% tax · 5.0% vac · 8.0% maint · 8.0% mgmt
Financing live
Cash to close
- Down payment
- $47,250
- Closing costs
- $5,670
- Reserves months
- —
- Total cash needed
- —
Loan-product check · same deal, 3 products live
Conventional
25% down · 7.5% · 30yr
- Down + closing
- —
- Monthly P&I
- —
- Monthly cashflow
- —
- DSCR
- —
- Eligible?
- —
Personal DTI + credit; lowest rate.
DSCR
20% down · 8.5% · 30yr
- Down + closing
- —
- Monthly P&I
- —
- Monthly cashflow
- —
- DSCR
- —
- Eligible?
- —
No personal income docs; deal must DSCR.
Hard money
10% down · 12.0% · 12mo
- Down + closing
- —
- Monthly P&I
- —
- Monthly cashflow
- —
- DSCR
- —
- Eligible?
- —
Short-term bridge; refi at stabilization.
Rent comps 31 comps
| Address | Beds | Baths | Sqft | Rent | $/sqft | DOM | Units | Dist |
|---|---|---|---|---|---|---|---|---|
| 417 Ridge Creek Dr Clarkston, GA | 2.0 | 2.0 | 1239 | $1,399 | $1.13 | 25d | 1 | 0.07mi |
| 751 N Indian Creek Dr Clarkston, GA | 1.0–3.0 | 1.0–2.0 | 995 | $1,325 | $1.33 | 44d | 1 | 0.34mi |
| 792 Jolly Ave S Clarkston, GA | 1.0–2.0 | 1.0–2.0 | 947 | $1,100 | $1.16 | 6d | 12 | 0.40mi |
| 774 Northern Ave Unit B14 Clarkston, GA | 2.0 | 2.0 | 1100 | $1,250 | $1.14 | 0d | 1 | 0.59mi |
| 774 Northern Ave Unit A14 Clarkston, GA | 2.0 | 2.0 | 1100 | $1,250 | $1.14 | 44d | 1 | 0.59mi |
| 3548 Lantern View Ln Scottdale, GA | 3.0 | 2.5 | 1500 | $2,000 | $1.33 | 44d | 1 | 0.59mi |
| 3799 N Decatur Rd Decatur, GA | 1.0–3.0 | 1.0–2.0 | 1087 | $1,295 | $1.19 | 0d | 13 | 0.65mi |
| 3743 Poplar Dr Clarkston, GA | 3.0 | 2.0 | 1540 | $1,900 | $1.23 | 5d | 1 | 0.75mi |
| 3681 Pavilion Point Decatur, GA | 2.0–4.0 | 1.0–2.0 | 1355 | $1,700 | $1.25 | 44d | 1 | 0.76mi |
| 524 Warren Ave Scottdale, GA | 2.0 | 3.5 | 1248 | $1,500 | $1.20 | 13d | 1 | 0.76mi |
| 3517 Creekview Pl Scottdale, GA | 2.0 | 1.5 | 1250 | $1,150 | $0.92 | 44d | 1 | 0.77mi |
| 3499 Creekview Pl Scottdale, GA | 2.0 | 1.5 | 1250 | $1,150 | $0.92 | 0d | 1 | 0.78mi |
| 3499 Creekview Pl Scottdale, GA | 2.0 | 1.5 | 1250 | $1,150 | $0.92 | 6d | 1 | 0.78mi |
| 437 Creekview Ct Scottdale, GA | 2.0 | 2.5 | 1400 | $1,195 | $0.85 | 25d | 1 | 0.79mi |
| 3545 Orchard St Clarkston, GA | 3.0 | 1.0 | 1232 | $1,650 | $1.34 | 17d | 1 | 0.80mi |
| 3545 Orchard St Clarkston, GA | 3.0 | 1.0 | 1232 | $1,650 | $1.34 | 0d | 1 | 0.80mi |
| 965 Smith St Clarkston, GA | 2.0 | 1.0 | 1542 | $1,500 | $0.97 | 44d | 1 | 0.84mi |
| 788 Angora Aly Scottdale, GA | 3.0 | 3.5 | 1622 | $2,850 | $1.76 | 2d | 1 | 1.03mi |
| 260 Northern Ave Avondale Estates, GA | 1.0–3.0 | 1.0–2.0 | 1155 | $1,380 | $1.19 | 44d | 4 | 1.05mi |
| 1015 Casa Dr Clarkston, GA | 4.0 | 2.0 | 1844 | $1,950 | $1.06 | 25d | 1 | 1.06mi |
| 3519 W Hill St Clarkston, GA | 2.0 | 1.0–1.5 | 857 | $1,299 | $1.51 | 6d | 1 | 1.08mi |
| 1000 Montreal Rd Clarkston, GA | 1.0–3.0 | 1.0–2.5 | 1250 | $1,340 | $1.07 | 0d | 17 | 1.23mi |
| 3800 W Wood Path Stone Mountain, GA | 3.0 | 2.0 | 1344 | $2,500 | $1.86 | 44d | 1 | 1.27mi |
| 4204 Cheryl Ann Ct Stone Mountain, GA | 4.0 | 2.0 | 1391 | $2,086 | $1.50 | 12d | 1 | 1.33mi |
| 427 Third Ave Scottdale, GA | 3.0 | 2.0 | 1350 | $4,500 | $3.33 | 0d | 1 | 1.33mi |
| 1039 Verdi Way Clarkston, GA | 3.0 | 1.5 | 1053 | $1,995 | $1.89 | 6d | 1 | 1.38mi |
| 500 Hambrick Sq Stone Mountain, GA | 1.0–4.0 | 1.0–2.0 | 1238 | $1,425 | $1.15 | 6d | 2 | 1.40mi |
| 721 Ford Pl Unit A Scottdale, GA | 2.0 | 1.0 | 896 | $1,450 | $1.62 | 6d | 1 | 1.41mi |
| 4247 Youngstown Cir #4247 Stone Mountain, GA | 3.0 | 2.5 | 1524 | $1,800 | $1.18 | 21d | 1 | 1.42mi |
| 4247 Youngstown Cir Stone Mountain, GA | 3.0 | 3.0 | 1524 | $1,900 | $1.25 | 44d | 1 | 1.42mi |
| 1086 Montreal Rd Clarkston, GA | 2.0 | 1.5–2.0 | 1252 | $1,318 | $1.05 | 11d | 10 | 1.42mi |
HOA detail condo
- Monthly dues
- $157 · $1,884/yr
- Assessments
- None detected in remarks — confirm with the listing agent.
Listing history 26 events
-
2026-06-21days on market $189,000 Active 149 DOM
-
2026-06-18days on market $189,000 Active 146 DOM
-
2026-06-17days on market $189,000 Active 145 DOM
-
2026-06-16days on market $189,000 Active 144 DOM
-
2026-06-15days on market $189,000 Active 143 DOM
-
2026-06-13days on market $189,000 Active 141 DOM
-
2026-06-09days on market $189,000 Active 137 DOM
-
2026-06-08days on market $189,000 Active 136 DOM
-
2026-06-07days on market $189,000 Active 135 DOM
-
2026-06-04days on market $189,000 Active 132 DOM
-
2026-06-03days on market $189,000 Active 131 DOM
-
2026-06-02days on market $189,000 Active 130 DOM
-
2026-06-01days on market $189,000 Active 129 DOM
-
2026-05-31days on market $189,000 Active 128 DOM
-
2026-01-24price $189,000 54-char remark
Show marketing remark (54 chars)
3 Bedrooms and 2 bathroom currently rented for 1800,00
-
2026-01-24price $189,000 54-char remark
Show marketing remark (54 chars)
3 Bedrooms and 2 bathroom currently rented for 1800,00
-
2026-01-23$150,000 New 54-char remark
Show marketing remark (54 chars)
3 Bedrooms and 2 bathroom currently rented for 1800,00
-
2026-01-23$150,000 Active 54-char remark
Show marketing remark (54 chars)
3 Bedrooms and 2 bathroom currently rented for 1800,00
-
2014-10-30price $24,500
-
2012-06-28soldstatus $31,500 Sold
-
2012-05-23historical
-
2012-05-22price $31,500
-
2012-05-10$24,500 New
-
2012-04-06historical
-
2012-01-07$85,000 New
-
2005-03-30soldstatus $100,000
ⓘ Source: listings_history table (triggers on properties + properties_extension) + one-shot
backfill from property_details.listing_events for pre-trigger history.
Tax reassessment forecast GA · Resets to sale price
- Current annual tax
- $2,362 · $197/mo
- Projected year-2 tax
- $2,362 · $197/mo
- Expected delta
- $0/yr ($0/mo · 0.0%)
ⓘ Screening estimate from a state-policy table — verify with the county assessor before closing.
Climate risk First Street
- Flood 1/10 Low FEMA zone X (unshaded) · 0% chance over 30 yrs
- Wildfire 1/10 Low
- Heat 6/10 Major 7 d/yr ≥104°F today · 19 d/yr by 30 yrs out
- Wind 4/10 Moderate 21% chance of damaging wind over 30 yrs
- Air quality 6/10 Major 8 unhealthy d/yr today · 11 by 30 yrs out
Nearby sold comps map
Loading sold comps map…
Walkable amenities ~0.75 mi
Loading nearby amenities…
Taxation est. · year 1
- Rental income
- $19,874
- − Mortgage interest
- −$10,587
- − Property taxes
- −$2,362
- − Insurance
- −$945
- − Repairs & maintenance
- −$1,590
- − Management
- −$1,590
- − HOA
- −$1,884
- − Depreciation
- −$5,498
- Taxable loss
- −$4,582
- Est. tax savings @ 24.0%
- +$1,100
- After-tax cash flow
- $-284/yr
For passive investors: Depreciation is non-cash, so a rental often shows a tax loss while cash-flowing — sheltering income. Rental losses are passive: they offset passive income freely, and up to $25,000/yr can offset ordinary (W-2) income if you actively participate and your MAGI is under $100k (phasing out to $0 by $150k); unused losses carry forward. On sale, claimed depreciation is recaptured at up to 25%, and gains may owe capital-gains tax (a 1031 exchange can defer both). Figures are a year-1 estimate at your 24.0% rate — not tax advice; consult a CPA.
Schools (NCES district)
- District
- Dekalb County
- NCES district ID
- 1301740
- Math proficiency
- 19% ▼ -12.00%
- Reading proficiency
- 28% ▼ -7.00%
- Median HH income
- $51,448
- Composite
- 20.92/100
- National rank
- #8482
- State rank
- #125 of 174 in GA
Livability — Clarkston
- Score
- 79/100
- State rank
- #14
- US rank
- #2067
Category grades
Schools grade is shown separately in the Schools card above.
Census & demographics
- County
- Dekalb County · 782,738 people
- City population
- 27,781
- Metro
- Atlanta-Sandy Springs-Alpharetta, GA
- Population (ZIP)
- 27,781
- Household income
- $52,278
- Rent vs Own
- Severe rent burden
- 1622.0
Population outlook (DeKalb County) Hauer SSP2
- Today (2025)
- 839,977 people
- By 2030
- 891,768 · +6.2%
- By 2040
- 988,894 · +17.7%
- By 2050
- 1,074,583 · +27.9%
- By 2075
- 1,245,026 · +48.2%
- By 2100
- 1,303,135 · +55.1%
Race, ethnicity, and origin ACS 2023
- Neighborhood character
- Diverse neighborhood (Simpson 0.57)
- Race & ethnicity
- Black 62% Asian 15% White 14% Two or more races 6% Hispanic / Latino 5%
- Hispanic origin (detail)
- Common ancestry
- Ukrainian 1% Italian 1% Slovak 1%
- Foreign-born
- 43% · Philippines, Canada, India
- Languages at home
- 43% English-only · Other Indo-European 8% Spanish 5% Other Asian/Pacific 5%
Political lean MEDSL · DeKalb
- 2024 margin
- Solid D (+64.8) · D 81.9% · R 17.1% · Other 1.0%
- 2008→2024 swing
- +6.1pp toward D · 2008: 58.6pp · 2024: 64.8pp
- All cycles
- 2024: D+64.8 2020: D+67.4 2016: D+64.8 2012: D+56.8 2008: D+58.6
Not yet ingested
- Civics
- —
Market trends
- HPI YoY
- ▲ 41.94%
- Current HPI
- 360.0584
- Rent YoY
- ▲ 5.88%
- Metro
- Atlanta-Sandy Springs-Alpharetta, GA
- State GDP YoY
- ▲ 2.66%
- F500 in state
- 28
Industry mix (Fortune 500 HQ in GA)
| Industry | F500 HQs | Revenue |
|---|---|---|
| Paper / Packaging | 2 | $29B |
|
||
| Retail | 1 | $160B |
|
||
| Transportation / Logistics | 1 | $91B |
|
||
| Airlines | 1 | $62B |
|
||
| Consumer Goods | 1 | $47B |
|
||
| Utilities | 1 | $25B |
|
||
Price history
+89.0% since first listed12 events — show timeline
- 2026-01-24 Price Changed $189,000 GAMLS
- 2026-01-24 Price Changed $189,000 FMLS
- 2026-01-23 Listed $150,000 FMLS
- 2026-01-23 Listed $150,000 GAMLS
- 2014-10-30 Price Changed $24,500 GAMLS
- 2012-06-28 Sold (MLS) $31,500 GAMLS
- 2012-05-23 Listing Removed — GAMLS
- 2012-05-22 Price Changed $31,500 GAMLS
- 2012-05-10 Listed $24,500 GAMLS
- 2012-04-06 Listing Removed — GAMLS
- 2012-01-07 Listed $85,000 GAMLS
- 2005-03-30 Sold (Public Records) $100,000 Public Records
Property tax history
+6.9%/yrLatest (2025): $2,362 · +0.6% YoY. Source: county tax records.
Cash-flow waterfall
monthlySold comps — $/sqft
last 12 mo · ≤1 miLoading sold comps…