 Duplex
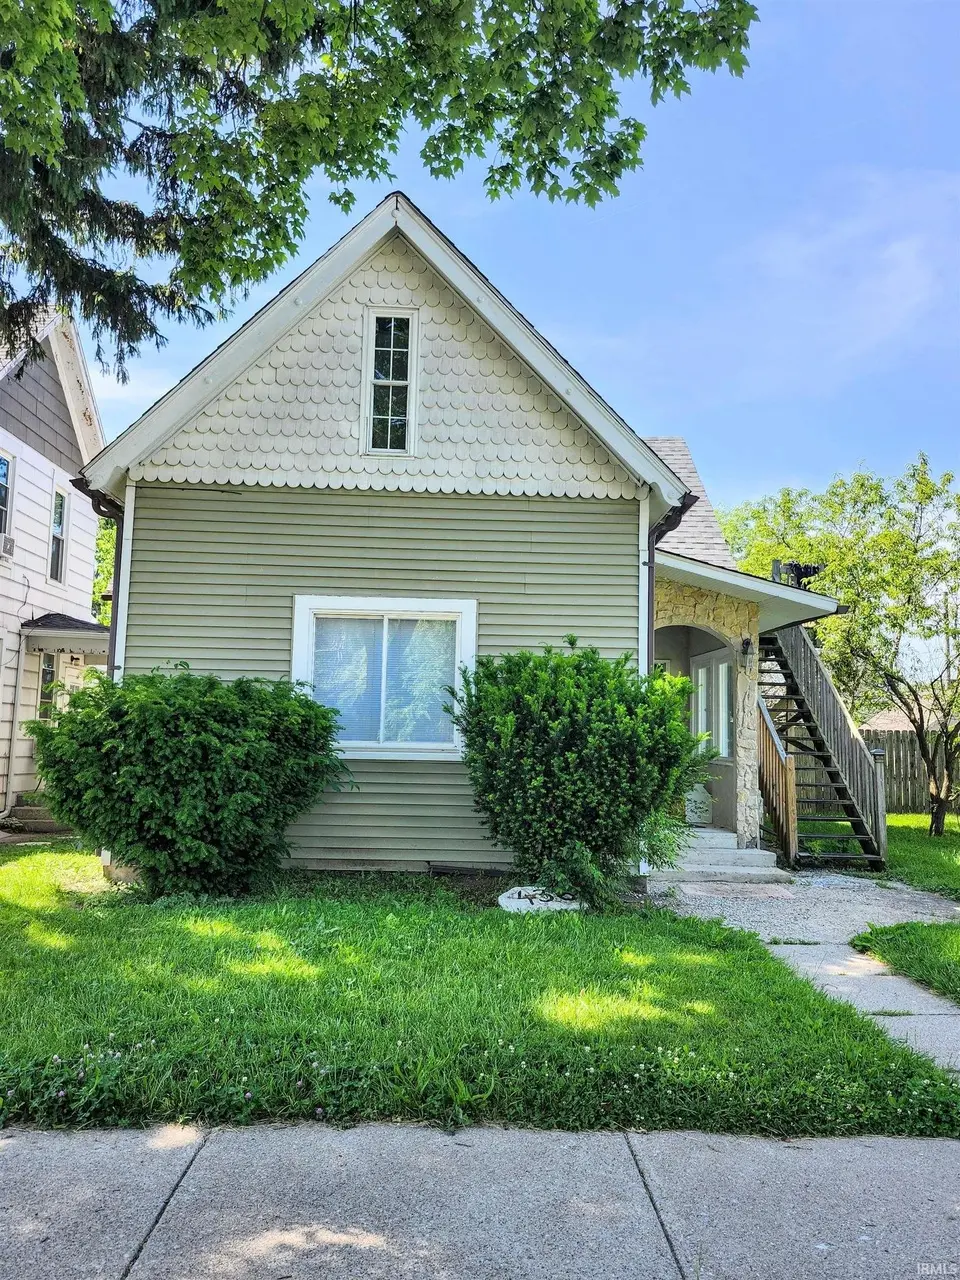
436 E Taber St · Fort Wayne, IN
Flood risk 1/10 · Minimal
- FEMA flood zone
- X (unshaded)
- Chance of flooding over 30 yrs
- 0.0%
- Est. flood insurance / yr
- $473 – $860
Fire risk 1/10 · Minimal
- Est. fire insurance / yr
- $717 – $1,331
Heat risk 3/10 · Minor
- Hot days now (above 100°F)
- 7 days/yr
- Hot days in 30 yrs
- 17 days/yr
Wind risk 2/10 · Minimal
- Chance of severe wind over 30 yrs
- —
Air-quality risk 3/10 · Minor
- Unhealthy air days now
- 2 days/yr
- Unhealthy air days in 30 yrs
- 3 days/yr
Risk factors via First Street. Map © Google.
Why this score? — see what drove the B grade
The composite is a weighted blend of 9 inputs, each scored 0–100. Each bar is that input's sub-score; the figure is the points it added to the 100-point composite (weight × sub-score).
- Cash flow +30.0/30.0
- 1% rule +10.0/10.0
- DSCR +10.0/10.0
- Appreciation +10.0/10.0
- Livability +4.2/5.0
- ARV discount +3.5/15.0
- Rent growth +2.5/5.0
- Condition / age +2.5/5.0
- Schools +2.2/10.0
$145,000
🖨 Deal sheet 📄 Offer letter ✓ Due diligence
Multi-family units
County records classify this as Multi-Family (2-4 Unit). Listing-text estimate: 2 units. confirmed
Listing remarks MLS
Back on the market not due to seller. New Gas Forced Air Furnace. New water heater. Lower unit leased for one year at $1100.00 per month (no deposit collected). Lower has new kitchen cabinets with vinyl plank flooring and gas stove. Garage is for the lower unit and has a one door opening but two car dimensions. Upper rented for $695.00 with one year lease (no deposit). Off street parking for upper unit. Bath up has a new tile floor and tub surround and new gas stove. Throughout new flooring, lighting, interior doors. Vinyl siding and windows. Owner did not own the property when occupied so there is no record of prior expenses or income. Both tenants combined annual income totals $21540. Utilities are not separated. Owner pays all utilities. Annual net income is not available. One year lease for both units are uploaded.
Key facts
- Expansive side yard
- Large lot
- Detached garage
Tags
Property features AI
Finance
- Other: Pets allowed with breed restrictions
Exterior
- Parking: Garage; On-street parking
- Utilities: Public water; Public sewer
- Home design: Duplex (residential income); Two stories
- Construction: Vinyl siding; Block foundation; Built as part of a two-story structure
- Exterior features: Deck; Patio; Wood fencing; Asphalt roof
Interior
- Kitchen: Range; Refrigerator
- Flooring: Carpet; Tile; Vinyl
- Bathrooms: Two full bathrooms; Three main-level bathrooms
- Heating & cooling: Baseboard heating; Electric heating; Forced air heating; Natural gas heating
- Interior features: Range and refrigerator included; Carpet, tile, and vinyl flooring; Crawl space basement (unfinished)
- Laundry & utility: Washer hookup
Neighborhood map
What this means for you Summary
Snapshot
- This is a 2 × 3-bed/2.0-bath units multifamily listed at $145k.
Deal economics
- At list price, monthly cash flow is $924 ($11k/yr) — positive. Per door: $462/mo.
- The deal already cash-flows at list — no discount required.
- Meets the 1% rule at list price ($2k rent vs $145k).
- Cap rate 13.9% vs local median 4.8% in Fort Wayne — top-decile yield for the area; either an underpriced asset or a hidden risk that comps aren't pricing in. Stress-test before assuming the spread holds.
Location & tenants
- Location reads 84/100 on livability (#6 in IN, #676 nationally) — a professional / high-income tenant draw. Strengths: amenities A+, commute A+, cost of living A+; Watch: crime C-, employment D+.
- Fort Wayne Community Schools (urban): math 22% / reading 29% proficiency, ranked #263 of 301 in IN (top 87%) — low school quality limits family demand, transient renter base, plan for 1-2y turnover; 60% free/reduced lunch — lower-income household profile, screen leases tightly.
- Zoned schools: Arlington Elementary School (math 37% / reading 32%, grade F, #597 of 994 statewide, top 63%, 420 students, 54% FRL); Jefferson Middle School (math 22% / reading 29%, grade F, #243 of 330 statewide, top 74%, 682 students, 58% FRL); Northrop High School (math 25% / reading 62%, grade F, #191 of 369 statewide, top 52%, 2,136 students, 54% FRL).
- Market conditions: 52 active listings in the ZIP; 40 comparable units currently listed for rent nearby; rentals at typical pace (median 21d on market — plan ~3-4 weeks tenant-placement turnaround); lower-income renter base — watch delinquency; 1,861 units permitted in Allen County in 2024 (576 in 5+ unit buildings).
- At $2,431/mo this rent would consume 85% of the median local household income ($34k/yr) (locally 660% of renters already pay >50% of income on rent) — very limited rent-growth headroom before tenants either downsize or default.
Forward outlook
- In year one you build about $16k of equity ($1k loan paydown + $14k appreciation (10.0% local appreciation)).
- Allen County population projected at +10% by 2050 — modest demand growth; plan on rents tracking national, not racing it.
- At projected returns (10.0% appreciation + 3.0% rent growth), your $41k cash investment doubles in ~2 years — after that, you're playing with house money.
- By year 3, paydown + projected appreciation supports a ~$39k cash-out refi (75% LTV) — recoverable capital for the next deal without selling this one.
Negotiation context
- Only 13 days on market — expect competitive offers; lowballing is unlikely to land.
- 4 sale attempts since 3y ago with the ask held roughly flat each time — persistent listings suggest the price (not the market) is what's stuck; bring a comps-based counter.
Risks & watch-outs
- Watch-outs: built in 1900 — expect roof / HVAC / electrical / plumbing capex.
Questions for the listing agent
- Can we see the unit-by-unit rent roll, current vacancy, and any below-market leases? What's the average tenancy length?
- What capital expenditures (roof, boiler, parking lot, exteriors) have been made in the last 5 years, and what's planned in the next 2?
- Built in 1900 — when were the roof, HVAC, electrical panel, plumbing, and water heater last replaced?
- Is there a deadline driving the sale (1031 exchange, divorce, estate, relocation)? That informs how much negotiation room exists.
- Schools are D-rated, which usually means shorter tenancies and higher turnover. Who's the typical renter profile here, and what's been the actual vacancy rate?
- What's the average days-on-market for RENTAL listings here right now (not sales)? A rising rental-DOM trend means longer vacancies and softer asking-rent achievability than the comps imply.
- What's the recent tenant-quality profile in this submarket — average credit score on applications, eviction rate, late-payment / NSF rate, and stable-employment percentage? A property-management company in the area should have these aggregated.
- How much new apartment / multifamily construction is in the pipeline within 1–3 miles? Heavy new supply (>2% of stock underway) typically softens rents 12–24 months out; light construction supports rent growth.
Investment metrics
- 1% rule
- 1.68% ✓
- Cap rate
- 13.94%
- Cash-on-cash
- 27.32%
- DSCR
- 2.22
- GRM
- 5.0
CMA / ARV
- ARV (on-the-fly)
- $133,056
- Comps found
- 2
Show comp detail 2 sales within ~0.75 mi
| Address | Dist | Beds/Ba | Sqft | Sold | Price | $/sf | Match |
|---|---|---|---|---|---|---|---|
| 3610 Lafayette St | 0.75mi | 3/1.0 | 1,188 (-4%) | 10mo | $74,000 | $62 | 47 |
| 2011 Hoagland Ave | 0.62mi | 2/2.0 (-1) | 1,112 (-10%) | 14mo | $119,900 | $108 | 38 |
Match score weights: distance 35% · size 25% · config 20% · recency 20%. Top-matched comps best support the ARV.
Projected returns pro-forma
10.0% appreciation · 3.0% rent growth · sell at horizon
- IRR
- 44.9%
- Equity multiple
- 4.40×
- Total profit
- $137,880
- Equity at exit
- $130,627
- IRR
- 39.0%
- Equity multiple
- 9.86×
- Total profit
- $359,799
- Equity at exit
- $281,703
Cash invested: $40,600 (down + closing). Projections, not guarantees.
Landlord ↔ Tenant lean methodology
- Overall (STATE)
- 90 Strongly Landlord-Friendly
- State Indiana
- 90 Strongly Landlord-Friendly · R+11
- County
- — inherits STATE
- City
- — inherits STATE
ZIP-level market 46803
- Active inventory
- 52
- Price-to-rent
- 9.9×
Monthly cashflow live
- Estimated rent
- $2,431 high interval (Pro) →
- Mortgage (P&I)
- −$760
- Tax from tax record
- −$175 /mo · $2,103/yr
- Insurance
- −$60
- HOA
- −$0
- Vacancy / Maint / Mgmt
- −$511
- Net cashflow
- $924
Break-even live
2-unit breakdown (identical units grouped — click to expand)
| Units | Beds | Baths | Est. rent |
|---|---|---|---|
| 2× units | 3 | 2 | $2,432 |
| #1 | 3 | 2 | $1,216 |
| #2 | 3 | 2 | $1,216 |
| Total (2 units) | $2,431 | ||
UW: 25.0% down · 7.5% · 30yr · 1.5% tax · 5.0% vac · 8.0% maint · 8.0% mgmt
Financing live
Cash to close
- Down payment
- $36,250
- Closing costs
- $4,350
- Reserves months
- —
- Total cash needed
- —
Loan-product check · same deal, 3 products live
Conventional
25% down · 7.5% · 30yr
- Down + closing
- —
- Monthly P&I
- —
- Monthly cashflow
- —
- DSCR
- —
- Eligible?
- —
Personal DTI + credit; lowest rate.
DSCR
20% down · 8.5% · 30yr
- Down + closing
- —
- Monthly P&I
- —
- Monthly cashflow
- —
- DSCR
- —
- Eligible?
- —
No personal income docs; deal must DSCR.
Hard money
10% down · 12.0% · 12mo
- Down + closing
- —
- Monthly P&I
- —
- Monthly cashflow
- —
- DSCR
- —
- Eligible?
- —
Short-term bridge; refi at stabilization.
Rent comps 40 comps
| Address | Beds | Baths | Sqft | Rent | $/sqft | DOM | Units | Dist |
|---|---|---|---|---|---|---|---|---|
| 420 E Dewald St Fort Wayne, IN | 3.0 | 1.5 | 1472 | $1,300 | $0.88 | 43d | 1 | 0.15mi |
| 451 E Pontiac St Fort Wayne, IN | 3.0 | 1.0 | 1308 | $1,050 | $0.80 | 43d | 1 | 0.16mi |
| 116 E Pontiac St Fort Wayne, IN | 3.0 | 1.5 | 1400 | $1,175 | $0.84 | 21d | 1 | 0.32mi |
| 442 E Wildwood Ave Fort Wayne, IN | 2.0 | 1.0 | 864 | $875 | $1.01 | 21d | 1 | 0.41mi |
| 859 Buchanan St Fort Wayne, IN | 1.0–4.0 | 1.0 | 887 | $1,074 | $1.21 | 21d | 1 | 0.48mi |
| 309 W Leith St Unit 2 Fort Wayne, IN | 2.0 | 1.0 | 900 | $1,000 | $1.11 | 43d | 1 | 0.53mi |
| 309 W Williams St Unit 1 Fort Wayne, IN | 2.0 | 1.0 | 900 | $900 | $1.00 | 21d | 1 | 0.56mi |
| 3008 Webster St Fort Wayne, IN | 3.0 | 1.0 | 1344 | $1,449 | $1.08 | 21d | 1 | 0.57mi |
| 217 W Masterson Ave Fort Wayne, IN | 2.0 | 1.0 | 1100 | $995 | $0.90 | 21d | 1 | 0.57mi |
| 1024 Colerick St Fort Wayne, IN | 4.0 | 1.0 | 1388 | $1,065 | $0.77 | 21d | 1 | 0.60mi |
| 2445 Fairfield Ave Fort Wayne, IN | 2.0 | 1.5 | 950 | $1,150 | $1.21 | 13d | 3 | 0.65mi |
| 3510 S Harrison St Fort Wayne, IN | 3.0 | 1.0 | 1248 | $975 | $0.78 | 13d | 1 | 0.78mi |
| 227 W Darrow Ave Fort Wayne, IN | 3.0 | 1.0 | 995 | $1,000 | $1.01 | 43d | 1 | 0.79mi |
| 3009 Holton Ave Fort Wayne, IN | 3.0 | 1.0 | 1212 | $1,400 | $1.16 | 13d | 1 | 0.82mi |
| 3801 Lafayette St Fort Wayne, IN | 2.0 | 1.0 | 1116 | $995 | $0.89 | 13d | 1 | 0.85mi |
| 1023 Hamilton Ave Fort Wayne, IN | 3.0 | 1.0 | 1152 | $1,075 | $0.93 | 13d | 1 | 0.88mi |
| 810 Huestis Ave Apt 1 Fort Wayne, IN | 2.0 | 1.0 | 749 | $925 | $1.23 | 21d | 1 | 0.90mi |
| 824 Huestis Ave Apt C Fort Wayne, IN | 2.0 | 1.0 | 744 | $825 | $1.11 | 21d | 1 | 0.93mi |
| 907 Lincoln Ave Fort Wayne, IN | 2.0 | 1.0 | 1060 | $850 | $0.80 | 13d | 1 | 0.97mi |
| 1131 E Lewis St Fort Wayne, IN | 4.0 | 2.0 | 1476 | $1,950 | $1.32 | 13d | 1 | 0.97mi |
| 4018 S Clinton St Fort Wayne, IN | 3.0 | 1.0 | 860 | $1,000 | $1.16 | 21d | 1 | 1.00mi |
| 1250 Ewing St Fort Wayne, IN | 2.0 | 1.0–2.0 | 980 | $2,081 | $2.12 | 21d | 24 | 1.01mi |
| 2136 Miner St #2 Fort Wayne, IN | 2.0 | 1.0 | 850 | $1,200 | $1.41 | 43d | 1 | 1.01mi |
| 919 Madison St Fort Wayne, IN | 2.0 | 1.0 | 1332 | $995 | $0.75 | 43d | 1 | 1.03mi |
| 418 W Rudisill Blvd Unit 2 Fort Wayne, IN | 2.0 | 1.0 | 768 | $975 | $1.27 | 21d | 1 | 1.05mi |
| 112 W Washington Blvd Fort Wayne, IN | 1.0–2.0 | 1.0–2.0 | 768 | $1,500 | $1.95 | 21d | 2 | 1.08mi |
| 4126 Lafayette St Fort Wayne, IN | 2.0 | 1.0 | 775 | $1,275 | $1.65 | 43d | 1 | 1.08mi |
| 4121 Monroe St Fort Wayne, IN | 2.0 | 1.0 | 725 | $1,100 | $1.52 | 13d | 1 | 1.09mi |
| 3410 S Anthony Blvd Fort Wayne, IN | 3.0 | 1.0 | 900 | $1,200 | $1.33 | 43d | 1 | 1.12mi |
| 4014 Oliver St Fort Wayne, IN | 3.0 | 1.0 | 936 | $1,050 | $1.12 | 13d | 1 | 1.13mi |
| 877 Lavina St Fort Wayne, IN | 1.0–3.0 | 1.0–2.0 | 997 | $2,980 | $2.99 | 43d | 17 | 1.14mi |
| 1235 Huestis Ave Unit A Fort Wayne, IN | 2.0 | 1.0 | 1040 | $950 | $0.91 | 43d | 1 | 1.15mi |
| 1104 Stophlet St Fort Wayne, IN | 3.0 | 1.5 | 1288 | $1,400 | $1.09 | 13d | 1 | 1.16mi |
| 1320 Fay Dr Fort Wayne, IN | 2.0 | 1.0 | 792 | $800 | $1.01 | 13d | 1 | 1.21mi |
| 1322 Fay Dr Fort Wayne, IN | 2.0 | 1.0 | 792 | $950 | $1.20 | 21d | 1 | 1.22mi |
| 4331 Lafayette St Fort Wayne, IN | 2.0 | 1.0 | 810 | $925 | $1.14 | 13d | 1 | 1.23mi |
| 1342 Guthrie St Fort Wayne, IN | 3.0 | 1.0 | 1200 | $899 | $0.75 | 43d | 1 | 1.25mi |
| 1353 Huestis Ave Fort Wayne, IN | 4.0 | 1.0 | 1328 | $1,300 | $0.98 | 13d | 1 | 1.27mi |
| 4129 Bowser Ave Fort Wayne, IN | 3.0 | 1.5 | 850 | $1,250 | $1.47 | 21d | 1 | 1.27mi |
| 3932 Winter St Fort Wayne, IN | 2.0 | 1.0 | 750 | $875 | $1.17 | 43d | 1 | 1.27mi |
Listing history 10 events
-
2026-06-18days on market $145,000 Active 13 DOM
-
2026-06-17days on market $145,000 Active 12 DOM
-
2026-06-16days on market $145,000 Active 11 DOM
-
2026-06-15days on market $145,000 Active 10 DOM
-
2026-06-14days on market $145,000 Active 8 DOM
-
2026-06-10days on market $145,000 Active 5 DOM
-
2026-06-09days on market $145,000 Active 4 DOM
-
2026-06-08days on market $145,000 Active 3 DOM
-
2026-06-07remarks 699-char remark
-
2026-06-07$145,000 Active 2 DOM
ⓘ Source: listings_history table (triggers on properties + properties_extension) + one-shot
backfill from property_details.listing_events for pre-trigger history.
Tax reassessment forecast IN · Partial reset (capped growth)
- Current annual tax
- $2,103 · $175/mo
- Projected year-2 tax
- $2,103 · $175/mo
- Expected delta
- $0/yr ($0/mo · 0.0%)
ⓘ Screening estimate from a state-policy table — verify with the county assessor before closing.
Climate risk First Street
- Flood 1/10 Low FEMA zone X (unshaded) · 0% chance over 30 yrs
- Wildfire 1/10 Low
- Heat 3/10 Moderate 7 d/yr ≥100°F today · 17 d/yr by 30 yrs out
- Wind 2/10 Low
- Air quality 3/10 Moderate 2 unhealthy d/yr today · 3 by 30 yrs out
Nearby sold comps map
Loading sold comps map…
Walkable amenities ~0.75 mi
Loading nearby amenities…
Taxation est. · year 1
- Rental income
- $29,172
- − Mortgage interest
- −$8,122
- − Property taxes
- −$2,103
- − Insurance
- −$725
- − Repairs & maintenance
- −$2,334
- − Management
- −$2,334
- − Depreciation
- −$4,218
- Taxable income
- $9,336
- Est. tax owed @ 24.0%
- −$2,241
- After-tax cash flow
- $8,852/yr
For passive investors: Depreciation is non-cash, so a rental often shows a tax loss while cash-flowing — sheltering income. Rental losses are passive: they offset passive income freely, and up to $25,000/yr can offset ordinary (W-2) income if you actively participate and your MAGI is under $100k (phasing out to $0 by $150k); unused losses carry forward. On sale, claimed depreciation is recaptured at up to 25%, and gains may owe capital-gains tax (a 1031 exchange can defer both). Figures are a year-1 estimate at your 24.0% rate — not tax advice; consult a CPA.
Schools (NCES district)
- District
- Fort Wayne Community Schools
- NCES district ID
- 1803630
- Math proficiency
- 22% ▼ -11.00%
- Reading proficiency
- 29% ▼ -7.00%
- Median HH income
- $41,951
- Composite
- 21.68/100
- National rank
- #8275
- State rank
- #263 of 301 in IN
Livability — Fort Wayne
- Score
- 84/100
- State rank
- #6
- US rank
- #676
Category grades
Schools grade is shown separately in the Schools card above.
Census & demographics
- Census place
- Fort Wayne, IN
- County
- Allen County · 326,813 people
- City population
- 326,813
- Metro
- Fort Wayne, IN
- Population (ZIP)
- 10,994
- Household income
- $34,381
- Rent vs Own
- Severe rent burden
- 660.0
Population outlook (Allen County) Hauer SSP2
- Today (2025)
- 394,020 people
- By 2030
- 405,128 · +2.8%
- By 2040
- 423,476 · +7.5%
- By 2050
- 435,137 · +10.4%
- By 2075
- 450,293 · +14.3%
- By 2100
- 424,101 · +7.6%
Race, ethnicity, and origin ACS 2023
- Neighborhood character
- Diverse neighborhood (Simpson 0.69)
- Race & ethnicity
- Black 42% White 27% Hispanic / Latino 24% Two or more races 10% Native American 2% Asian 1%
- Hispanic origin (detail)
- Mexican 17% Puerto Rican 1%
- Common ancestry
- Lithuanian 1% Iranian 1% Serbian 1%
- Foreign-born
- 11% · Canada, Philippines
- Languages at home
- 81% English-only · Spanish 16% Other Asian/Pacific 1% French/Haitian/Cajun 1%
Political lean MEDSL · Allen
- 2024 margin
- R (+12.5) · D 42.9% · R 55.4% · Other 1.7%
- 2008→2024 swing
- -8.1pp toward R · 2008: -4.3pp · 2024: -12.5pp
- All cycles
- 2024: R+12.5 2020: R+11.2 2016: R+19.6 2012: R+16.8 2008: R+4.3
Not yet ingested
- Civics
- —
Market trends
- HPI YoY
- ▲ 107.58%
- Current HPI
- 404.7976
- Rent YoY
- —
- Metro
- Fort Wayne, IN
- State GDP YoY
- ▲ 2.90%
- F500 in state
- 18
Industry mix (Fortune 500 HQ in IN)
| Industry | F500 HQs | Revenue |
|---|---|---|
| Industrial Machinery | 2 | $37B |
|
||
| Healthcare | 1 | $177B |
|
||
| Pharmaceuticals | 1 | $45B |
|
||
| Metals / Steel | 1 | $18B |
|
||
| Agriculture | 1 | $17B |
|
||
| Packaging | 1 | $12B |
|
||
Price history
+7.5% since first listed8 events — show timeline
- 2026-06-05 Listed $145,000 IRMLS
- 2025-07-30 Price Changed $165,000 IRMLS
- 2025-06-04 Listed $170,000 IRMLS
- 2023-08-04 Sold (MLS) $130,000 IRMLS
- 2023-07-01 Pending — IRMLS
- 2023-06-12 Relisted — IRMLS
- 2023-06-04 Pending — IRMLS
- 2023-05-31 Listed $134,900 IRMLS
Property tax history
+12.4%/yrLatest (2024): $2,103 · +296.5% YoY. Source: county tax records.
Cash-flow waterfall
monthlySold comps — $/sqft
last 12 mo · ≤1 miLoading sold comps…