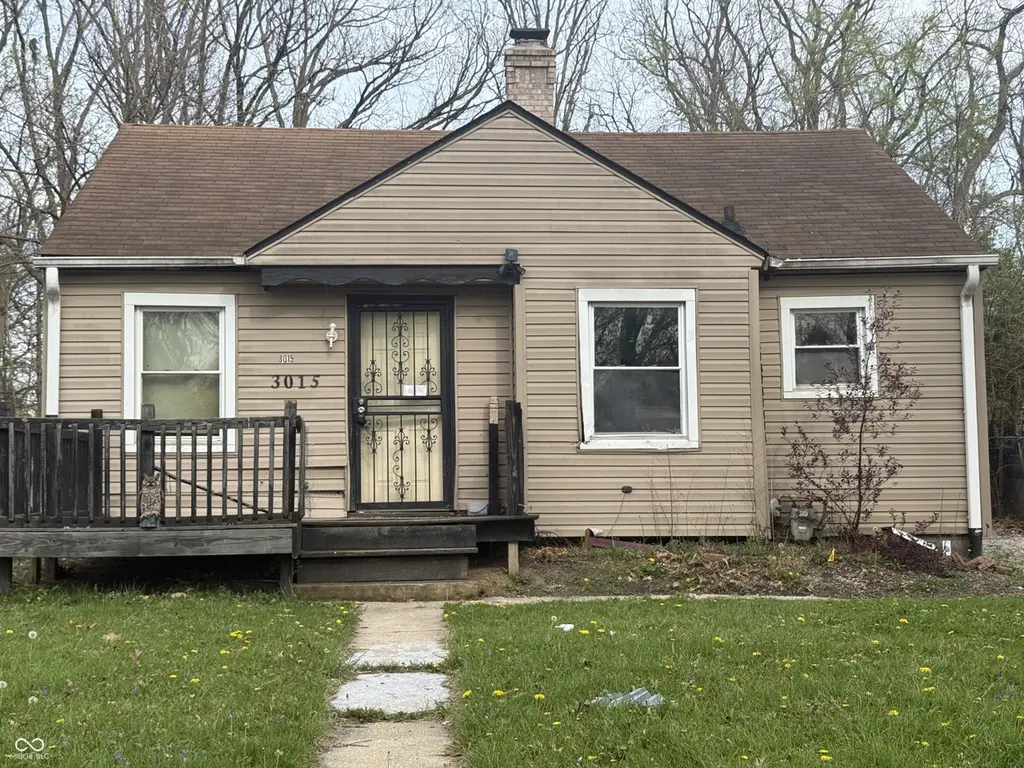
3015 Eastern Ave · Indianapolis city (balance), IN
Flood risk 1/10 · Minimal
- FEMA flood zone
- X (unshaded)
- Chance of flooding over 30 yrs
- 0.0%
- Est. flood insurance / yr
- $473 – $860
Fire risk 1/10 · Minimal
- Est. fire insurance / yr
- $717 – $1,331
Heat risk 3/10 · Minor
- Hot days now (above 102°F)
- 7 days/yr
- Hot days in 30 yrs
- 18 days/yr
Wind risk 2/10 · Minimal
- Chance of severe wind over 30 yrs
- 1.0%
Air-quality risk 4/10 · Minor
- Unhealthy air days now
- 5 days/yr
- Unhealthy air days in 30 yrs
- 7 days/yr
Risk factors via First Street. Map © Google.
Why this score? — see what drove the C grade
The composite is a weighted blend of 9 inputs, each scored 0–100. Each bar is that input's sub-score; the figure is the points it added to the 100-point composite (weight × sub-score).
- Cash flow +23.2/30.0
- ARV discount +15.0/15.0
- DSCR +7.4/10.0
- 1% rule +4.7/10.0
- Rent growth +2.7/5.0
- Livability +2.5/5.0
- Condition / age +2.5/5.0
- Schools +1.4/10.0
- Appreciation +0.0/10.0
$100,000
🖨 Deal sheet 📄 Offer letter ✓ Due diligence
Listing remarks MLS
This property offers a fantastic opportunity for investors looking to add value and generate strong returns. Whether you're looking for your next fix-and-flip or a long-term rental, this home has solid potential with the right vision. Featuring 2 bedrooms and 1 bathroom, this property sits in an area with ongoing growth and redevelopment, making it a smart addition to any investment portfolio. With comparable properties in the area showing strong resale and rental demand, the upside here is clear. Bring your contractor and your ideas. This is your chance to transform this property into a profitable asset.
Key facts
- 7,362 sq ft lot
- Built 1947
- Listed 65 days
Neighborhood map
What this means for you Summary
Snapshot
- This is a 2-bed/1.0-bath single-family listed at $100k.
Deal economics
- At list price, monthly cash flow is $180 ($2k/yr) — positive.
- The deal already cash-flows at list — no discount required.
- To meet the 1% rule (rent ≥ 1% of price), the offer needs to be $97k (2.9% below list).
- Recommended offer: $94k (6.0% below list) — sets the bar for market timing.
- Cap rate 8.5% vs local median 4.4% in Indianapolis city (balance) — top-decile yield for the area; either an underpriced asset or a hidden risk that comps aren't pricing in. Stress-test before assuming the spread holds.
Location & tenants
- Location reads: area grade C — affects rentability + tenant quality, not the cash-flow math above.
- Indianapolis Public Schools (urban): math 14% / reading 20% proficiency, ranked #286 of 301 in IN (top 95%) — low school quality limits family demand, transient renter base, plan for 1-2y turnover; 77% free/reduced lunch — lower-income household profile, screen leases tightly.
- Market conditions: Rents flat; 334 active listings in the ZIP; 31 comparable units currently listed for rent nearby; rentals at typical pace (median 24d on market — plan ~3-4 weeks tenant-placement turnaround); lower-income renter base — watch delinquency; 1,906 units permitted in Marion County in 2024 (621 in 5+ unit buildings).
- This rent runs 31% of the median local income ($38k/yr) — at the standard rent-burdened threshold; future hikes will face affordability resistance.
Forward outlook
- Local home prices are declining (-3.0%/yr); year-one equity from $691 of loan paydown is wiped out by about $3k of value loss. Plan a longer hold.
- Marion County population projected at +18% by 2050 — long-run rental-demand tailwind backs the buy-and-hold thesis.
Negotiation context
- It's been on market 65 days — a 6% lower offer ($94k) is reasonable based on typical stale-listing flexibility.
Risks & watch-outs
- Watch-outs: built in 1947 — expect roof / HVAC / electrical / plumbing capex.
Questions for the listing agent
- It's been on market 65 days. Have you received any prior offers? Is the seller open to a 6% concession, seller financing, or rate buy-down credit?
- Built in 1947 — when were the roof, HVAC, electrical panel, plumbing, and water heater last replaced?
- Why hasn't it sold? Are there any deal-killer items the seller is aware of (foundation, flood, title, zoning, code violations)?
- Is there a deadline driving the sale (1031 exchange, divorce, estate, relocation)? That informs how much negotiation room exists.
- What's the average days-on-market for RENTAL listings here right now (not sales)? A rising rental-DOM trend means longer vacancies and softer asking-rent achievability than the comps imply.
- What's the recent tenant-quality profile in this submarket — average credit score on applications, eviction rate, late-payment / NSF rate, and stable-employment percentage? A property-management company in the area should have these aggregated.
- How much new for-sale + rental construction is in the pipeline within 1–3 miles? Heavy new supply typically softens prices + rents 12–24 months out; constrained supply supports both.
Investment metrics
- 1% rule
- 0.97% ✗
- Cap rate
- 8.46%
- Cash-on-cash
- 7.73%
- DSCR
- 1.34
- GRM
- 8.6
CMA / ARV
- ARV (median comp)
- $126,210
- List price
- $100,000
- Delta
- -20.77%
- Verdict
- UNDERPRICED
- Comps
- 20 within 1.0 mi
Show comp detail 12 sales within ~0.75 mi
| Address | Dist | Beds/Ba | Sqft | Sold | Price | $/sf | Match |
|---|---|---|---|---|---|---|---|
| 3135 N Temple Ave | 0.18mi | 1/1.0 (-1) | 725 (-0%) | 4mo | $78,000 | $108 | 83 |
| 3114 Adams St | 0.44mi | 2/1.0 | 725 (-0%) | 3mo | $63,000 | $87 | 77 |
| 3105 N Tacoma Ave | 0.17mi | 2/1.0 | 696 (-4%) | 10mo | $137,500 | $198 | 76 |
| 3061 N Tacoma Ave | 0.15mi | 2/1.0 | 672 (-8%) | 6mo | $43,000 | $64 | 75 |
| 2959 N Lasalle St | 0.40mi | 2/1.0 | 720 (-1%) | 11mo | $59,900 | $83 | 71 |
| 2801 Brouse Ave | 0.37mi | 2/1.0 | 720 (-1%) | 13mo | $74,900 | $104 | 70 |
| 2724 N Dearborn St | 0.48mi | 2/1.0 | 720 (-1%) | 10mo | $95,000 | $132 | 68 |
| 2839 N Lasalle St | 0.46mi | 2/1.0 | 768 (+6%) | 5mo | $55,000 | $72 | 65 |
| 3145 Stuart St | 0.52mi | 2/1.0 | 725 (-0%) | 14mo | $79,000 | $109 | 63 |
| 2942 N Dearborn St | 0.31mi | 2/1.0 | 825 (+14%) | 7mo | $70,000 | $85 | 57 |
| 3331 Orchard Ave | 0.65mi | 2/1.0 | 720 (-1%) | 14mo | $115,000 | $160 | 56 |
| 3015 Adams St | 0.45mi | 2/1.0 | 819 (+13%) | 9mo | $155,000 | $189 | 50 |
Match score weights: distance 35% · size 25% · config 20% · recency 20%. Top-matched comps best support the ARV.
Projected returns pro-forma
-3.0% appreciation · 0.81% rent growth · sell at horizon
- IRR
- -6.8%
- Equity multiple
- 0.75×
- Total profit
- $-6,864
- Equity at exit
- $14,910
- IRR
- 0.2%
- Equity multiple
- 1.01×
- Total profit
- $388
- Equity at exit
- $8,646
Cash invested: $28,000 (down + closing). Projections, not guarantees.
Landlord ↔ Tenant lean methodology
- Overall (STATE)
- 90 Strongly Landlord-Friendly
- State Indiana
- 90 Strongly Landlord-Friendly · R+11
- County
- — inherits STATE
- City
- — inherits STATE
ZIP-level market 46218
- Home prices YoY
- -17.1%
- Rents YoY
- 0.8%
- Active inventory
- 334
- Price-to-rent
- 8.6×
Monthly cashflow live
- Estimated rent
- $971 high interval (Pro) →
- Mortgage (P&I)
- −$524
- Tax from tax record
- −$20 /mo · $245/yr
- Insurance
- −$42
- HOA
- −$0
- Vacancy / Maint / Mgmt
- −$204
- Net cashflow
- $180
Break-even live
UW: 25.0% down · 7.5% · 30yr · 1.5% tax · 5.0% vac · 8.0% maint · 8.0% mgmt
Financing live
Cash to close
- Down payment
- $25,000
- Closing costs
- $3,000
- Reserves months
- —
- Total cash needed
- —
Loan-product check · same deal, 3 products live
Conventional
25% down · 7.5% · 30yr
- Down + closing
- —
- Monthly P&I
- —
- Monthly cashflow
- —
- DSCR
- —
- Eligible?
- —
Personal DTI + credit; lowest rate.
DSCR
20% down · 8.5% · 30yr
- Down + closing
- —
- Monthly P&I
- —
- Monthly cashflow
- —
- DSCR
- —
- Eligible?
- —
No personal income docs; deal must DSCR.
Hard money
10% down · 12.0% · 12mo
- Down + closing
- —
- Monthly P&I
- —
- Monthly cashflow
- —
- DSCR
- —
- Eligible?
- —
Short-term bridge; refi at stabilization.
Rent comps 31 comps
| Address | Beds | Baths | Sqft | Rent | $/sqft | DOM | Units | Dist |
|---|---|---|---|---|---|---|---|---|
| 2930 N Dearborn St Indianapolis, IN | 1.0 | 1.0 | 536 | $599 | $1.12 | 23d | 1 | 0.32mi |
| 2530 N Temple Ave Indianapolis, IN | 1.0 | 1.0 | 720 | $750 | $1.04 | 20d | 1 | 0.47mi |
| 2821 Oxford Ln Indianapolis, IN | 1.0 | 1.0 | 640 | $825 | $1.29 | 43d | 1 | 0.51mi |
| 3011 Oxford Ln Indianapolis, IN | 1.0 | 1.0 | 640 | $800 | $1.25 | 43d | 1 | 0.55mi |
| 2449 Wheeler St Indianapolis, IN | 1.0 | 1.0 | 600 | $950 | $1.58 | 23d | 1 | 0.61mi |
| 3363 Nicholas Ave Indianapolis, IN | 2.0 | 1.0 | 720 | $1,000 | $1.39 | 3d | 1 | 0.64mi |
| 2519 Baltimore Ave Unit B Indianapolis, IN | 2.0 | 1.0 | 482 | $775 | $1.61 | 23d | 1 | 0.64mi |
| 2722 N Olney St Indianapolis, IN | 2.0 | 1.0 | 650 | $795 | $1.22 | 43d | 1 | 0.66mi |
| 2422 Adams St Unit 2 Indianapolis, IN | 1.0 | 1.0 | 700 | $850 | $1.21 | 43d | 1 | 0.72mi |
| 3421 N Olney St Indianapolis, IN | 2.0 | 1.0 | 720 | $1,195 | $1.66 | 16d | 1 | 0.80mi |
| 2372 Beckwith Dr Indianapolis, IN | 4.0 | 1.0–1.5 | 779 | $1,064 | $1.36 | 1d | 32 | 0.81mi |
| 3383 Station St Indianapolis, IN | 3.0 | 1.0 | 744 | $1,250 | $1.68 | 23d | 1 | 0.87mi |
| 3719 Hillside Ave Indianapolis, IN | 1.0 | 1.0 | 644 | $725 | $1.13 | 23d | 1 | 0.93mi |
| 2846 Doctor Andrew J Brown Ave Indianapolis, IN | 1.0 | 1.0 | 420 | $700 | $1.67 | 43d | 1 | 0.97mi |
| 3709 Kinnear Ave Indianapolis, IN | 2.0 | 1.0 | 650 | $1,000 | $1.54 | 43d | 1 | 0.98mi |
| 3132 Dr Andrew J Brown Ave Indianapolis, IN | 2.0 | 1.0–2.0 | 791 | $2,120 | $2.68 | 1d | 46 | 0.98mi |
| 3763 Baltimore Ave Unit 3765 Indianapolis, IN | 1.0 | 1.0 | 750 | $750 | $1.00 | 43d | 1 | 1.00mi |
| 3723 Orchard Ave Unit 3723 Indianapolis, IN | 1.0 | 1.5 | 700 | $1,300 | $1.86 | 23d | 1 | 1.03mi |
| 3725 N Sherman Dr #7 Indianapolis, IN | 2.0 | 1.0 | 729 | $845 | $1.16 | 3d | 1 | 1.23mi |
| 1931 N Oxford St Indianapolis, IN | 1.0 | 1.0 | 616 | $875 | $1.42 | 3d | 1 | 1.24mi |
| 3519 Balsam Ave Unit 7 Indianapolis, IN | 1.0 | 1.0 | 450 | $850 | $1.89 | 23d | 1 | 1.24mi |
| 3519 Balsam Ave Unit 6 Indianapolis, IN | 1.0 | 1.0 | 450 | $775 | $1.72 | 43d | 1 | 1.24mi |
| 3615 Sherman Forest Dr Indianapolis, IN | 4.0 | 1.0–2.5 | 1057 | $1,288 | $1.22 | 4d | 1 | 1.27mi |
| 3609 Balsam Ave Indianapolis, IN | 1.0 | 1.0 | 541 | $775 | $1.43 | 2d | 1 | 1.30mi |
| 3609 Balsam Ave Indianapolis, IN | 1.0 | 1.0 | 541 | $755 | $1.40 | 14d | 1 | 1.30mi |
| 3610 Balsam Ave Indianapolis, IN | 1.0 | 1.0 | 464 | $775 | $1.67 | 2d | 9 | 1.32mi |
| 2827 E 18th St Indianapolis, IN | 2.0 | 1.0 | 726 | $1,300 | $1.79 | 23d | 1 | 1.39mi |
| 1040 Fairfield Ave Unit 104011 Indianapolis, IN | 1.0 | 1.0 | 519 | $799 | $1.54 | 23d | 1 | 1.39mi |
| 4615 E 30th St Indianapolis, IN | 2.0 | 1.0 | 660 | $1,100 | $1.67 | 23d | 1 | 1.40mi |
| 3058 Brookside Parkway North Dr Indianapolis, IN | 1.0 | 1.0 | 700 | $875 | $1.25 | 12d | 1 | 1.44mi |
| 4115 Meadows Dr Indianapolis, IN | 1.0–3.0 | 1.0–2.0 | 1013 | $1,374 | $1.36 | 43d | 9 | 1.48mi |
Listing history 14 events
-
2026-06-18days on market $100,000 Active 65 DOM
-
2026-06-17days on market $100,000 Active 64 DOM
-
2026-06-16days on market $100,000 Active 63 DOM
-
2026-06-15days on market $100,000 Active 62 DOM
-
2026-06-13days on market $100,000 Active 60 DOM
-
2026-06-13days on market $100,000 Active 59 DOM
-
2026-06-09days on market $100,000 Active 56 DOM
-
2026-06-08days on market $100,000 Active 55 DOM
-
2026-06-07days on market $100,000 Active 54 DOM
-
2026-06-03days on market $100,000 Active 50 DOM
-
2026-06-02days on market $100,000 Active 49 DOM
-
2026-06-01days on market $100,000 Active 48 DOM
-
2026-05-31days on market $100,000 Active 47 DOM
-
2026-04-13$100,000 Active 612-char remark
Show marketing remark (612 chars)
This property offers a fantastic opportunity for investors looking to add value and generate strong returns. Whether you're looking for your next fix-and-flip or a long-term rental, this home has solid potential with the right vision. Featuring 2 bedrooms and 1 bathroom, this property sits in an area with ongoing growth and redevelopment, making it a smart addition to any investment portfolio. With comparable properties in the area showing strong resale and rental demand, the upside here is clear. Bring your contractor and your ideas. This is your chance to transform this property into a profitable asset.
ⓘ Source: listings_history table (triggers on properties + properties_extension) + one-shot
backfill from property_details.listing_events for pre-trigger history.
Tax reassessment forecast IN · Partial reset (capped growth)
- Current annual tax
- $245 · $20/mo
- Projected year-2 tax
- $548 · $46/mo
- Expected delta
- +$302/yr (+$25/mo · 123.3%)
ⓘ Screening estimate from a state-policy table — verify with the county assessor before closing.
Climate risk First Street
- Flood 1/10 Low FEMA zone X (unshaded) · 0% chance over 30 yrs
- Wildfire 1/10 Low
- Heat 3/10 Moderate 7 d/yr ≥102°F today · 18 d/yr by 30 yrs out
- Wind 2/10 Low 100% chance of damaging wind over 30 yrs
- Air quality 4/10 Moderate 5 unhealthy d/yr today · 7 by 30 yrs out
Nearby sold comps map
Loading sold comps map…
Walkable amenities ~0.75 mi
Loading nearby amenities…
Taxation est. · year 1
- Rental income
- $11,648
- − Mortgage interest
- −$5,602
- − Property taxes
- −$245
- − Insurance
- −$500
- − Repairs & maintenance
- −$932
- − Management
- −$932
- − Depreciation
- −$2,909
- Taxable income
- $528
- Est. tax owed @ 24.0%
- −$127
- After-tax cash flow
- $2,037/yr
For passive investors: Depreciation is non-cash, so a rental often shows a tax loss while cash-flowing — sheltering income. Rental losses are passive: they offset passive income freely, and up to $25,000/yr can offset ordinary (W-2) income if you actively participate and your MAGI is under $100k (phasing out to $0 by $150k); unused losses carry forward. On sale, claimed depreciation is recaptured at up to 25%, and gains may owe capital-gains tax (a 1031 exchange can defer both). Figures are a year-1 estimate at your 24.0% rate — not tax advice; consult a CPA.
Schools (NCES district)
- District
- Indianapolis Public Schools
- NCES district ID
- 1804770
- Math proficiency
- 14% ▼ -7.00%
- Reading proficiency
- 20% ▼ -3.00%
- Median HH income
- $32,034
- Composite
- 13.69/100
- National rank
- #9499
- State rank
- #286 of 301 in IN
Livability — Indianapolis city (balance)
No livability data for this city. (Only ~50 U.S. cities are tracked.)
Census & demographics
- Census place
- Indianapolis city (balance), IN
- County
- Marion County · 998,460 people
- City population
- 881,119
- Metro
- Indianapolis-Carmel-Anderson, IN
- Population (ZIP)
- 29,360
- Household income
- $38,063
- Rent vs Own
- Severe rent burden
- 2340.0
Population outlook (Marion County) Hauer SSP2
- Today (2025)
- 1,025,572 people
- By 2030
- 1,065,727 · +3.9%
- By 2040
- 1,141,577 · +11.3%
- By 2050
- 1,208,920 · +17.9%
- By 2075
- 1,367,288 · +33.3%
- By 2100
- 1,438,201 · +40.2%
Race, ethnicity, and origin ACS 2023
- Neighborhood character
- Predominantly Black (68%)
- Race & ethnicity
- Black 68% White 18% Hispanic / Latino 9% Two or more races 6%
- Hispanic origin (detail)
- Mexican 6%
- Common ancestry
- Romanian 1%
- Foreign-born
- 5% · Canada, Philippines
- Languages at home
- 92% English-only · Spanish 7%
Political lean MEDSL · Marion
- 2024 margin
- Strong D (+27.7) · D 63.0% · R 35.3% · Other 1.7%
- 2008→2024 swing
- -0.7pp no change · 2008: 28.4pp · 2024: 27.7pp
- All cycles
- 2024: D+27.7 2020: D+29.1 2016: D+22.8 2012: D+22.2 2008: D+28.4
Not yet ingested
- Civics
- —
Market trends
- HPI YoY
- ▼ -81.57%
- Current HPI
- 395.7071
- Rent YoY
- ▲ 0.81%
- Metro
- Indianapolis-Carmel-Anderson, IN
- State GDP YoY
- ▲ 2.90%
- F500 in state
- 18
Industry mix (Fortune 500 HQ in IN)
| Industry | F500 HQs | Revenue |
|---|---|---|
| Industrial Machinery | 2 | $37B |
|
||
| Healthcare | 1 | $177B |
|
||
| Pharmaceuticals | 1 | $45B |
|
||
| Metals / Steel | 1 | $18B |
|
||
| Agriculture | 1 | $17B |
|
||
| Packaging | 1 | $12B |
|
||
Price history
1 event — show timeline
- 2026-04-13 Listed $100,000 MIBOR as Distributed by MLS Grid
Property tax history
+3.0%/yrLatest (2025): $245 · -40.7% YoY. Source: county tax records.
Cash-flow waterfall
monthlySold comps — $/sqft
last 12 mo · ≤1 miLoading sold comps…